Downloaded 160 times
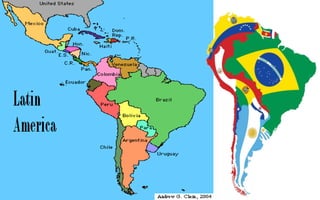
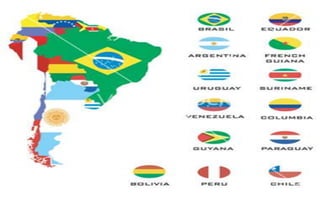


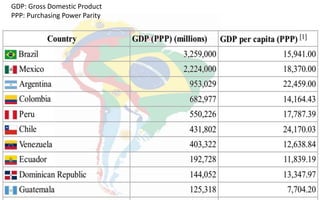
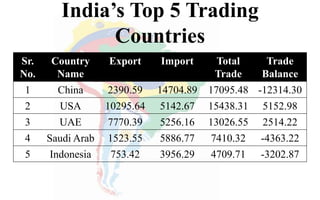
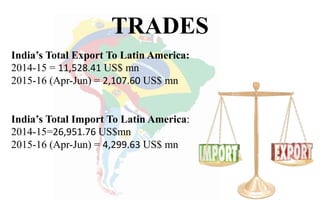
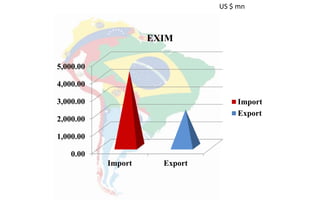
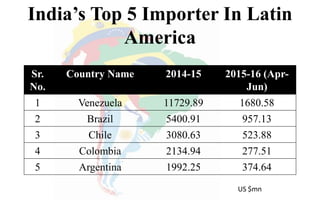
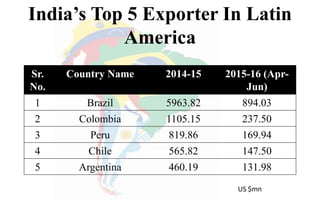
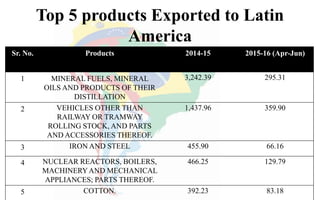
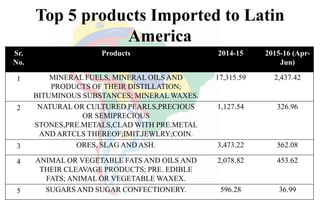
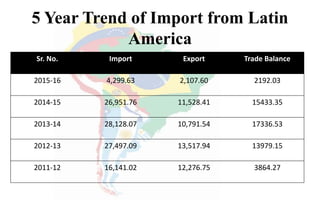
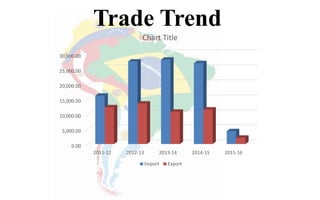
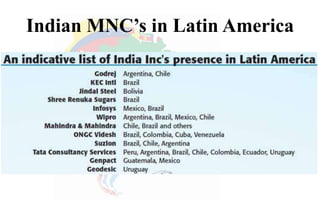
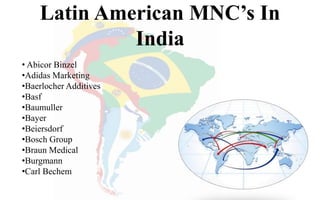

Latin America is a region comprising 20 countries in the Americas where Spanish and Portuguese are predominantly spoken. It stretches from the southern United States border to the southern tip of South America. Brazil, Colombia, Mexico and Argentina collectively account for over two-thirds of the region's economic output, with Brazil and Mexico being the largest and second largest economies respectively. India's trade with Latin America has been growing, with Brazil and Venezuela being two of India's top import partners and Brazil and Colombia being two of its top export partners. Key traded goods include mineral fuels, vehicles, iron and steel, and agricultural products. Several Latin American multinational companies have also established operations in India.


