Download to read offline

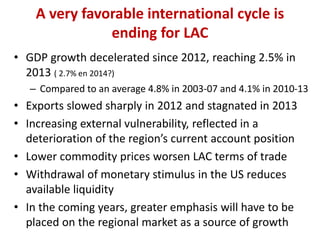


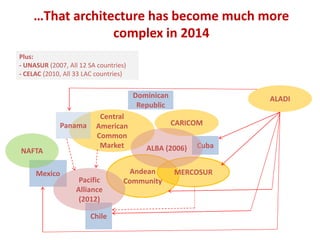

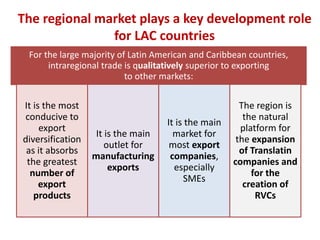


The document summarizes the state of regional integration in Latin America and identifies key challenges. It notes that Latin American countries trade far less with each other than other regions do internally. While regional integration has reduced tariffs, there remain significant shortcomings like insufficient regulatory harmonization, weak dispute settlement, and complex overlapping integration agreements. For regional integration to maximize benefits, the document argues Latin American countries need to further facilitate intraregional trade as their most conducive path for export diversification, SME growth, and socially inclusive development.


