SlideShare a Scribd company logo
Yacar-Yacara Consults – 2015 +2330501377013
YACAR-YACARA CONSULTS
yacaraconsults@yahoo.com
Screening and Cleaning Data
Before you start to analyse your data it is essential that you check your data set for errors. It is
very easy to make mistakes when entering data and unfortunately some errors can completely
mess up the entire analyses. For example, entering 35 when you mean to enter 3 can distort
the results of the analysis.
The data screening process involves a number of steps:
Step 1: Checking for errors. First, you need to check each of your variables for scores that are
out of range (i.e. not within the range of possible scores).
Step 2: Finding the error in the data file. Second, you need to find where in the data file this
error occurred (i.e. which case is involved).
Step 3: Correcting the error in the data file. Finally, you need to correct the error in the data
file itself.
Step 1: Checking for errors
When checking for errors you are primarily looking for values that fall outside the range of
possible values for a variable. For example, if sex is coded 1=male, 2=female, you should not
find any scores other than 1 or 2 for this variable.
Scores that fall outside the possible range can distort your statistical analyses so it is very
important that all these errors are corrected before you start.
To check for errors you will need to inspect the frequencies for each of your variables. This
includes all of the individual items that make up the scales. Errors must be corrected before
total scores for these scales are calculated.
Yacar-Yacara Consults – 2015 +2330501377013
Checking categorical variables
From the main menu at the top of the screen click on:
 Analyze
 Descriptive Statistics, then
 Frequencies
 Choose the variables that you wish to check (e.g. sex, marital, educ.).
 Click on the arrow button to move these into the variable box.
 Click on the Statistics button. Tick Minimum and Maximum in the Dispersion
section.
 Click on Continue and then on OK
There are two parts to the output. The first table provides a summary of each of the variables
you requested. The remaining tables give you a break-down, for each variable, of the range of
responses (these are listed using the value label, rather than the code number that was used).
Check your minimum and maximum values to see whether they are within the range of
possible scores on that variable? Check this against your codebook.
Check the number of valid cases and missing cases to see if there are missing cases.
If this occurs, open your Data Editor window, move down to the empty case row, click in the
shaded area where the case number appears and press Delete on your keypad.
Rerun the Frequencies procedure again to get the correct values.
Checking continuous variables
From the menu at the top of the screen click on
 Analyze,
 Descriptive statistics,
 Descriptives
 Click on the variables that you wish to check. Click on the arrow button to move them
into the Variables box (e.g. age).
 Click on the Options button. You can ask for a range of statistics, the main ones at
this stage are mean, standard deviation, minimum and maximum. Click on the
statistics you wish to generate.
 Click on Continue, and then on OK.
Yacar-Yacara Consults – 2015 +2330501377013
Check the minimum and maximum values. Do these make sense? Does the mean score also
make sense?
Step 2: Finding and correcting the error in the data file
How can you find out where the mistake is in your data set?
 Make sure that the Data Editor window is open and on the screen in front of you with
the data showing.
 Click on the variable name of the variable in which the error has occurred (e.g. sex).
 Click once to highlight the column.
 Click on Edit from the menu across the top of the screen. Click on Find
 In the Search for box, type in the incorrect value that you are looking for (e.g. 3).
 Click on Find next. SPSS will scan through the file and will stop at the first
occurrence of the value that you specified. Take note of the ID number of this case
(from the first row). You will need this to check your records or questionnaires to find
out what the value should be.
 Click on Search Forward again to continue searching for other cases with the same
incorrect value. You may need to do this a number of times before you reach the end
of the data set.
 To correct, place the cursor in the cell, make sure that it is highlighted and then just
type in the correct value.
Yacar-Yacara Consults – 2015 +2330501377013
Descriptive Statistics
Descriptive statistics have a number of uses. These include:
i. To describe the characteristics of your sample in the Method section of your report;
ii. To check your variables for any violation of the assumptions underlying the statistical
techniques that you will use to address your research questions; and
iii. To address specific research questions.
Tools
 Frequencies
 Descriptives
 Explore
 Cross tabulation
 Ratio
Frequencies
Descriptive Statistics
Frequencies (mostly for categorical variables)
 Analyze, then click on
 Descriptive Statistics,
 Frequencies.
 Select the categorical variables you are interested in (e.g. sex) and move them into the
Variables box.
 Click on the Statistics button. In the Dispersion section tick minimum and maximum.
 Click on Continue and then OK.
Descriptive (mostly for continuous variables)
Analyze, then click on
 Descriptive Statistics,
 Descriptives.
 Select all the continuous variables that you wish to obtain descriptive statistics
 Click on the arrow button to move them into the Variables box (e.g. age).
 Click on the Options button.
 Click on mean, standard deviation, minimum, maximum,
 Click on Continue, and then OK
Yacar-Yacara Consults – 2015 +2330501377013
Explore
It gives a detailed descriptive analysis of the variables. It presents a number of information
about the variables.
It provides results for:
 Mean
 Median
 Variance
 Percentile
 Kurtosis
 Skewness
 Etc..
Analyze, then click on
 Descriptive Statistics,
 Explore
 Select all the variables that you wish to explore
 Click on the arrow button to move them into the Variables box (e.g. age).
 Click on the Options button.
 Click on all the descriptive tools you want to explore ,
 Click on Continue, and then OK
Cross Tabulation
Cross tabulation is used to find the relationship between categorical variables. It gives a
descriptive presentation of the relationship between variables.
 Analyze, then click on
 Descriptive Statistics,
 Cross tabs.
 Select the categorical variables you are interested in (e.g. sex) and move them into the
Variables boxes.
 Click on the Statistics button. In the Dispersion section tick Minimum and
Maximum.
 Click on Continue and then OK.
Yacar-Yacara Consults – 2015 +2330501377013
Kofi Kyeremateng Nyanteng
YACAR-YACARA CONSULTS
+233243637096
+233501377013

More Related Content

What's hot

Multivariate analyses
Multivariate analysesMultivariate analyses
Multivariate analysesNaveen Deswal
 
Steps for q3 q4
Steps for q3 q4Steps for q3 q4
Steps for q3 q4
IIUM
 
Statistical software packages
Statistical software packagesStatistical software packages
Statistical software packages
Km Ashif
 
Performance Metrics for Machine Learning Algorithms
Performance Metrics for Machine Learning AlgorithmsPerformance Metrics for Machine Learning Algorithms
Performance Metrics for Machine Learning Algorithms
Kush Kulshrestha
 
Sensitivity analysis
Sensitivity analysisSensitivity analysis
Sensitivity analysis
Lashini Alahendra
 
Imputation Techniques For Market Research Datasets With Missing Values
Imputation Techniques For Market Research Datasets With Missing Values Imputation Techniques For Market Research Datasets With Missing Values
Imputation Techniques For Market Research Datasets With Missing Values
Salford Systems
 
Sensitivity analysis
Sensitivity analysisSensitivity analysis
Sensitivity analysis
sunilgv06
 
What if Analysis,Goal Seek Analysis,Sensitivity Analysis,Optimization Analysi...
What if Analysis,Goal Seek Analysis,Sensitivity Analysis,Optimization Analysi...What if Analysis,Goal Seek Analysis,Sensitivity Analysis,Optimization Analysi...
What if Analysis,Goal Seek Analysis,Sensitivity Analysis,Optimization Analysi...
Sourav Das
 
Data science 101 statistics overview
Data science 101 statistics overviewData science 101 statistics overview
Data science 101 statistics overview
Alejandro Gonzalez
 
Factor Analysis
Factor Analysis Factor Analysis
Factor Analysis
Raja Adapa
 
Exam Short Preparation on Data Analytics
Exam Short Preparation on Data AnalyticsExam Short Preparation on Data Analytics
Exam Short Preparation on Data Analytics
Harsh Parekh
 
Statistical Approaches to Missing Data
Statistical Approaches to Missing DataStatistical Approaches to Missing Data
Statistical Approaches to Missing Data
DataCards
 
Sensitivity analysis
Sensitivity analysisSensitivity analysis
Sensitivity analysis
Andreas Scheidegger
 
Spss basic Dr Marwa Zalat
Spss basic Dr Marwa ZalatSpss basic Dr Marwa Zalat
Spss basic Dr Marwa Zalat
Marwa Zalat
 
Guide to data analytics
Guide to data analyticsGuide to data analytics
Guide to data analytics
Debashish Jana
 
Biostatistics Workshop: Missing Data
Biostatistics Workshop: Missing DataBiostatistics Workshop: Missing Data
Biostatistics Workshop: Missing Data
HopkinsCFAR
 
Data Analysis
Data AnalysisData Analysis
Data Analysis
Andrea Wiggins
 
Multivariate data analysis
Multivariate data analysisMultivariate data analysis
Multivariate data analysisSetia Pramana
 

What's hot (19)

Multivariate analyses
Multivariate analysesMultivariate analyses
Multivariate analyses
 
Steps for q3 q4
Steps for q3 q4Steps for q3 q4
Steps for q3 q4
 
Statistical software packages
Statistical software packagesStatistical software packages
Statistical software packages
 
Data analysis
Data analysisData analysis
Data analysis
 
Performance Metrics for Machine Learning Algorithms
Performance Metrics for Machine Learning AlgorithmsPerformance Metrics for Machine Learning Algorithms
Performance Metrics for Machine Learning Algorithms
 
Sensitivity analysis
Sensitivity analysisSensitivity analysis
Sensitivity analysis
 
Imputation Techniques For Market Research Datasets With Missing Values
Imputation Techniques For Market Research Datasets With Missing Values Imputation Techniques For Market Research Datasets With Missing Values
Imputation Techniques For Market Research Datasets With Missing Values
 
Sensitivity analysis
Sensitivity analysisSensitivity analysis
Sensitivity analysis
 
What if Analysis,Goal Seek Analysis,Sensitivity Analysis,Optimization Analysi...
What if Analysis,Goal Seek Analysis,Sensitivity Analysis,Optimization Analysi...What if Analysis,Goal Seek Analysis,Sensitivity Analysis,Optimization Analysi...
What if Analysis,Goal Seek Analysis,Sensitivity Analysis,Optimization Analysi...
 
Data science 101 statistics overview
Data science 101 statistics overviewData science 101 statistics overview
Data science 101 statistics overview
 
Factor Analysis
Factor Analysis Factor Analysis
Factor Analysis
 
Exam Short Preparation on Data Analytics
Exam Short Preparation on Data AnalyticsExam Short Preparation on Data Analytics
Exam Short Preparation on Data Analytics
 
Statistical Approaches to Missing Data
Statistical Approaches to Missing DataStatistical Approaches to Missing Data
Statistical Approaches to Missing Data
 
Sensitivity analysis
Sensitivity analysisSensitivity analysis
Sensitivity analysis
 
Spss basic Dr Marwa Zalat
Spss basic Dr Marwa ZalatSpss basic Dr Marwa Zalat
Spss basic Dr Marwa Zalat
 
Guide to data analytics
Guide to data analyticsGuide to data analytics
Guide to data analytics
 
Biostatistics Workshop: Missing Data
Biostatistics Workshop: Missing DataBiostatistics Workshop: Missing Data
Biostatistics Workshop: Missing Data
 
Data Analysis
Data AnalysisData Analysis
Data Analysis
 
Multivariate data analysis
Multivariate data analysisMultivariate data analysis
Multivariate data analysis
 

Viewers also liked

Data cleaning and screening
Data cleaning and screeningData cleaning and screening
Data cleaning and screening
Hassan Hussein
 
Workshop on SPSS: Basic to Intermediate Level
Workshop on SPSS: Basic to Intermediate LevelWorkshop on SPSS: Basic to Intermediate Level
Workshop on SPSS: Basic to Intermediate Level
Hiram Ting
 
Brief Introduction to the 12 Steps of Evaluation Data Cleaning
Brief Introduction to the 12 Steps of Evaluation Data CleaningBrief Introduction to the 12 Steps of Evaluation Data Cleaning
Brief Introduction to the 12 Steps of Evaluation Data Cleaning
Jennifer Morrow
 
Data Cleaning Techniques
Data Cleaning TechniquesData Cleaning Techniques
Data Cleaning Techniques
Amir Masoud Sefidian
 
Capturing and Analyzing Qualitative Data in Surveys
Capturing and Analyzing Qualitative Data in SurveysCapturing and Analyzing Qualitative Data in Surveys
Capturing and Analyzing Qualitative Data in Surveys
Performance Solutions Corp.
 
Data Cleaning Process
Data Cleaning ProcessData Cleaning Process
Data Cleaning Process
InfoCheckPoint
 
Business Research Methods. data collection preparation and analysis
Business Research Methods. data collection preparation and analysisBusiness Research Methods. data collection preparation and analysis
Business Research Methods. data collection preparation and analysisAhsan Khan Eco (Superior College)
 
Data Processing
Data ProcessingData Processing
Data Processing-Presentation
Data Processing-PresentationData Processing-Presentation
Data Processing-Presentation
nibraspk
 
Analyzing survey data
Analyzing survey dataAnalyzing survey data
Analyzing survey data
Fatima Sultana
 
Spss lecture notes
Spss lecture notesSpss lecture notes
Spss lecture notesDavid mbwiga
 

Viewers also liked (12)

Data cleaning and screening
Data cleaning and screeningData cleaning and screening
Data cleaning and screening
 
Workshop on SPSS: Basic to Intermediate Level
Workshop on SPSS: Basic to Intermediate LevelWorkshop on SPSS: Basic to Intermediate Level
Workshop on SPSS: Basic to Intermediate Level
 
Brief Introduction to the 12 Steps of Evaluation Data Cleaning
Brief Introduction to the 12 Steps of Evaluation Data CleaningBrief Introduction to the 12 Steps of Evaluation Data Cleaning
Brief Introduction to the 12 Steps of Evaluation Data Cleaning
 
Data cleansing
Data cleansingData cleansing
Data cleansing
 
Data Cleaning Techniques
Data Cleaning TechniquesData Cleaning Techniques
Data Cleaning Techniques
 
Capturing and Analyzing Qualitative Data in Surveys
Capturing and Analyzing Qualitative Data in SurveysCapturing and Analyzing Qualitative Data in Surveys
Capturing and Analyzing Qualitative Data in Surveys
 
Data Cleaning Process
Data Cleaning ProcessData Cleaning Process
Data Cleaning Process
 
Business Research Methods. data collection preparation and analysis
Business Research Methods. data collection preparation and analysisBusiness Research Methods. data collection preparation and analysis
Business Research Methods. data collection preparation and analysis
 
Data Processing
Data ProcessingData Processing
Data Processing
 
Data Processing-Presentation
Data Processing-PresentationData Processing-Presentation
Data Processing-Presentation
 
Analyzing survey data
Analyzing survey dataAnalyzing survey data
Analyzing survey data
 
Spss lecture notes
Spss lecture notesSpss lecture notes
Spss lecture notes
 

Similar to Kofi nyanteng cleaning and screning data using spss

Introduction to spss
Introduction to spssIntroduction to spss
Introduction to spss
Subodh Khanal
 
SPSS FINAL.pdf
SPSS FINAL.pdfSPSS FINAL.pdf
SPSS FINAL.pdf
Thanavathi C
 
Statistical Package for Social Science (SPSS)
Statistical Package for Social Science (SPSS)Statistical Package for Social Science (SPSS)
Statistical Package for Social Science (SPSS)
sspink
 
chi square goodness of fit test (equal ratio) (procedure and output)
chi square goodness of fit test (equal ratio) (procedure and output)chi square goodness of fit test (equal ratio) (procedure and output)
chi square goodness of fit test (equal ratio) (procedure and output)
Unexplord Solutions LLP
 
Big Data Analytics Tools..DS_Store__MACOSXBig Data Analyti.docx
Big Data Analytics Tools..DS_Store__MACOSXBig Data Analyti.docxBig Data Analytics Tools..DS_Store__MACOSXBig Data Analyti.docx
Big Data Analytics Tools..DS_Store__MACOSXBig Data Analyti.docx
tangyechloe
 
data analysis techniques and statistical softwares
data analysis techniques and statistical softwaresdata analysis techniques and statistical softwares
data analysis techniques and statistical softwares
Dr.ammara khakwani
 
04 statistics presentation_notes
04 statistics presentation_notes04 statistics presentation_notes
04 statistics presentation_notesnaftzingerj
 
TMGT 361Assignment V InstructionsLectureEssayStatistics 001.docx
TMGT 361Assignment V InstructionsLectureEssayStatistics 001.docxTMGT 361Assignment V InstructionsLectureEssayStatistics 001.docx
TMGT 361Assignment V InstructionsLectureEssayStatistics 001.docx
herthalearmont
 
Spss guidelines
Spss guidelinesSpss guidelines
Spss guidelines
APPOLINAIRE BIZIMANA
 
chi square goodness of fit test (expected ratio) (procedure and output)
chi square goodness of fit test (expected ratio) (procedure and output)chi square goodness of fit test (expected ratio) (procedure and output)
chi square goodness of fit test (expected ratio) (procedure and output)
Unexplord Solutions LLP
 
Quality management questionnaire
Quality management questionnaireQuality management questionnaire
Quality management questionnaireselinasimpson2801
 
TMGT 361Assignment VII A InstructionsLectureEssayControl Ch.docx
TMGT 361Assignment VII A InstructionsLectureEssayControl Ch.docxTMGT 361Assignment VII A InstructionsLectureEssayControl Ch.docx
TMGT 361Assignment VII A InstructionsLectureEssayControl Ch.docx
herthalearmont
 
excel_stats_handout_npl.pdf
excel_stats_handout_npl.pdfexcel_stats_handout_npl.pdf
excel_stats_handout_npl.pdf
FormadorRicardoCastr
 
Quality_Control_Tools.ppt
Quality_Control_Tools.pptQuality_Control_Tools.ppt
Quality_Control_Tools.ppt
Murali Sama rao
 
SPSS :Introduction for beginners
SPSS :Introduction for beginners SPSS :Introduction for beginners
SPSS :Introduction for beginners
PRAKASAM C P
 
extra material for practicals in spss.pptx
extra material for practicals in spss.pptxextra material for practicals in spss.pptx
extra material for practicals in spss.pptx
MrMuhammadAsif1
 
Data analysis using spss
Data analysis using spssData analysis using spss
Data analysis using spss
Muhammad Ibrahim
 
Factor analysis using spss 2005
Factor analysis using spss 2005Factor analysis using spss 2005
Factor analysis using spss 2005
jamescupello
 

Similar to Kofi nyanteng cleaning and screning data using spss (20)

Introduction to spss
Introduction to spssIntroduction to spss
Introduction to spss
 
SPSS FINAL.pdf
SPSS FINAL.pdfSPSS FINAL.pdf
SPSS FINAL.pdf
 
Statistical Package for Social Science (SPSS)
Statistical Package for Social Science (SPSS)Statistical Package for Social Science (SPSS)
Statistical Package for Social Science (SPSS)
 
chi square goodness of fit test (equal ratio) (procedure and output)
chi square goodness of fit test (equal ratio) (procedure and output)chi square goodness of fit test (equal ratio) (procedure and output)
chi square goodness of fit test (equal ratio) (procedure and output)
 
(Manual spss)
(Manual spss)(Manual spss)
(Manual spss)
 
Big Data Analytics Tools..DS_Store__MACOSXBig Data Analyti.docx
Big Data Analytics Tools..DS_Store__MACOSXBig Data Analyti.docxBig Data Analytics Tools..DS_Store__MACOSXBig Data Analyti.docx
Big Data Analytics Tools..DS_Store__MACOSXBig Data Analyti.docx
 
data analysis techniques and statistical softwares
data analysis techniques and statistical softwaresdata analysis techniques and statistical softwares
data analysis techniques and statistical softwares
 
04 statistics presentation_notes
04 statistics presentation_notes04 statistics presentation_notes
04 statistics presentation_notes
 
TMGT 361Assignment V InstructionsLectureEssayStatistics 001.docx
TMGT 361Assignment V InstructionsLectureEssayStatistics 001.docxTMGT 361Assignment V InstructionsLectureEssayStatistics 001.docx
TMGT 361Assignment V InstructionsLectureEssayStatistics 001.docx
 
Spss guidelines
Spss guidelinesSpss guidelines
Spss guidelines
 
chi square goodness of fit test (expected ratio) (procedure and output)
chi square goodness of fit test (expected ratio) (procedure and output)chi square goodness of fit test (expected ratio) (procedure and output)
chi square goodness of fit test (expected ratio) (procedure and output)
 
Quality management questionnaire
Quality management questionnaireQuality management questionnaire
Quality management questionnaire
 
TMGT 361Assignment VII A InstructionsLectureEssayControl Ch.docx
TMGT 361Assignment VII A InstructionsLectureEssayControl Ch.docxTMGT 361Assignment VII A InstructionsLectureEssayControl Ch.docx
TMGT 361Assignment VII A InstructionsLectureEssayControl Ch.docx
 
excel_stats_handout_npl.pdf
excel_stats_handout_npl.pdfexcel_stats_handout_npl.pdf
excel_stats_handout_npl.pdf
 
Quality_Control_Tools.ppt
Quality_Control_Tools.pptQuality_Control_Tools.ppt
Quality_Control_Tools.ppt
 
SPSS :Introduction for beginners
SPSS :Introduction for beginners SPSS :Introduction for beginners
SPSS :Introduction for beginners
 
extra material for practicals in spss.pptx
extra material for practicals in spss.pptxextra material for practicals in spss.pptx
extra material for practicals in spss.pptx
 
Data analysis using spss
Data analysis using spssData analysis using spss
Data analysis using spss
 
Factor analysis using spss 2005
Factor analysis using spss 2005Factor analysis using spss 2005
Factor analysis using spss 2005
 
Btech quality management
Btech quality managementBtech quality management
Btech quality management
 

More from Kofi Kyeremateng Nyanteng

Kofi nyanteng excel notes
Kofi nyanteng excel notesKofi nyanteng excel notes
Kofi nyanteng excel notes
Kofi Kyeremateng Nyanteng
 
Kofi nyanteng excel modelling (what if analysis)
Kofi nyanteng excel modelling (what if analysis)Kofi nyanteng excel modelling (what if analysis)
Kofi nyanteng excel modelling (what if analysis)
Kofi Kyeremateng Nyanteng
 
Kofi Nyanteng Introduction excel modelling
Kofi Nyanteng Introduction excel modellingKofi Nyanteng Introduction excel modelling
Kofi Nyanteng Introduction excel modelling
Kofi Kyeremateng Nyanteng
 
Kofi nyanteng excel notes
Kofi nyanteng excel notesKofi nyanteng excel notes
Kofi nyanteng excel notes
Kofi Kyeremateng Nyanteng
 
Kofi nyanteng excel models
Kofi nyanteng   excel modelsKofi nyanteng   excel models
Kofi nyanteng excel models
Kofi Kyeremateng Nyanteng
 
Kofi nyanteng excel modelling (what if analysis)
Kofi nyanteng excel modelling (what if analysis)Kofi nyanteng excel modelling (what if analysis)
Kofi nyanteng excel modelling (what if analysis)
Kofi Kyeremateng Nyanteng
 
Kofi Nyanteng Introduction excel modelling
Kofi Nyanteng Introduction excel modellingKofi Nyanteng Introduction excel modelling
Kofi Nyanteng Introduction excel modelling
Kofi Kyeremateng Nyanteng
 
Kofi nyanteng spss descriptives
Kofi nyanteng spss descriptivesKofi nyanteng spss descriptives
Kofi nyanteng spss descriptives
Kofi Kyeremateng Nyanteng
 
Kofi nyanteng spss associative data analysis
Kofi nyanteng spss associative data analysisKofi nyanteng spss associative data analysis
Kofi nyanteng spss associative data analysis
Kofi Kyeremateng Nyanteng
 
Marketing Mgt. notes and Planning template for SMEs
Marketing Mgt. notes and Planning template for SMEsMarketing Mgt. notes and Planning template for SMEs
Marketing Mgt. notes and Planning template for SMEs
Kofi Kyeremateng Nyanteng
 
Starting your business & Idea evaluation
Starting your business & Idea evaluationStarting your business & Idea evaluation
Starting your business & Idea evaluation
Kofi Kyeremateng Nyanteng
 
Social media planning template
Social media planning templateSocial media planning template
Social media planning template
Kofi Kyeremateng Nyanteng
 
Social Media
Social MediaSocial Media
Developing the social media plan & policy
Developing the social media plan & policyDeveloping the social media plan & policy
Developing the social media plan & policy
Kofi Kyeremateng Nyanteng
 
SPSS
SPSSSPSS
SPSS
SPSSSPSS

More from Kofi Kyeremateng Nyanteng (19)

Kofi nyanteng excel notes
Kofi nyanteng excel notesKofi nyanteng excel notes
Kofi nyanteng excel notes
 
Kofi nyanteng excel modelling (what if analysis)
Kofi nyanteng excel modelling (what if analysis)Kofi nyanteng excel modelling (what if analysis)
Kofi nyanteng excel modelling (what if analysis)
 
Kofi Nyanteng Introduction excel modelling
Kofi Nyanteng Introduction excel modellingKofi Nyanteng Introduction excel modelling
Kofi Nyanteng Introduction excel modelling
 
Kofi nyanteng excel notes
Kofi nyanteng excel notesKofi nyanteng excel notes
Kofi nyanteng excel notes
 
Kofi nyanteng excel models
Kofi nyanteng   excel modelsKofi nyanteng   excel models
Kofi nyanteng excel models
 
Kofi nyanteng excel modelling (what if analysis)
Kofi nyanteng excel modelling (what if analysis)Kofi nyanteng excel modelling (what if analysis)
Kofi nyanteng excel modelling (what if analysis)
 
Kofi Nyanteng Introduction excel modelling
Kofi Nyanteng Introduction excel modellingKofi Nyanteng Introduction excel modelling
Kofi Nyanteng Introduction excel modelling
 
Kofi nyanteng spss descriptives
Kofi nyanteng spss descriptivesKofi nyanteng spss descriptives
Kofi nyanteng spss descriptives
 
Kofi nyanteng spss associative data analysis
Kofi nyanteng spss associative data analysisKofi nyanteng spss associative data analysis
Kofi nyanteng spss associative data analysis
 
Marketing Mgt. notes and Planning template for SMEs
Marketing Mgt. notes and Planning template for SMEsMarketing Mgt. notes and Planning template for SMEs
Marketing Mgt. notes and Planning template for SMEs
 
Starting your business & Idea evaluation
Starting your business & Idea evaluationStarting your business & Idea evaluation
Starting your business & Idea evaluation
 
Social media planning template
Social media planning templateSocial media planning template
Social media planning template
 
Social Media
Social MediaSocial Media
Social Media
 
Developing the social media plan & policy
Developing the social media plan & policyDeveloping the social media plan & policy
Developing the social media plan & policy
 
Personal Branding 1
Personal Branding 1Personal Branding 1
Personal Branding 1
 
SPSS SLIDES
SPSS SLIDES SPSS SLIDES
SPSS SLIDES
 
SPSS
SPSSSPSS
SPSS
 
SPSS
SPSSSPSS
SPSS
 
STATA 13
STATA 13STATA 13
STATA 13
 

Recently uploaded

原版制作(Deakin毕业证书)迪肯大学毕业证学位证一模一样
原版制作(Deakin毕业证书)迪肯大学毕业证学位证一模一样原版制作(Deakin毕业证书)迪肯大学毕业证学位证一模一样
原版制作(Deakin毕业证书)迪肯大学毕业证学位证一模一样
u86oixdj
 
一比一原版(UIUC毕业证)伊利诺伊大学|厄巴纳-香槟分校毕业证如何办理
一比一原版(UIUC毕业证)伊利诺伊大学|厄巴纳-香槟分校毕业证如何办理一比一原版(UIUC毕业证)伊利诺伊大学|厄巴纳-香槟分校毕业证如何办理
一比一原版(UIUC毕业证)伊利诺伊大学|厄巴纳-香槟分校毕业证如何办理
ahzuo
 
Everything you wanted to know about LIHTC
Everything you wanted to know about LIHTCEverything you wanted to know about LIHTC
Everything you wanted to know about LIHTC
Roger Valdez
 
Best best suvichar in gujarati english meaning of this sentence as Silk road ...
Best best suvichar in gujarati english meaning of this sentence as Silk road ...Best best suvichar in gujarati english meaning of this sentence as Silk road ...
Best best suvichar in gujarati english meaning of this sentence as Silk road ...
AbhimanyuSinha9
 
Enhanced Enterprise Intelligence with your personal AI Data Copilot.pdf
Enhanced Enterprise Intelligence with your personal AI Data Copilot.pdfEnhanced Enterprise Intelligence with your personal AI Data Copilot.pdf
Enhanced Enterprise Intelligence with your personal AI Data Copilot.pdf
GetInData
 
06-04-2024 - NYC Tech Week - Discussion on Vector Databases, Unstructured Dat...
06-04-2024 - NYC Tech Week - Discussion on Vector Databases, Unstructured Dat...06-04-2024 - NYC Tech Week - Discussion on Vector Databases, Unstructured Dat...
06-04-2024 - NYC Tech Week - Discussion on Vector Databases, Unstructured Dat...
Timothy Spann
 
一比一原版(Adelaide毕业证书)阿德莱德大学毕业证如何办理
一比一原版(Adelaide毕业证书)阿德莱德大学毕业证如何办理一比一原版(Adelaide毕业证书)阿德莱德大学毕业证如何办理
一比一原版(Adelaide毕业证书)阿德莱德大学毕业证如何办理
slg6lamcq
 
Chatty Kathy - UNC Bootcamp Final Project Presentation - Final Version - 5.23...
Chatty Kathy - UNC Bootcamp Final Project Presentation - Final Version - 5.23...Chatty Kathy - UNC Bootcamp Final Project Presentation - Final Version - 5.23...
Chatty Kathy - UNC Bootcamp Final Project Presentation - Final Version - 5.23...
John Andrews
 
一比一原版(BCU毕业证书)伯明翰城市大学毕业证如何办理
一比一原版(BCU毕业证书)伯明翰城市大学毕业证如何办理一比一原版(BCU毕业证书)伯明翰城市大学毕业证如何办理
一比一原版(BCU毕业证书)伯明翰城市大学毕业证如何办理
dwreak4tg
 
一比一原版(UniSA毕业证书)南澳大学毕业证如何办理
一比一原版(UniSA毕业证书)南澳大学毕业证如何办理一比一原版(UniSA毕业证书)南澳大学毕业证如何办理
一比一原版(UniSA毕业证书)南澳大学毕业证如何办理
slg6lamcq
 
原版制作(swinburne毕业证书)斯威本科技大学毕业证毕业完成信一模一样
原版制作(swinburne毕业证书)斯威本科技大学毕业证毕业完成信一模一样原版制作(swinburne毕业证书)斯威本科技大学毕业证毕业完成信一模一样
原版制作(swinburne毕业证书)斯威本科技大学毕业证毕业完成信一模一样
u86oixdj
 
Criminal IP - Threat Hunting Webinar.pdf
Criminal IP - Threat Hunting Webinar.pdfCriminal IP - Threat Hunting Webinar.pdf
Criminal IP - Threat Hunting Webinar.pdf
Criminal IP
 
哪里卖(usq毕业证书)南昆士兰大学毕业证研究生文凭证书托福证书原版一模一样
哪里卖(usq毕业证书)南昆士兰大学毕业证研究生文凭证书托福证书原版一模一样哪里卖(usq毕业证书)南昆士兰大学毕业证研究生文凭证书托福证书原版一模一样
哪里卖(usq毕业证书)南昆士兰大学毕业证研究生文凭证书托福证书原版一模一样
axoqas
 
Malana- Gimlet Market Analysis (Portfolio 2)
Malana- Gimlet Market Analysis (Portfolio 2)Malana- Gimlet Market Analysis (Portfolio 2)
Malana- Gimlet Market Analysis (Portfolio 2)
TravisMalana
 
Ch03-Managing the Object-Oriented Information Systems Project a.pdf
Ch03-Managing the Object-Oriented Information Systems Project a.pdfCh03-Managing the Object-Oriented Information Systems Project a.pdf
Ch03-Managing the Object-Oriented Information Systems Project a.pdf
haila53
 
Machine learning and optimization techniques for electrical drives.pptx
Machine learning and optimization techniques for electrical drives.pptxMachine learning and optimization techniques for electrical drives.pptx
Machine learning and optimization techniques for electrical drives.pptx
balafet
 
一比一原版(UofS毕业证书)萨省大学毕业证如何办理
一比一原版(UofS毕业证书)萨省大学毕业证如何办理一比一原版(UofS毕业证书)萨省大学毕业证如何办理
一比一原版(UofS毕业证书)萨省大学毕业证如何办理
v3tuleee
 
06-04-2024 - NYC Tech Week - Discussion on Vector Databases, Unstructured Dat...
06-04-2024 - NYC Tech Week - Discussion on Vector Databases, Unstructured Dat...06-04-2024 - NYC Tech Week - Discussion on Vector Databases, Unstructured Dat...
06-04-2024 - NYC Tech Week - Discussion on Vector Databases, Unstructured Dat...
Timothy Spann
 
一比一原版(爱大毕业证书)爱丁堡大学毕业证如何办理
一比一原版(爱大毕业证书)爱丁堡大学毕业证如何办理一比一原版(爱大毕业证书)爱丁堡大学毕业证如何办理
一比一原版(爱大毕业证书)爱丁堡大学毕业证如何办理
g4dpvqap0
 
一比一原版(Coventry毕业证书)考文垂大学毕业证如何办理
一比一原版(Coventry毕业证书)考文垂大学毕业证如何办理一比一原版(Coventry毕业证书)考文垂大学毕业证如何办理
一比一原版(Coventry毕业证书)考文垂大学毕业证如何办理
74nqk8xf
 

Recently uploaded (20)

原版制作(Deakin毕业证书)迪肯大学毕业证学位证一模一样
原版制作(Deakin毕业证书)迪肯大学毕业证学位证一模一样原版制作(Deakin毕业证书)迪肯大学毕业证学位证一模一样
原版制作(Deakin毕业证书)迪肯大学毕业证学位证一模一样
 
一比一原版(UIUC毕业证)伊利诺伊大学|厄巴纳-香槟分校毕业证如何办理
一比一原版(UIUC毕业证)伊利诺伊大学|厄巴纳-香槟分校毕业证如何办理一比一原版(UIUC毕业证)伊利诺伊大学|厄巴纳-香槟分校毕业证如何办理
一比一原版(UIUC毕业证)伊利诺伊大学|厄巴纳-香槟分校毕业证如何办理
 
Everything you wanted to know about LIHTC
Everything you wanted to know about LIHTCEverything you wanted to know about LIHTC
Everything you wanted to know about LIHTC
 
Best best suvichar in gujarati english meaning of this sentence as Silk road ...
Best best suvichar in gujarati english meaning of this sentence as Silk road ...Best best suvichar in gujarati english meaning of this sentence as Silk road ...
Best best suvichar in gujarati english meaning of this sentence as Silk road ...
 
Enhanced Enterprise Intelligence with your personal AI Data Copilot.pdf
Enhanced Enterprise Intelligence with your personal AI Data Copilot.pdfEnhanced Enterprise Intelligence with your personal AI Data Copilot.pdf
Enhanced Enterprise Intelligence with your personal AI Data Copilot.pdf
 
06-04-2024 - NYC Tech Week - Discussion on Vector Databases, Unstructured Dat...
06-04-2024 - NYC Tech Week - Discussion on Vector Databases, Unstructured Dat...06-04-2024 - NYC Tech Week - Discussion on Vector Databases, Unstructured Dat...
06-04-2024 - NYC Tech Week - Discussion on Vector Databases, Unstructured Dat...
 
一比一原版(Adelaide毕业证书)阿德莱德大学毕业证如何办理
一比一原版(Adelaide毕业证书)阿德莱德大学毕业证如何办理一比一原版(Adelaide毕业证书)阿德莱德大学毕业证如何办理
一比一原版(Adelaide毕业证书)阿德莱德大学毕业证如何办理
 
Chatty Kathy - UNC Bootcamp Final Project Presentation - Final Version - 5.23...
Chatty Kathy - UNC Bootcamp Final Project Presentation - Final Version - 5.23...Chatty Kathy - UNC Bootcamp Final Project Presentation - Final Version - 5.23...
Chatty Kathy - UNC Bootcamp Final Project Presentation - Final Version - 5.23...
 
一比一原版(BCU毕业证书)伯明翰城市大学毕业证如何办理
一比一原版(BCU毕业证书)伯明翰城市大学毕业证如何办理一比一原版(BCU毕业证书)伯明翰城市大学毕业证如何办理
一比一原版(BCU毕业证书)伯明翰城市大学毕业证如何办理
 
一比一原版(UniSA毕业证书)南澳大学毕业证如何办理
一比一原版(UniSA毕业证书)南澳大学毕业证如何办理一比一原版(UniSA毕业证书)南澳大学毕业证如何办理
一比一原版(UniSA毕业证书)南澳大学毕业证如何办理
 
原版制作(swinburne毕业证书)斯威本科技大学毕业证毕业完成信一模一样
原版制作(swinburne毕业证书)斯威本科技大学毕业证毕业完成信一模一样原版制作(swinburne毕业证书)斯威本科技大学毕业证毕业完成信一模一样
原版制作(swinburne毕业证书)斯威本科技大学毕业证毕业完成信一模一样
 
Criminal IP - Threat Hunting Webinar.pdf
Criminal IP - Threat Hunting Webinar.pdfCriminal IP - Threat Hunting Webinar.pdf
Criminal IP - Threat Hunting Webinar.pdf
 
哪里卖(usq毕业证书)南昆士兰大学毕业证研究生文凭证书托福证书原版一模一样
哪里卖(usq毕业证书)南昆士兰大学毕业证研究生文凭证书托福证书原版一模一样哪里卖(usq毕业证书)南昆士兰大学毕业证研究生文凭证书托福证书原版一模一样
哪里卖(usq毕业证书)南昆士兰大学毕业证研究生文凭证书托福证书原版一模一样
 
Malana- Gimlet Market Analysis (Portfolio 2)
Malana- Gimlet Market Analysis (Portfolio 2)Malana- Gimlet Market Analysis (Portfolio 2)
Malana- Gimlet Market Analysis (Portfolio 2)
 
Ch03-Managing the Object-Oriented Information Systems Project a.pdf
Ch03-Managing the Object-Oriented Information Systems Project a.pdfCh03-Managing the Object-Oriented Information Systems Project a.pdf
Ch03-Managing the Object-Oriented Information Systems Project a.pdf
 
Machine learning and optimization techniques for electrical drives.pptx
Machine learning and optimization techniques for electrical drives.pptxMachine learning and optimization techniques for electrical drives.pptx
Machine learning and optimization techniques for electrical drives.pptx
 
一比一原版(UofS毕业证书)萨省大学毕业证如何办理
一比一原版(UofS毕业证书)萨省大学毕业证如何办理一比一原版(UofS毕业证书)萨省大学毕业证如何办理
一比一原版(UofS毕业证书)萨省大学毕业证如何办理
 
06-04-2024 - NYC Tech Week - Discussion on Vector Databases, Unstructured Dat...
06-04-2024 - NYC Tech Week - Discussion on Vector Databases, Unstructured Dat...06-04-2024 - NYC Tech Week - Discussion on Vector Databases, Unstructured Dat...
06-04-2024 - NYC Tech Week - Discussion on Vector Databases, Unstructured Dat...
 
一比一原版(爱大毕业证书)爱丁堡大学毕业证如何办理
一比一原版(爱大毕业证书)爱丁堡大学毕业证如何办理一比一原版(爱大毕业证书)爱丁堡大学毕业证如何办理
一比一原版(爱大毕业证书)爱丁堡大学毕业证如何办理
 
一比一原版(Coventry毕业证书)考文垂大学毕业证如何办理
一比一原版(Coventry毕业证书)考文垂大学毕业证如何办理一比一原版(Coventry毕业证书)考文垂大学毕业证如何办理
一比一原版(Coventry毕业证书)考文垂大学毕业证如何办理
 

Kofi nyanteng cleaning and screning data using spss

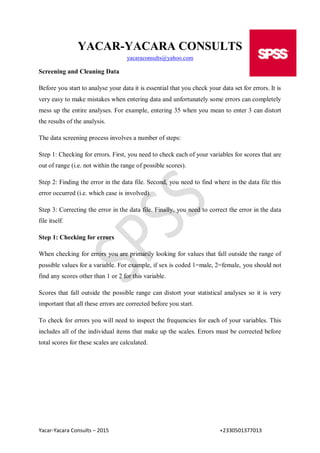
  • 1. Yacar-Yacara Consults – 2015 +2330501377013 YACAR-YACARA CONSULTS yacaraconsults@yahoo.com Screening and Cleaning Data Before you start to analyse your data it is essential that you check your data set for errors. It is very easy to make mistakes when entering data and unfortunately some errors can completely mess up the entire analyses. For example, entering 35 when you mean to enter 3 can distort the results of the analysis. The data screening process involves a number of steps: Step 1: Checking for errors. First, you need to check each of your variables for scores that are out of range (i.e. not within the range of possible scores). Step 2: Finding the error in the data file. Second, you need to find where in the data file this error occurred (i.e. which case is involved). Step 3: Correcting the error in the data file. Finally, you need to correct the error in the data file itself. Step 1: Checking for errors When checking for errors you are primarily looking for values that fall outside the range of possible values for a variable. For example, if sex is coded 1=male, 2=female, you should not find any scores other than 1 or 2 for this variable. Scores that fall outside the possible range can distort your statistical analyses so it is very important that all these errors are corrected before you start. To check for errors you will need to inspect the frequencies for each of your variables. This includes all of the individual items that make up the scales. Errors must be corrected before total scores for these scales are calculated.
  • 2. Yacar-Yacara Consults – 2015 +2330501377013 Checking categorical variables From the main menu at the top of the screen click on:  Analyze  Descriptive Statistics, then  Frequencies  Choose the variables that you wish to check (e.g. sex, marital, educ.).  Click on the arrow button to move these into the variable box.  Click on the Statistics button. Tick Minimum and Maximum in the Dispersion section.  Click on Continue and then on OK There are two parts to the output. The first table provides a summary of each of the variables you requested. The remaining tables give you a break-down, for each variable, of the range of responses (these are listed using the value label, rather than the code number that was used). Check your minimum and maximum values to see whether they are within the range of possible scores on that variable? Check this against your codebook. Check the number of valid cases and missing cases to see if there are missing cases. If this occurs, open your Data Editor window, move down to the empty case row, click in the shaded area where the case number appears and press Delete on your keypad. Rerun the Frequencies procedure again to get the correct values. Checking continuous variables From the menu at the top of the screen click on  Analyze,  Descriptive statistics,  Descriptives  Click on the variables that you wish to check. Click on the arrow button to move them into the Variables box (e.g. age).  Click on the Options button. You can ask for a range of statistics, the main ones at this stage are mean, standard deviation, minimum and maximum. Click on the statistics you wish to generate.  Click on Continue, and then on OK.
  • 3. Yacar-Yacara Consults – 2015 +2330501377013 Check the minimum and maximum values. Do these make sense? Does the mean score also make sense? Step 2: Finding and correcting the error in the data file How can you find out where the mistake is in your data set?  Make sure that the Data Editor window is open and on the screen in front of you with the data showing.  Click on the variable name of the variable in which the error has occurred (e.g. sex).  Click once to highlight the column.  Click on Edit from the menu across the top of the screen. Click on Find  In the Search for box, type in the incorrect value that you are looking for (e.g. 3).  Click on Find next. SPSS will scan through the file and will stop at the first occurrence of the value that you specified. Take note of the ID number of this case (from the first row). You will need this to check your records or questionnaires to find out what the value should be.  Click on Search Forward again to continue searching for other cases with the same incorrect value. You may need to do this a number of times before you reach the end of the data set.  To correct, place the cursor in the cell, make sure that it is highlighted and then just type in the correct value.
  • 4. Yacar-Yacara Consults – 2015 +2330501377013 Descriptive Statistics Descriptive statistics have a number of uses. These include: i. To describe the characteristics of your sample in the Method section of your report; ii. To check your variables for any violation of the assumptions underlying the statistical techniques that you will use to address your research questions; and iii. To address specific research questions. Tools  Frequencies  Descriptives  Explore  Cross tabulation  Ratio Frequencies Descriptive Statistics Frequencies (mostly for categorical variables)  Analyze, then click on  Descriptive Statistics,  Frequencies.  Select the categorical variables you are interested in (e.g. sex) and move them into the Variables box.  Click on the Statistics button. In the Dispersion section tick minimum and maximum.  Click on Continue and then OK. Descriptive (mostly for continuous variables) Analyze, then click on  Descriptive Statistics,  Descriptives.  Select all the continuous variables that you wish to obtain descriptive statistics  Click on the arrow button to move them into the Variables box (e.g. age).  Click on the Options button.  Click on mean, standard deviation, minimum, maximum,  Click on Continue, and then OK
  • 5. Yacar-Yacara Consults – 2015 +2330501377013 Explore It gives a detailed descriptive analysis of the variables. It presents a number of information about the variables. It provides results for:  Mean  Median  Variance  Percentile  Kurtosis  Skewness  Etc.. Analyze, then click on  Descriptive Statistics,  Explore  Select all the variables that you wish to explore  Click on the arrow button to move them into the Variables box (e.g. age).  Click on the Options button.  Click on all the descriptive tools you want to explore ,  Click on Continue, and then OK Cross Tabulation Cross tabulation is used to find the relationship between categorical variables. It gives a descriptive presentation of the relationship between variables.  Analyze, then click on  Descriptive Statistics,  Cross tabs.  Select the categorical variables you are interested in (e.g. sex) and move them into the Variables boxes.  Click on the Statistics button. In the Dispersion section tick Minimum and Maximum.  Click on Continue and then OK.
  • 6. Yacar-Yacara Consults – 2015 +2330501377013 Kofi Kyeremateng Nyanteng YACAR-YACARA CONSULTS +233243637096 +233501377013