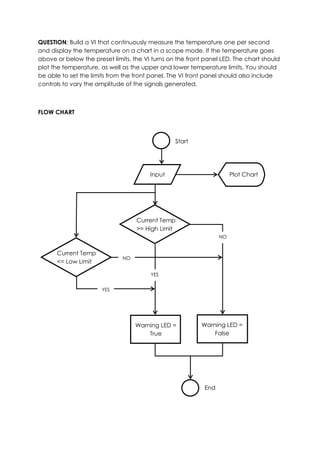
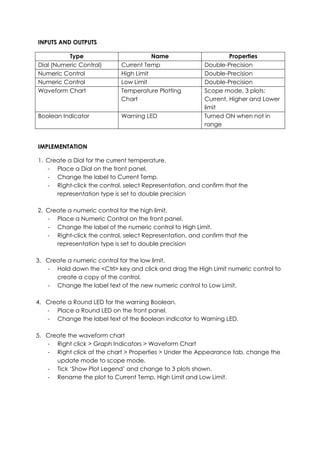
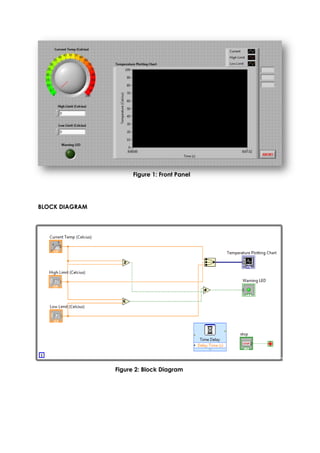
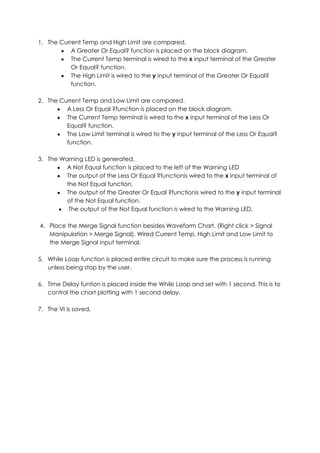

This document describes an active learning report for a LabVIEW VI that measures and plots temperature. The VI continuously measures temperature every second, plots it on a chart along with upper and lower limits. If the temperature is outside the limits, a warning LED turns on. The user can set the limits and temperature amplitude from the front panel. The VI includes controls for temperature, limits, a warning LED, and a chart to plot temperature over time. Block diagrams show comparisons to the limits, merging the signals for the chart, and a time delay in a loop to measure every second.