SlideShare a Scribd company logo
Tutorial exercises
                  Clustering – K-means, Nearest Neighbor and Hierarchical.

Exercise 1. K-means clustering

Use the k-means algorithm and Euclidean distance to cluster the following 8 examples into 3 clusters:
A1=(2,10), A2=(2,5), A3=(8,4), A4=(5,8), A5=(7,5), A6=(6,4), A7=(1,2), A8=(4,9).
The distance matrix based on the Euclidean distance is given below:

             A1    A2       A3       A4        A5       A6       A7       A8
       A1    0         25       36        13       50       52       65       5
       A2          0            37        18       25       17       10       20
       A3                   0             25       2        2        53       41
       A4                             0            13       17       52       2
       A5                                      0            2        45       25
       A6                                               0            29       29
       A7                                                        0            58
       A8                                                                 0

Suppose that the initial seeds (centers of each cluster) are A1, A4 and A7. Run the k-means algorithm for
1 epoch only. At the end of this epoch show:
a) The new clusters (i.e. the examples belonging to each cluster)
b) The centers of the new clusters
c) Draw a 10 by 10 space with all the 8 points and show the clusters after the first epoch and the new
centroids.
d) How many more iterations are needed to converge? Draw the result for each epoch.

Solution:
a)
d(a,b) denotes the Eucledian distance between a and b. It is obtained directly from the distance matrix or
calculated as follows: d(a,b)=sqrt((xb-xa)2+(yb-ya)2))
seed1=A1=(2,10), seed2=A4=(5,8), seed3=A7=(1,2)

epoch1 – start:

 A1:                                                                 A2:
 d(A1, seed1)=0 as A1 is seed1                                       d(A2,seed1)=   25 = 5
 d(A1, seed2)= 13 >0                                                 d(A2, seed2)= 18 = 4.24
 d(A1, seed3)= 65 >0                                                 d(A2, seed3)= 10 = 3.16         smaller
   A1 ∈ cluster1                                                        A2 ∈ cluster3

 A3:                                                                 A4:
 d(A3, seed1)=   36 = 6                                              d(A4, seed1)= 13
 d(A3, seed2)= 25 = 5                smaller                         d(A4, seed2)=0 as A4 is seed2
 d(A3, seed3)= 53 = 7.28                                             d(A4, seed3)= 52 >0
    A3 ∈ cluster2                                                       A4 ∈ cluster2

 A5:                                                                 A6:
 d(A5, seed1)=     50 = 7.07                                         d(A6, seed1)=   52 = 7.21
d(A5, seed2)= 13 = 3.60                        smaller               d(A6, seed2)= 17 = 4.12                          smaller
 d(A5, seed3)= 45 = 6.70                                              d(A6, seed3)= 29 = 5.38
    A5 ∈ cluster2                                                        A6 ∈ cluster2


 A7:                                                                  A8:
 d(A7, seed1)= 65 >0                                                  d(A8, seed1)= 5
 d(A7, seed2)= 52 >0                                                  d(A8, seed2)= 2                    smaller
 d(A7, seed3)=0 as A7 is seed3                                        d(A8, seed3)= 58
    A7 ∈ cluster3                                                        A8 ∈ cluster2
end of epoch1

new clusters: 1: {A1}, 2: {A3, A4, A5, A6, A8}, 3: {A2, A7}

b) centers of the new clusters:
C1= (2, 10), C2= ((8+5+7+6+4)/5, (4+8+5+4+9)/5) = (6, 6), C3= ((2+1)/2, (5+2)/2) = (1.5, 3.5)

c)
                      A                                                                     A1
 10                   1                                               10
                                  A8                                                                    A8
     9                                                                 9
                                       A                                                                     A4
     8                                 4                               8
     7                                                                 7
     6                                                                 6
                      A2                            A5                                      A                              A5
     5                                                                 5                    2
                                               A6        A3                                                           A6        A3
     4                                                                 4
     3                                                                 3
                 A7                                                                A7
     2                                                                2
     1                                                                 1
     0                                                                0
         0   1    2       3   4    5       6    7    8       9   10        0   1       2        3   4    5    6        7    8    9   10

                      A1                                                                    A1
 10                                                                   10                x
                                  A8                                                                    A8
     9                                                                 9
                                       A4                                                                    A4
     8                                                                 8
     7                                                                 7
     6                                                                 6                                          x
                      A                             A5                                      A2                             A5
     5                2                                                5
                                               A6        A                                                            A6        A3
     4                                                   3             4
                                                                                   x
     3                                                                 3
                 A7                                                                A7
     2                                                                 2
     1                                                                 1
     0                                                                0
         0   1    2       3   4    5       6    7    8       9   10        0   1       2        3   4    5    6        7    8    9   10
d)
We would need two more epochs. After the 2nd epoch the results would be:
1: {A1, A8}, 2: {A3, A4, A5, A6}, 3: {A2, A7}
with centers C1=(3, 9.5), C2=(6.5, 5.25) and C3=(1.5, 3.5).
After the 3rd epoch, the results would be:
1: {A1, A4, A8}, 2: {A3, A5, A6}, 3: {A2, A7}
with centers C1=(3.66, 9), C2=(7, 4.33) and C3=(1.5, 3.5).

                      A1                                                                      A1
 10                                                                      10
                           x       A8                                                                          A8
  9                                                                       9                            x
                                            A4                                                                          A4
  8                                                                       8

  7                                                                       7
  6                                                                       6
                      A2                         x        A5                                  A2                                    A5
  5                                                                       5
                                                 A6            A3                                                            A6 x        A3
  4                                                                       4
              x                                                                       x
  3                                                                       3
              A7                                                                      A7
  2                                                                       2

  1                                                                       1

  0                                                                      0
      0   1       2        3   4        5    6        7    8    9   10        0   1       2        3       4        5    6     7     8    9   10


Exercise 2. Nearest Neighbor clustering

Use the Nearest Neighbor clustering algorithm and Euclidean distance to cluster the examples from the
previous exercise: A1=(2,10), A2=(2,5), A3=(8,4), A4=(5,8), A5=(7,5), A6=(6,4), A7=(1,2), A8=(4,9).
Suppose that the threshold t is 4.

Solution:
A1 is placed in a cluster by itself, so we have K1={A1}.

We then look at A2 if it should be added to K1 or be placed in a new cluster.
d(A1,A2)= 25 = 5 > t       K2={A2}

A3: we compare the distances from A3 to A1 and A2.
A3 is closer to A2 and d(A3,A2)= 36 > t   K3={A3}

A4: We compare the distances from A4 to A1, A2 and A3.
A1 is the closest object and d(A4,A1)= 13 < t  K1={A1, A4}

A5: We compare the distances from A5 to A1, A2, A3 and A4.
A3 is the closest object and d(A5,A3)= 2 < t K3={A3, A5}

A6: We compare the distances from A6 to A1, A2, A3, A4 and A5.
A3 is the closest object and d(A6,A3)= 2 < t K3={A3, A5, A6}

A7: We compare the distances from A7 to A1, A2, A3, A4, A5, and A6.
A2 is the closest object and d(A7,A2)= 10 < t K2={A2, A7)
A8: We compare the distances from A8 to A1, A2, A3, A4, A5, A6 and A7.
A4 is the closest object and d(A8,A4)= 2 < t K1={A1, A4, A8)

Thus: K1={A1, A4, A8), K2={A2, A7), K3={A3, A5, A6)

Yes, it is the same result as with K-means.
                       A1
 10
                                        A8
  9
                                                 A4
  8                                 K1

  7
  6
                       A2                                      A5
  5
                  K2                                  A6            A3
  4
                                                       K3
  3
                  A7
  2

  1

  0
      0       1    2        3       4        5    6        7    8    9   10


Exercise 3. Hierarchical clustering

Use single and complete link agglomerative clustering to group the data described by the following
distance matrix. Show the dendrograms.

                   A            B            C        D
          A        0            1            4        5
          B                     0            2        6
          C                                  0        3
          D                                           0

Solution:
Agglomerative      initially every point is a cluster of its own and we merge cluster until we end-up with
one unique cluster containing all points.

a) single link: distance between two clusters is the shortest distance between a pair of elements from the
two clusters.
  d      k K                        Comments
  0      4 {A}, {B}, {C}, {D} We start with each point = cluster
  1      3 {A, B}, {C}, {D}         Merge {A} and {B} since A & B are the
                                                                                   A B C D 0
                                    closest: d(A, B)=1                                                  1
                                                                                                        2
  2      2 {A, B, C}, {D}           Merge {A, B} and {C} since B & C are                                3
                                    the closest: d(B, C)=2
  3      1 {A, B, C, D}             Merge D


b) complete link: distance between two clusters is the longest distance between a pair of elements from
the two clusters.
  d k K                          Comments
  0 4 {A}, {B}, {C}, {D}         We start with each point = cluster              A B C D           0
                                                                                                   1
  1 3 {A, B}, {C}, {D}           d(A,B)=1<=1      merge {A} and {B}                                2
  2 3 {A, B}, {C}, {D}           d(A,C)=4>2 so we can’t merge C with                               3
                                                                                                   4
                                 {A,B}                                                             5
                                                                                                   6
                                  d(A,D)=5>2 and d(B,D)=6>2 so we can’t
                                 merge D with {A, B}
                                 d(C,D)=3>2 so we can’t merge C and D
  3   2   {A, B}, {C, D}         - d(A,C)=4>3 so we can’t merge C with
                                 {A,B}
                                 - d(A,D)=5>3 and d(B,D)=6>3 so we can’t
                                 merge D with {A, B}
                                 - d(C,D)=3 <=3 so merge C and D
  4   2   {A, B}, {C, D}         {C,D} cannot be merged with {A, B} as
                                 d(A,D)= 5 >4 (and also d(B,D)= 6 >4)
                                 although d(A,C)= 4 <= 4, d(B,C)= 2<=4)

  5   2   {A, B}, {C, D}         {C,D} cannot be merged with {A, B} as
                                 d(B,D)= 6 > 5
  6   1   {A, B, C, D}           {C, D} can be merged with {A, B} since
                                 d(B,D)= 6 <= 6, d(A,D)= 5 <= 6, d(A,C)=
                                 4 <= 6, d(B,C)= 2 <= 6


Exercise 4: Hierarchical clustering (to be done at your own time, not in class)
Use single-link, complete-link, average-link agglomerative clustering as well as medoid and centroid to
cluster the following 8 examples:
A1=(2,10), A2=(2,5), A3=(8,4), A4=(5,8), A5=(7,5), A6=(6,4), A7=(1,2), A8=(4,9).
The distance matrix is the same as the one in Exercise 1. Show the dendrograms.
Solution:
Single Link:
  d k K                                                                A4 A8 A1 A3 A5 A6 A2 A7      0
  0 8 {A1}, {A2}, {A3}, {A4}, {A5}, {A6}, {A7}, {A8}                                                1
                                                                                                    2
  1 8 {A1}, {A2}, {A3}, {A4}, {A5}, {A6}, {A7}, {A8}                                                3
                                                                                                    4
  2 5 {A4, A8}, {A1}, {A3, A5, A6}, {A2}, {A7}                                                      5
  3 4 {A4, A8, A1}, {A3, A5, A6}, {A2}, {A7}
  4 2 {A1, A3, A4, A5, A6, A8}, {A2, A7}
  5 1 {A1, A3, A4, A5, A6, A8, A2, A7}

Complete Link
 d k K                                                               A4 A8 A1 A3 A5 A6 A2 A7       0
 0 8 {A1}, {A2}, {A3}, {A4}, {A5}, {A6}, {A7}, {A8}                                                1
                                                                                                   2
 1 8 {A1}, {A2}, {A3}, {A4}, {A5}, {A6}, {A7}, {A8}                                                3
                                                                                                   4
 2 5 {A4, A8}, {A1}, {A3, A5, A6}, {A2}, {A7}                                                      5
                                                                                                   6
 3 5 {A4, A8}, {A1}, {A3, A5, A6}, {A2}, {A7}                                                      7
                                                                                                   8
 4 3 {A4, A8, A1}, {A3, A5, A6}, {A2, A7}
 5 3 {A4, A8, A1}, {A3, A5, A6}, {A2, A7}
 6 2 {A4, A8, A1, A3, A5, A6}, {A2, A7}
 7 2 {A4, A8, A1, A3, A5, A6}, {A2, A7}
 8 1 {A4, A8, A1, A3, A5, A6, A2, A7}
Average Link
 d k K                                                              A4 A8 A1 A3 A5 A6 A2 A7         0
 0 8 {A1}, {A2}, {A3}, {A4}, {A5}, {A6}, {A7}, {A8}                                                 1
                                                                                                    2
 1 8 {A1}, {A2}, {A3}, {A4}, {A5}, {A6}, {A7}, {A8}                                                 3
                                                                                                    4
 2 5 {A4, A8}, {A1}, {A3, A5, A6}, {A2}, {A7}                                                       5
                                                                                                    6
 3 4 {A4, A8, A1}, {A3, A5, A6}, {A2}, {A7}
 4 3 {A4, A8, A1}, {A3, A5, A6}, {A2, A7}
 5 3 {A4, A8, A1}, {A3, A5, A6}, {A2, A7}
 6 1 {A4, A8, A1, A3, A5, A6, A2, A7}
Average distance from {A3, A5, A6} to {A1, A4, A8} is 5.53 and is 5.75 to {A2, A7}

Centroid
  D k K                                                              A4 A8 A1 A3 A5 A6 A2 A7        0
  0 8 {A1}, {A2}, {A3}, {A4}, {A5}, {A6}, {A7}, {A8}                                                1
                                                                                                    2
  1 8 {A1}, {A2}, {A3}, {A4}, {A5}, {A6}, {A7}, {A8}                                                3
                                                                                                    4
  2 5 {A4, A8}, {A1}, {A3, A5, A6}, {A2}, {A7}                                                      5
                                                                                                    6
  3 5 {A4, A8}, {A1}, {A3, A5, A6}, {A2}, {A7}
  4 3 {A4, A8, A1}, {A3, A5, A6}, {A2, A7}
  5 3 {A4, A8, A1}, {A3, A5, A6}, {A2, A7}
  6 1 {A4, A8, A1, A3, A5, A6, A2, A7}
Centroid of {A4, A8} is B=(4.5, 8.5) and centroid of {A3, A5, A6} is C=(7, 4.33)
distance(A1, B) = 2.91 Centroid of {A1, A4, A8} is D=(3.66, 9) and of {A2, A7} is E=(1.5, 3.5)
distance(D,C)= 5.74 distance(D,E)= 5.90

Medoid
This is not deterministic. It can be different depending upon which medoid in a cluster we chose.
  d k K                                                                A4 A8 A1 A3 A5 A6 A2 A7      0
  0 8 {A1}, {A2}, {A3}, {A4}, {A5}, {A6}, {A7}, {A8}                                                1
                                                                                                    2
  1 8 {A1}, {A2}, {A3}, {A4}, {A5}, {A6}, {A7}, {A8}                                                3
                                                                                                    4
  2 5 {A4, A8}, {A1}, {A3, A5, A6}, {A2}, {A7}                                                      5
  3 4 {A4, A8, A1}, {A3, A5, A6}, {A2}, {A7}
  4 2 {A1, A3, A4, A5, A6, A8}, {A2, A7}
  5 1 {A1, A3, A4, A5, A6, A8, A2, A7}

Exercise 5: DBScan
If Epsilon is 2 and minpoint is 2, what are the clusters that DBScan would discover with the following 8
examples: A1=(2,10), A2=(2,5), A3=(8,4), A4=(5,8), A5=(7,5), A6=(6,4), A7=(1,2), A8=(4,9).
The distance matrix is the same as the one in Exercise 1. Draw the 10 by 10 space and illustrate the
discovered clusters. What if Epsilon is increased to 10 ?

Solution:
What is the Epsilon neighborhood of each point?
N2(A1)={}; N2(A2)={}; N2(A3)={A5, A6}; N2(A4)={A8}; N2(A5)={A3, A6};
N2(A6)={A3, A5}; N2(A7)={}; N2(A8)={A4}

So A1, A2, and A7 are outliers, while we have two clusters C1={A4, A8} and C2={A3, A5, A6}

If Epsilon is 10 then the neighborhood of some points will increase:
A1 would join the cluster C1 and A2 would joint with A7 to form cluster C3={A2, A7}.
A1                                                                  A1
10                                                                  10
                               A8                                                                  A8
 9                                                                   9
                                        A4                                                                  A4
 8                                                                   8
 7                                                                   7
 6                                                                   6
                  A2                                  A5                              A2                                  A5
 5                                                                   5
                                             A6            A3                                                    A6            A3
 4                                                                   4
 3                                                                   3
             A7                                                                  A7
2                                                                    2
 1                                                                   1
0                                                                   0
     0   1    2        3   4        5    6        7    8    9   1        0   1    2        3   4        5    6        7    8    9   1
         Epsilon = 2                                                         Epsilon = 10

More Related Content

What's hot

Multi dimensional model vs (1)
Multi dimensional model vs (1)Multi dimensional model vs (1)
Multi dimensional model vs (1)
JamesDempsey1
 
SLIQ
SLIQSLIQ
Hierarchical clustering
Hierarchical clusteringHierarchical clustering
Hierarchical clustering
ishmecse13
 
Confusion Matrix Explained
Confusion Matrix ExplainedConfusion Matrix Explained
Confusion Matrix Explained
Stockholm University
 
Feature Engineering
Feature EngineeringFeature Engineering
Feature Engineering
HJ van Veen
 
ML Application Life Cycle
ML Application Life CycleML Application Life Cycle
ML Application Life Cycle
SrujanaMerugu1
 
Chapter - 6 Data Mining Concepts and Techniques 2nd Ed slides Han & Kamber
Chapter - 6 Data Mining Concepts and Techniques 2nd Ed slides Han & KamberChapter - 6 Data Mining Concepts and Techniques 2nd Ed slides Han & Kamber
Chapter - 6 Data Mining Concepts and Techniques 2nd Ed slides Han & Kamber
error007
 
Classification in data mining
Classification in data mining Classification in data mining
Classification in data mining
Sulman Ahmed
 
Deep Generative Models
Deep Generative Models Deep Generative Models
Deep Generative Models
Chia-Wen Cheng
 
01 Data Mining: Concepts and Techniques, 2nd ed.
01 Data Mining: Concepts and Techniques, 2nd ed.01 Data Mining: Concepts and Techniques, 2nd ed.
01 Data Mining: Concepts and Techniques, 2nd ed.
Institute of Technology Telkom
 
Mean shift and Hierarchical clustering
Mean shift and Hierarchical clustering Mean shift and Hierarchical clustering
Mean shift and Hierarchical clustering
Yan Xu
 
Ensemble Learning.pptx
Ensemble Learning.pptxEnsemble Learning.pptx
Ensemble Learning.pptx
piyushkumar222909
 
Data mining (lecture 1 & 2) conecpts and techniques
Data mining (lecture 1 & 2) conecpts and techniquesData mining (lecture 1 & 2) conecpts and techniques
Data mining (lecture 1 & 2) conecpts and techniquesSaif Ullah
 
Web log & clickstream
Web log & clickstream Web log & clickstream
Web log & clickstream
Michel Bruley
 
A Brief Introduction on Recurrent Neural Network and Its Application
A Brief Introduction on Recurrent Neural Network and Its ApplicationA Brief Introduction on Recurrent Neural Network and Its Application
A Brief Introduction on Recurrent Neural Network and Its Application
Xiaohu ZHU
 
A Style-Based Generator Architecture for Generative Adversarial Networks
A Style-Based Generator Architecture for Generative Adversarial NetworksA Style-Based Generator Architecture for Generative Adversarial Networks
A Style-Based Generator Architecture for Generative Adversarial Networks
ivaderivader
 
Data mining :Concepts and Techniques Chapter 2, data
Data mining :Concepts and Techniques Chapter 2, dataData mining :Concepts and Techniques Chapter 2, data
Data mining :Concepts and Techniques Chapter 2, data
Salah Amean
 
Exploratory data analysis project
Exploratory data analysis project Exploratory data analysis project
Exploratory data analysis project
BabatundeSogunro
 

What's hot (20)

Multi dimensional model vs (1)
Multi dimensional model vs (1)Multi dimensional model vs (1)
Multi dimensional model vs (1)
 
SLIQ
SLIQSLIQ
SLIQ
 
Hierarchical clustering
Hierarchical clusteringHierarchical clustering
Hierarchical clustering
 
Confusion Matrix Explained
Confusion Matrix ExplainedConfusion Matrix Explained
Confusion Matrix Explained
 
Feature Engineering
Feature EngineeringFeature Engineering
Feature Engineering
 
ML Application Life Cycle
ML Application Life CycleML Application Life Cycle
ML Application Life Cycle
 
Data Mining
Data MiningData Mining
Data Mining
 
Chapter - 6 Data Mining Concepts and Techniques 2nd Ed slides Han & Kamber
Chapter - 6 Data Mining Concepts and Techniques 2nd Ed slides Han & KamberChapter - 6 Data Mining Concepts and Techniques 2nd Ed slides Han & Kamber
Chapter - 6 Data Mining Concepts and Techniques 2nd Ed slides Han & Kamber
 
Classification in data mining
Classification in data mining Classification in data mining
Classification in data mining
 
Deep Generative Models
Deep Generative Models Deep Generative Models
Deep Generative Models
 
01 Data Mining: Concepts and Techniques, 2nd ed.
01 Data Mining: Concepts and Techniques, 2nd ed.01 Data Mining: Concepts and Techniques, 2nd ed.
01 Data Mining: Concepts and Techniques, 2nd ed.
 
Mean shift and Hierarchical clustering
Mean shift and Hierarchical clustering Mean shift and Hierarchical clustering
Mean shift and Hierarchical clustering
 
Ensemble Learning.pptx
Ensemble Learning.pptxEnsemble Learning.pptx
Ensemble Learning.pptx
 
Data mining (lecture 1 & 2) conecpts and techniques
Data mining (lecture 1 & 2) conecpts and techniquesData mining (lecture 1 & 2) conecpts and techniques
Data mining (lecture 1 & 2) conecpts and techniques
 
Web log & clickstream
Web log & clickstream Web log & clickstream
Web log & clickstream
 
A Brief Introduction on Recurrent Neural Network and Its Application
A Brief Introduction on Recurrent Neural Network and Its ApplicationA Brief Introduction on Recurrent Neural Network and Its Application
A Brief Introduction on Recurrent Neural Network and Its Application
 
Classification metrics
Classification metrics Classification metrics
Classification metrics
 
A Style-Based Generator Architecture for Generative Adversarial Networks
A Style-Based Generator Architecture for Generative Adversarial NetworksA Style-Based Generator Architecture for Generative Adversarial Networks
A Style-Based Generator Architecture for Generative Adversarial Networks
 
Data mining :Concepts and Techniques Chapter 2, data
Data mining :Concepts and Techniques Chapter 2, dataData mining :Concepts and Techniques Chapter 2, data
Data mining :Concepts and Techniques Chapter 2, data
 
Exploratory data analysis project
Exploratory data analysis project Exploratory data analysis project
Exploratory data analysis project
 

More from jonecx

Latex tutorial
Latex tutorialLatex tutorial
Latex tutorial
jonecx
 
tdt4260
tdt4260tdt4260
tdt4260jonecx
 
Tdt4242
Tdt4242Tdt4242
Tdt4242jonecx
 
SDL 2000 Tutorial
SDL 2000 TutorialSDL 2000 Tutorial
SDL 2000 Tutorialjonecx
 
Owl syntax
Owl syntaxOwl syntax
Owl syntaxjonecx
 
Duplicate detection
Duplicate detectionDuplicate detection
Duplicate detectionjonecx
 
Process Algebra
Process AlgebraProcess Algebra
Process Algebrajonecx
 
Hickman threat modeling
Hickman threat modelingHickman threat modeling
Hickman threat modelingjonecx
 
NTNU EiT evaluation guideline
NTNU EiT evaluation guidelineNTNU EiT evaluation guideline
NTNU EiT evaluation guidelinejonecx
 
BPMN by Example
BPMN by ExampleBPMN by Example
BPMN by Examplejonecx
 

More from jonecx (11)

Latex tutorial
Latex tutorialLatex tutorial
Latex tutorial
 
BPMN
BPMNBPMN
BPMN
 
tdt4260
tdt4260tdt4260
tdt4260
 
Tdt4242
Tdt4242Tdt4242
Tdt4242
 
SDL 2000 Tutorial
SDL 2000 TutorialSDL 2000 Tutorial
SDL 2000 Tutorial
 
Owl syntax
Owl syntaxOwl syntax
Owl syntax
 
Duplicate detection
Duplicate detectionDuplicate detection
Duplicate detection
 
Process Algebra
Process AlgebraProcess Algebra
Process Algebra
 
Hickman threat modeling
Hickman threat modelingHickman threat modeling
Hickman threat modeling
 
NTNU EiT evaluation guideline
NTNU EiT evaluation guidelineNTNU EiT evaluation guideline
NTNU EiT evaluation guideline
 
BPMN by Example
BPMN by ExampleBPMN by Example
BPMN by Example
 

Recently uploaded

Collocation thường gặp trong đề thi THPT Quốc gia.pdf
Collocation thường gặp trong đề thi THPT Quốc gia.pdfCollocation thường gặp trong đề thi THPT Quốc gia.pdf
Collocation thường gặp trong đề thi THPT Quốc gia.pdf
ngochaavk33a
 
SOCIOLOGY PPT. SOCIAL SECURITY POWER POINT
SOCIOLOGY PPT. SOCIAL SECURITY POWER POINTSOCIOLOGY PPT. SOCIAL SECURITY POWER POINT
SOCIOLOGY PPT. SOCIAL SECURITY POWER POINT
ssuser8d5e2d1
 
CHUYÊN ĐỀ READING ÔN THI HSG THPT HAY.docx
CHUYÊN ĐỀ READING ÔN THI HSG THPT HAY.docxCHUYÊN ĐỀ READING ÔN THI HSG THPT HAY.docx
CHUYÊN ĐỀ READING ÔN THI HSG THPT HAY.docx
ngochaavk33a
 
Program Your Destiny eBook - Destiny University.pdf
Program Your Destiny eBook - Destiny University.pdfProgram Your Destiny eBook - Destiny University.pdf
Program Your Destiny eBook - Destiny University.pdf
Michael Herlache, MBA
 
UNIVERSAL HUMAN VALUES- Harmony in the Nature
UNIVERSAL HUMAN VALUES- Harmony in the NatureUNIVERSAL HUMAN VALUES- Harmony in the Nature
UNIVERSAL HUMAN VALUES- Harmony in the Nature
Chandrakant Divate
 
Ethical_dilemmas_MDI_Gurgaon-Business Ethics Case 1.pptx
Ethical_dilemmas_MDI_Gurgaon-Business Ethics Case 1.pptxEthical_dilemmas_MDI_Gurgaon-Business Ethics Case 1.pptx
Ethical_dilemmas_MDI_Gurgaon-Business Ethics Case 1.pptx
TANMAYJAIN511570
 
ÔN TẬP CỤM THÀNH NGỮ TIẾNG ANH CỰC HAY.docx
ÔN TẬP CỤM THÀNH NGỮ TIẾNG ANH CỰC HAY.docxÔN TẬP CỤM THÀNH NGỮ TIẾNG ANH CỰC HAY.docx
ÔN TẬP CỤM THÀNH NGỮ TIẾNG ANH CỰC HAY.docx
ngochaavk33a
 

Recently uploaded (7)

Collocation thường gặp trong đề thi THPT Quốc gia.pdf
Collocation thường gặp trong đề thi THPT Quốc gia.pdfCollocation thường gặp trong đề thi THPT Quốc gia.pdf
Collocation thường gặp trong đề thi THPT Quốc gia.pdf
 
SOCIOLOGY PPT. SOCIAL SECURITY POWER POINT
SOCIOLOGY PPT. SOCIAL SECURITY POWER POINTSOCIOLOGY PPT. SOCIAL SECURITY POWER POINT
SOCIOLOGY PPT. SOCIAL SECURITY POWER POINT
 
CHUYÊN ĐỀ READING ÔN THI HSG THPT HAY.docx
CHUYÊN ĐỀ READING ÔN THI HSG THPT HAY.docxCHUYÊN ĐỀ READING ÔN THI HSG THPT HAY.docx
CHUYÊN ĐỀ READING ÔN THI HSG THPT HAY.docx
 
Program Your Destiny eBook - Destiny University.pdf
Program Your Destiny eBook - Destiny University.pdfProgram Your Destiny eBook - Destiny University.pdf
Program Your Destiny eBook - Destiny University.pdf
 
UNIVERSAL HUMAN VALUES- Harmony in the Nature
UNIVERSAL HUMAN VALUES- Harmony in the NatureUNIVERSAL HUMAN VALUES- Harmony in the Nature
UNIVERSAL HUMAN VALUES- Harmony in the Nature
 
Ethical_dilemmas_MDI_Gurgaon-Business Ethics Case 1.pptx
Ethical_dilemmas_MDI_Gurgaon-Business Ethics Case 1.pptxEthical_dilemmas_MDI_Gurgaon-Business Ethics Case 1.pptx
Ethical_dilemmas_MDI_Gurgaon-Business Ethics Case 1.pptx
 
ÔN TẬP CỤM THÀNH NGỮ TIẾNG ANH CỰC HAY.docx
ÔN TẬP CỤM THÀNH NGỮ TIẾNG ANH CỰC HAY.docxÔN TẬP CỤM THÀNH NGỮ TIẾNG ANH CỰC HAY.docx
ÔN TẬP CỤM THÀNH NGỮ TIẾNG ANH CỰC HAY.docx
 

K-means clustering exercise based on eucalidean distance

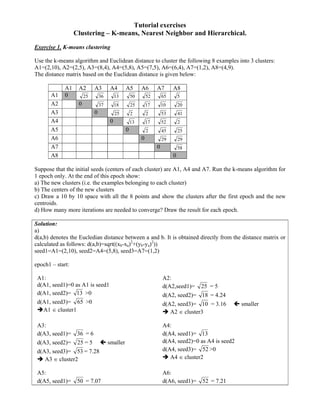
  • 1. Tutorial exercises Clustering – K-means, Nearest Neighbor and Hierarchical. Exercise 1. K-means clustering Use the k-means algorithm and Euclidean distance to cluster the following 8 examples into 3 clusters: A1=(2,10), A2=(2,5), A3=(8,4), A4=(5,8), A5=(7,5), A6=(6,4), A7=(1,2), A8=(4,9). The distance matrix based on the Euclidean distance is given below: A1 A2 A3 A4 A5 A6 A7 A8 A1 0 25 36 13 50 52 65 5 A2 0 37 18 25 17 10 20 A3 0 25 2 2 53 41 A4 0 13 17 52 2 A5 0 2 45 25 A6 0 29 29 A7 0 58 A8 0 Suppose that the initial seeds (centers of each cluster) are A1, A4 and A7. Run the k-means algorithm for 1 epoch only. At the end of this epoch show: a) The new clusters (i.e. the examples belonging to each cluster) b) The centers of the new clusters c) Draw a 10 by 10 space with all the 8 points and show the clusters after the first epoch and the new centroids. d) How many more iterations are needed to converge? Draw the result for each epoch. Solution: a) d(a,b) denotes the Eucledian distance between a and b. It is obtained directly from the distance matrix or calculated as follows: d(a,b)=sqrt((xb-xa)2+(yb-ya)2)) seed1=A1=(2,10), seed2=A4=(5,8), seed3=A7=(1,2) epoch1 – start: A1: A2: d(A1, seed1)=0 as A1 is seed1 d(A2,seed1)= 25 = 5 d(A1, seed2)= 13 >0 d(A2, seed2)= 18 = 4.24 d(A1, seed3)= 65 >0 d(A2, seed3)= 10 = 3.16 smaller A1 ∈ cluster1 A2 ∈ cluster3 A3: A4: d(A3, seed1)= 36 = 6 d(A4, seed1)= 13 d(A3, seed2)= 25 = 5 smaller d(A4, seed2)=0 as A4 is seed2 d(A3, seed3)= 53 = 7.28 d(A4, seed3)= 52 >0 A3 ∈ cluster2 A4 ∈ cluster2 A5: A6: d(A5, seed1)= 50 = 7.07 d(A6, seed1)= 52 = 7.21
  • 2. d(A5, seed2)= 13 = 3.60 smaller d(A6, seed2)= 17 = 4.12 smaller d(A5, seed3)= 45 = 6.70 d(A6, seed3)= 29 = 5.38 A5 ∈ cluster2 A6 ∈ cluster2 A7: A8: d(A7, seed1)= 65 >0 d(A8, seed1)= 5 d(A7, seed2)= 52 >0 d(A8, seed2)= 2 smaller d(A7, seed3)=0 as A7 is seed3 d(A8, seed3)= 58 A7 ∈ cluster3 A8 ∈ cluster2 end of epoch1 new clusters: 1: {A1}, 2: {A3, A4, A5, A6, A8}, 3: {A2, A7} b) centers of the new clusters: C1= (2, 10), C2= ((8+5+7+6+4)/5, (4+8+5+4+9)/5) = (6, 6), C3= ((2+1)/2, (5+2)/2) = (1.5, 3.5) c) A A1 10 1 10 A8 A8 9 9 A A4 8 4 8 7 7 6 6 A2 A5 A A5 5 5 2 A6 A3 A6 A3 4 4 3 3 A7 A7 2 2 1 1 0 0 0 1 2 3 4 5 6 7 8 9 10 0 1 2 3 4 5 6 7 8 9 10 A1 A1 10 10 x A8 A8 9 9 A4 A4 8 8 7 7 6 6 x A A5 A2 A5 5 2 5 A6 A A6 A3 4 3 4 x 3 3 A7 A7 2 2 1 1 0 0 0 1 2 3 4 5 6 7 8 9 10 0 1 2 3 4 5 6 7 8 9 10
  • 3. d) We would need two more epochs. After the 2nd epoch the results would be: 1: {A1, A8}, 2: {A3, A4, A5, A6}, 3: {A2, A7} with centers C1=(3, 9.5), C2=(6.5, 5.25) and C3=(1.5, 3.5). After the 3rd epoch, the results would be: 1: {A1, A4, A8}, 2: {A3, A5, A6}, 3: {A2, A7} with centers C1=(3.66, 9), C2=(7, 4.33) and C3=(1.5, 3.5). A1 A1 10 10 x A8 A8 9 9 x A4 A4 8 8 7 7 6 6 A2 x A5 A2 A5 5 5 A6 A3 A6 x A3 4 4 x x 3 3 A7 A7 2 2 1 1 0 0 0 1 2 3 4 5 6 7 8 9 10 0 1 2 3 4 5 6 7 8 9 10 Exercise 2. Nearest Neighbor clustering Use the Nearest Neighbor clustering algorithm and Euclidean distance to cluster the examples from the previous exercise: A1=(2,10), A2=(2,5), A3=(8,4), A4=(5,8), A5=(7,5), A6=(6,4), A7=(1,2), A8=(4,9). Suppose that the threshold t is 4. Solution: A1 is placed in a cluster by itself, so we have K1={A1}. We then look at A2 if it should be added to K1 or be placed in a new cluster. d(A1,A2)= 25 = 5 > t K2={A2} A3: we compare the distances from A3 to A1 and A2. A3 is closer to A2 and d(A3,A2)= 36 > t K3={A3} A4: We compare the distances from A4 to A1, A2 and A3. A1 is the closest object and d(A4,A1)= 13 < t K1={A1, A4} A5: We compare the distances from A5 to A1, A2, A3 and A4. A3 is the closest object and d(A5,A3)= 2 < t K3={A3, A5} A6: We compare the distances from A6 to A1, A2, A3, A4 and A5. A3 is the closest object and d(A6,A3)= 2 < t K3={A3, A5, A6} A7: We compare the distances from A7 to A1, A2, A3, A4, A5, and A6. A2 is the closest object and d(A7,A2)= 10 < t K2={A2, A7)
  • 4. A8: We compare the distances from A8 to A1, A2, A3, A4, A5, A6 and A7. A4 is the closest object and d(A8,A4)= 2 < t K1={A1, A4, A8) Thus: K1={A1, A4, A8), K2={A2, A7), K3={A3, A5, A6) Yes, it is the same result as with K-means. A1 10 A8 9 A4 8 K1 7 6 A2 A5 5 K2 A6 A3 4 K3 3 A7 2 1 0 0 1 2 3 4 5 6 7 8 9 10 Exercise 3. Hierarchical clustering Use single and complete link agglomerative clustering to group the data described by the following distance matrix. Show the dendrograms. A B C D A 0 1 4 5 B 0 2 6 C 0 3 D 0 Solution: Agglomerative initially every point is a cluster of its own and we merge cluster until we end-up with one unique cluster containing all points. a) single link: distance between two clusters is the shortest distance between a pair of elements from the two clusters. d k K Comments 0 4 {A}, {B}, {C}, {D} We start with each point = cluster 1 3 {A, B}, {C}, {D} Merge {A} and {B} since A & B are the A B C D 0 closest: d(A, B)=1 1 2 2 2 {A, B, C}, {D} Merge {A, B} and {C} since B & C are 3 the closest: d(B, C)=2 3 1 {A, B, C, D} Merge D b) complete link: distance between two clusters is the longest distance between a pair of elements from
  • 5. the two clusters. d k K Comments 0 4 {A}, {B}, {C}, {D} We start with each point = cluster A B C D 0 1 1 3 {A, B}, {C}, {D} d(A,B)=1<=1 merge {A} and {B} 2 2 3 {A, B}, {C}, {D} d(A,C)=4>2 so we can’t merge C with 3 4 {A,B} 5 6 d(A,D)=5>2 and d(B,D)=6>2 so we can’t merge D with {A, B} d(C,D)=3>2 so we can’t merge C and D 3 2 {A, B}, {C, D} - d(A,C)=4>3 so we can’t merge C with {A,B} - d(A,D)=5>3 and d(B,D)=6>3 so we can’t merge D with {A, B} - d(C,D)=3 <=3 so merge C and D 4 2 {A, B}, {C, D} {C,D} cannot be merged with {A, B} as d(A,D)= 5 >4 (and also d(B,D)= 6 >4) although d(A,C)= 4 <= 4, d(B,C)= 2<=4) 5 2 {A, B}, {C, D} {C,D} cannot be merged with {A, B} as d(B,D)= 6 > 5 6 1 {A, B, C, D} {C, D} can be merged with {A, B} since d(B,D)= 6 <= 6, d(A,D)= 5 <= 6, d(A,C)= 4 <= 6, d(B,C)= 2 <= 6 Exercise 4: Hierarchical clustering (to be done at your own time, not in class) Use single-link, complete-link, average-link agglomerative clustering as well as medoid and centroid to cluster the following 8 examples: A1=(2,10), A2=(2,5), A3=(8,4), A4=(5,8), A5=(7,5), A6=(6,4), A7=(1,2), A8=(4,9). The distance matrix is the same as the one in Exercise 1. Show the dendrograms. Solution: Single Link: d k K A4 A8 A1 A3 A5 A6 A2 A7 0 0 8 {A1}, {A2}, {A3}, {A4}, {A5}, {A6}, {A7}, {A8} 1 2 1 8 {A1}, {A2}, {A3}, {A4}, {A5}, {A6}, {A7}, {A8} 3 4 2 5 {A4, A8}, {A1}, {A3, A5, A6}, {A2}, {A7} 5 3 4 {A4, A8, A1}, {A3, A5, A6}, {A2}, {A7} 4 2 {A1, A3, A4, A5, A6, A8}, {A2, A7} 5 1 {A1, A3, A4, A5, A6, A8, A2, A7} Complete Link d k K A4 A8 A1 A3 A5 A6 A2 A7 0 0 8 {A1}, {A2}, {A3}, {A4}, {A5}, {A6}, {A7}, {A8} 1 2 1 8 {A1}, {A2}, {A3}, {A4}, {A5}, {A6}, {A7}, {A8} 3 4 2 5 {A4, A8}, {A1}, {A3, A5, A6}, {A2}, {A7} 5 6 3 5 {A4, A8}, {A1}, {A3, A5, A6}, {A2}, {A7} 7 8 4 3 {A4, A8, A1}, {A3, A5, A6}, {A2, A7} 5 3 {A4, A8, A1}, {A3, A5, A6}, {A2, A7} 6 2 {A4, A8, A1, A3, A5, A6}, {A2, A7} 7 2 {A4, A8, A1, A3, A5, A6}, {A2, A7} 8 1 {A4, A8, A1, A3, A5, A6, A2, A7}
  • 6. Average Link d k K A4 A8 A1 A3 A5 A6 A2 A7 0 0 8 {A1}, {A2}, {A3}, {A4}, {A5}, {A6}, {A7}, {A8} 1 2 1 8 {A1}, {A2}, {A3}, {A4}, {A5}, {A6}, {A7}, {A8} 3 4 2 5 {A4, A8}, {A1}, {A3, A5, A6}, {A2}, {A7} 5 6 3 4 {A4, A8, A1}, {A3, A5, A6}, {A2}, {A7} 4 3 {A4, A8, A1}, {A3, A5, A6}, {A2, A7} 5 3 {A4, A8, A1}, {A3, A5, A6}, {A2, A7} 6 1 {A4, A8, A1, A3, A5, A6, A2, A7} Average distance from {A3, A5, A6} to {A1, A4, A8} is 5.53 and is 5.75 to {A2, A7} Centroid D k K A4 A8 A1 A3 A5 A6 A2 A7 0 0 8 {A1}, {A2}, {A3}, {A4}, {A5}, {A6}, {A7}, {A8} 1 2 1 8 {A1}, {A2}, {A3}, {A4}, {A5}, {A6}, {A7}, {A8} 3 4 2 5 {A4, A8}, {A1}, {A3, A5, A6}, {A2}, {A7} 5 6 3 5 {A4, A8}, {A1}, {A3, A5, A6}, {A2}, {A7} 4 3 {A4, A8, A1}, {A3, A5, A6}, {A2, A7} 5 3 {A4, A8, A1}, {A3, A5, A6}, {A2, A7} 6 1 {A4, A8, A1, A3, A5, A6, A2, A7} Centroid of {A4, A8} is B=(4.5, 8.5) and centroid of {A3, A5, A6} is C=(7, 4.33) distance(A1, B) = 2.91 Centroid of {A1, A4, A8} is D=(3.66, 9) and of {A2, A7} is E=(1.5, 3.5) distance(D,C)= 5.74 distance(D,E)= 5.90 Medoid This is not deterministic. It can be different depending upon which medoid in a cluster we chose. d k K A4 A8 A1 A3 A5 A6 A2 A7 0 0 8 {A1}, {A2}, {A3}, {A4}, {A5}, {A6}, {A7}, {A8} 1 2 1 8 {A1}, {A2}, {A3}, {A4}, {A5}, {A6}, {A7}, {A8} 3 4 2 5 {A4, A8}, {A1}, {A3, A5, A6}, {A2}, {A7} 5 3 4 {A4, A8, A1}, {A3, A5, A6}, {A2}, {A7} 4 2 {A1, A3, A4, A5, A6, A8}, {A2, A7} 5 1 {A1, A3, A4, A5, A6, A8, A2, A7} Exercise 5: DBScan If Epsilon is 2 and minpoint is 2, what are the clusters that DBScan would discover with the following 8 examples: A1=(2,10), A2=(2,5), A3=(8,4), A4=(5,8), A5=(7,5), A6=(6,4), A7=(1,2), A8=(4,9). The distance matrix is the same as the one in Exercise 1. Draw the 10 by 10 space and illustrate the discovered clusters. What if Epsilon is increased to 10 ? Solution: What is the Epsilon neighborhood of each point? N2(A1)={}; N2(A2)={}; N2(A3)={A5, A6}; N2(A4)={A8}; N2(A5)={A3, A6}; N2(A6)={A3, A5}; N2(A7)={}; N2(A8)={A4} So A1, A2, and A7 are outliers, while we have two clusters C1={A4, A8} and C2={A3, A5, A6} If Epsilon is 10 then the neighborhood of some points will increase: A1 would join the cluster C1 and A2 would joint with A7 to form cluster C3={A2, A7}.
  • 7. A1 A1 10 10 A8 A8 9 9 A4 A4 8 8 7 7 6 6 A2 A5 A2 A5 5 5 A6 A3 A6 A3 4 4 3 3 A7 A7 2 2 1 1 0 0 0 1 2 3 4 5 6 7 8 9 1 0 1 2 3 4 5 6 7 8 9 1 Epsilon = 2 Epsilon = 10