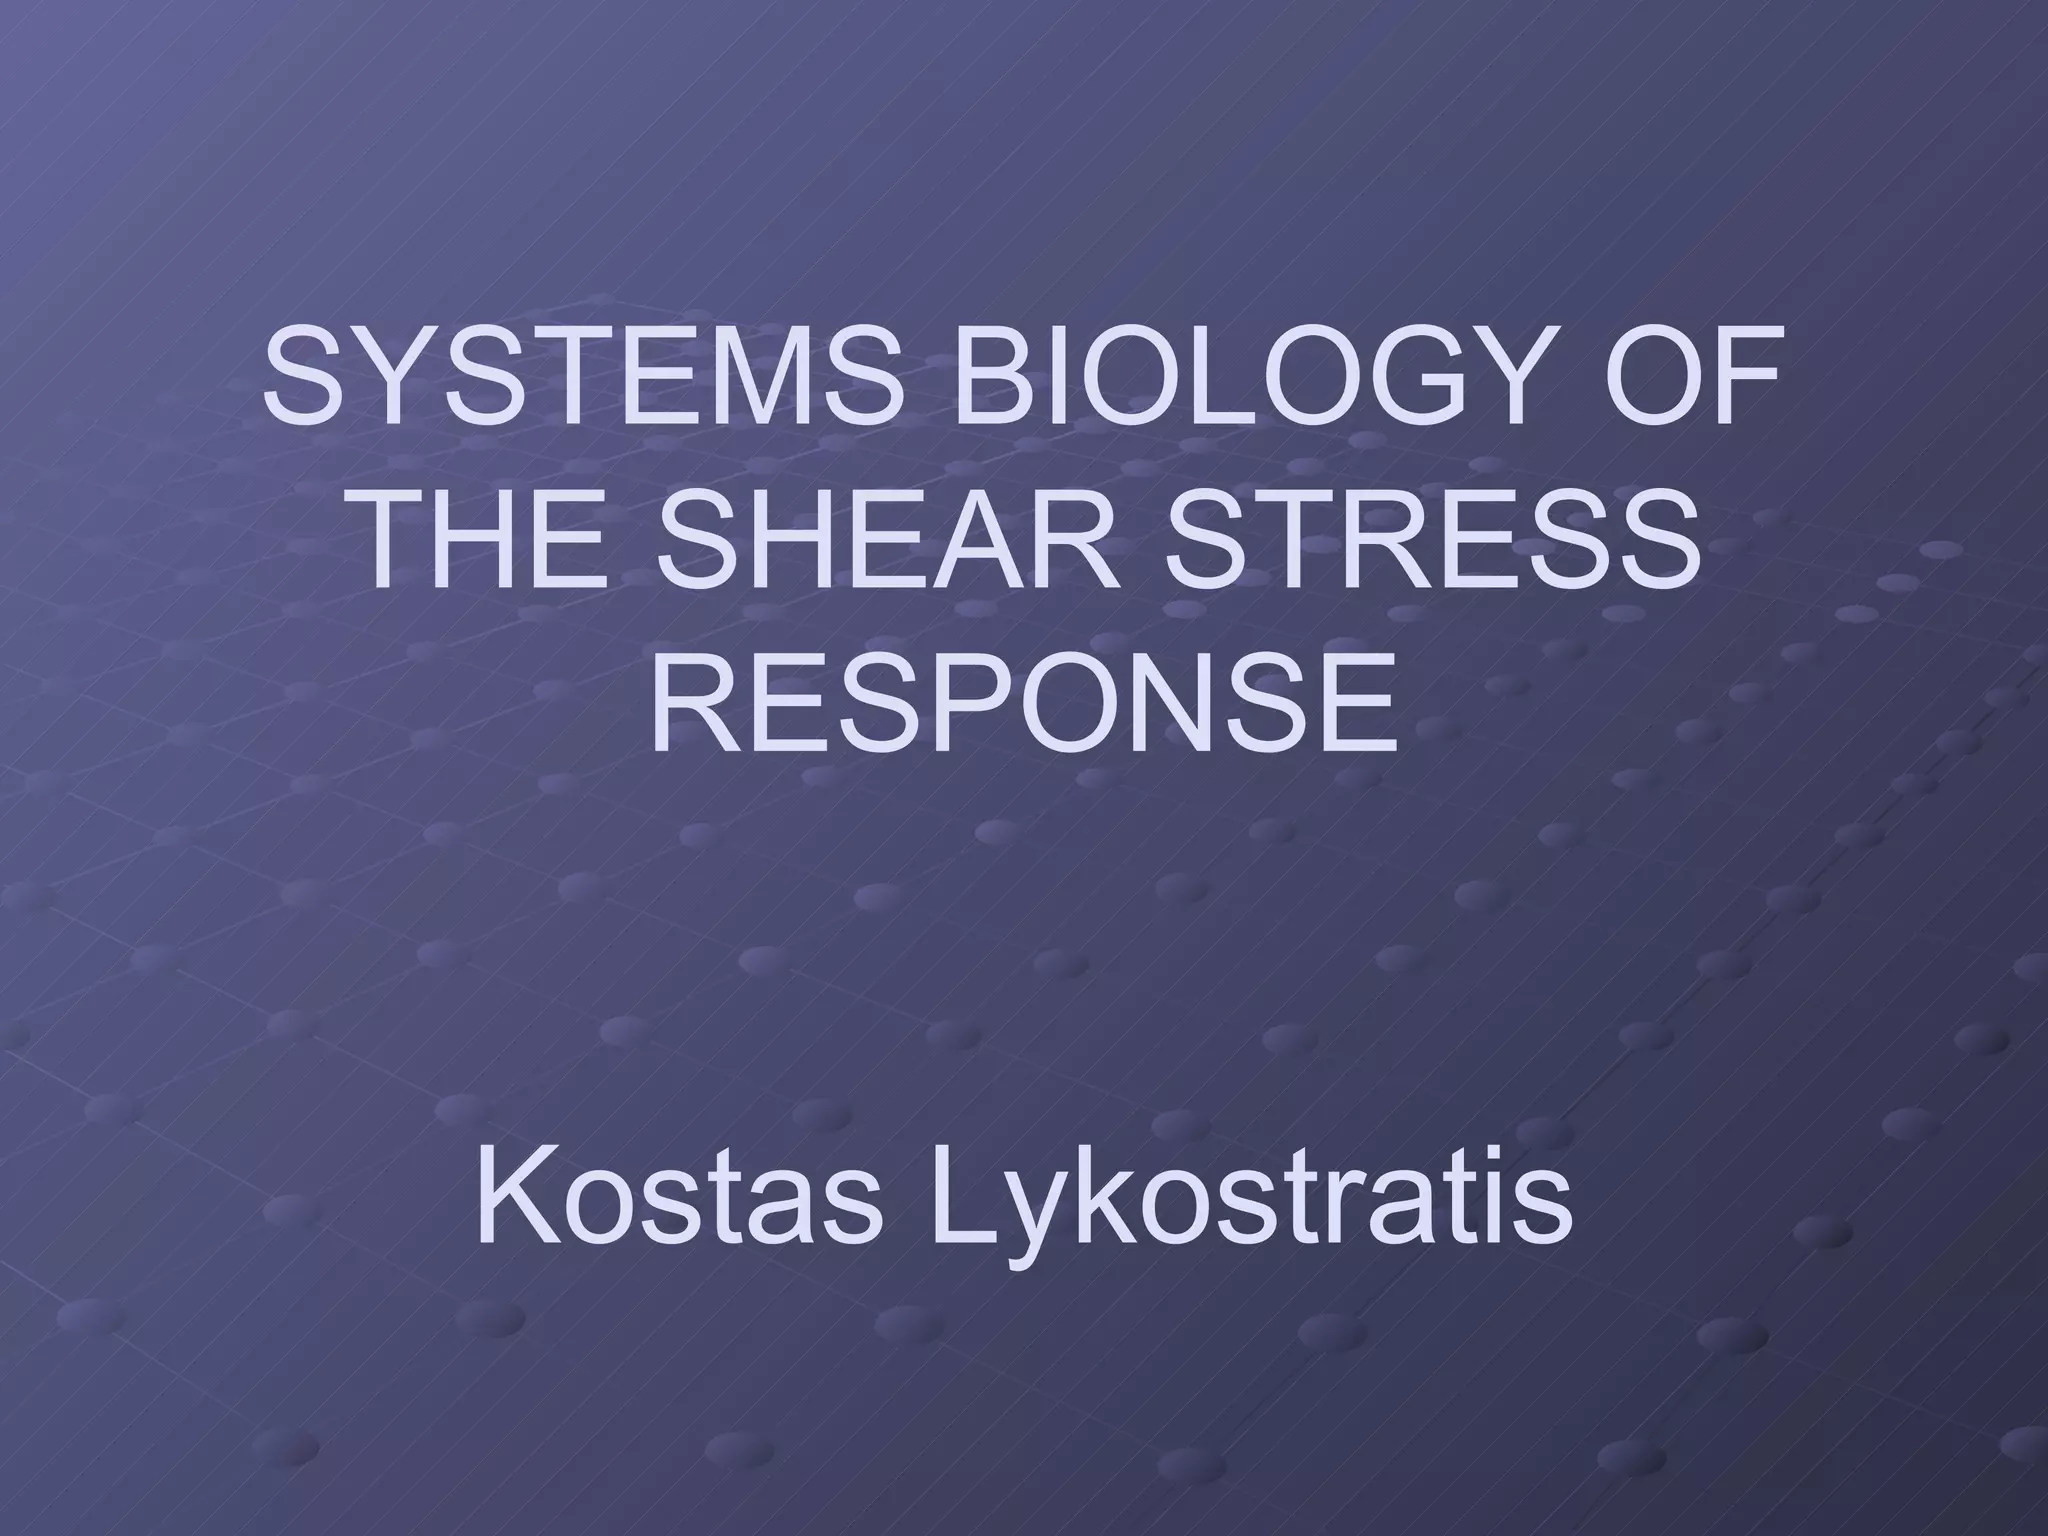
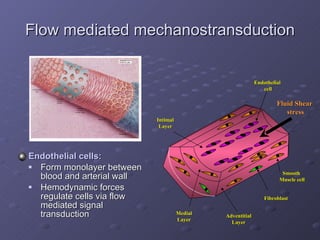
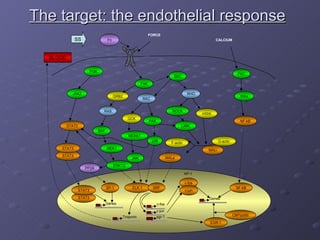
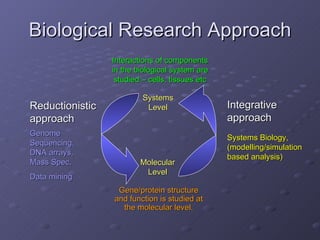
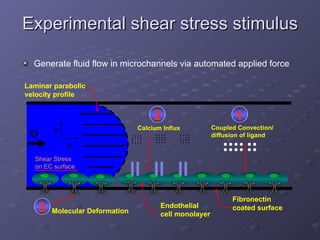
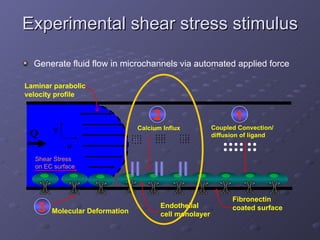
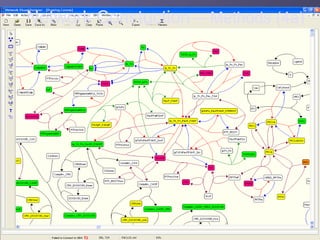
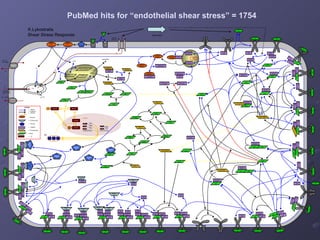
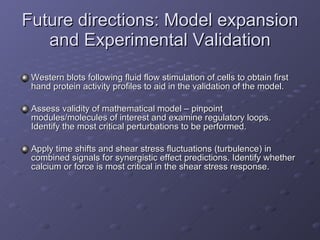
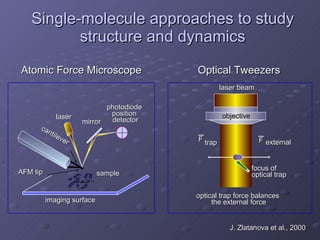
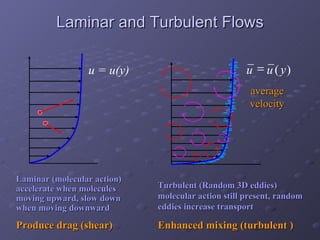
1. The document discusses systems biology approaches to modeling the endothelial cell response to fluid shear stress. It describes experimental techniques to apply controlled fluid shear stress and measure downstream cellular responses.
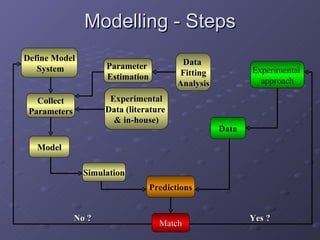
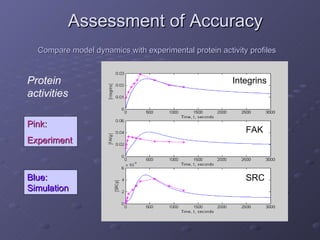
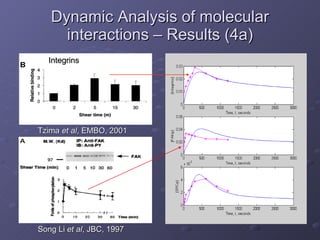
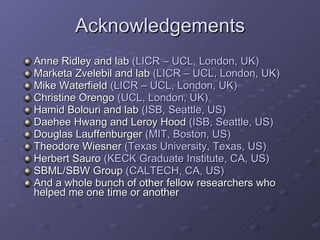
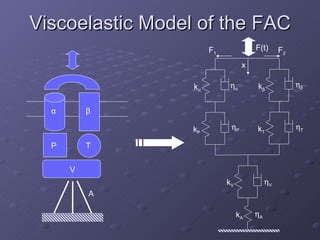
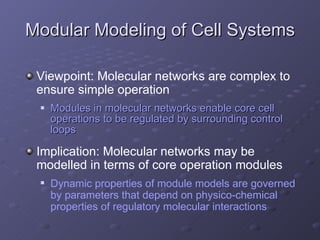
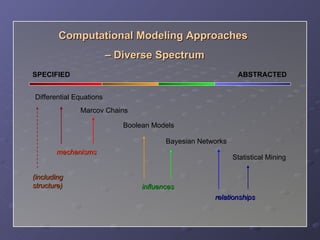
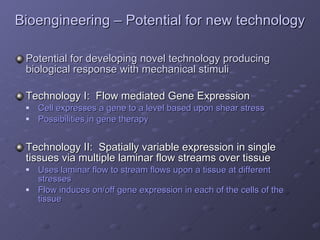
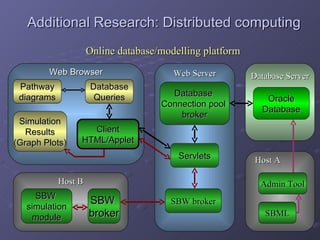
2. Mathematical models are formulated to represent molecular interactions and pathways involved in the shear stress response. Model predictions are compared to experimental data to validate and refine the models.
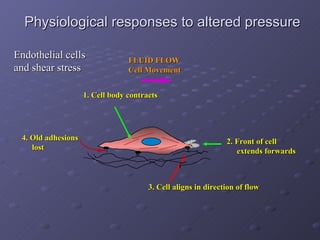
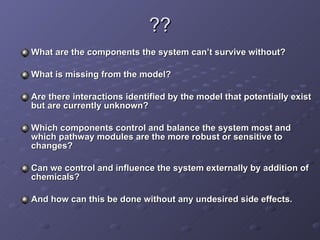
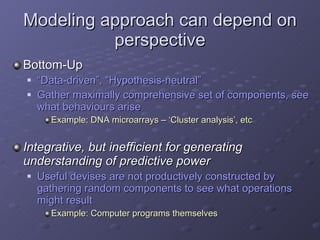
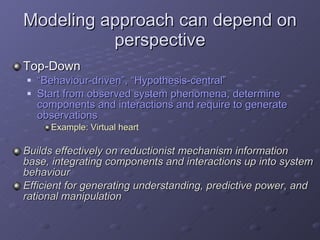
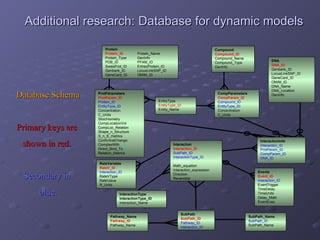
3. The models can provide insights into critical components, feedback loops, and how external perturbations may influence the cellular response to shear stress. Further experimental validation of model predictions is needed.
![Mechanistic pathway models formulation Represent molecular interactions with mathematics Translate biochemical formulas representing an interaction to ODEs. rate constant concentrations k f [A][B] k r [C] is described by dC dt Forward reaction rate Reverse reaction rate A B k r k f C](https://image.slidesharecdn.com/kostasludwig2005c-101219074918-phpapp01/85/KL-PhD-Presentation-7-320.jpg)
![Mass Transfer of molecules Methods and Results (1) Finite Element Method: c[x, y, z, 0]=0 c[x, y, 0, t]=c o Convection – Diffusion Equation Boundary Conditions: Element Node 1 Y X 2 2 2 2 y x z t D c c v y c y=+b x=+a y c 0 y c y=-b K on R u C s - K off R b SD N A Progression of [x] spread towards the tube walls (fibronectin surface)](https://image.slidesharecdn.com/kostasludwig2005c-101219074918-phpapp01/85/KL-PhD-Presentation-10-320.jpg)

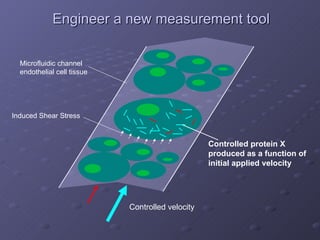
![Molecular Deformation – Methods and Results (3) 1. Relative deformation x 2. [x] of deformed receptors Laminar Flow – Stable Force Turbulent Flow - Oscillatory Force 3. Rates of Deformation 0 F F ) cos( 0 t F F T K W K x LS F K B r r exp )) ( 1 ( ) ( 0 T K W K x LS F K B f f exp ) ( ) ( 0 dt dF k m F x k dt dx k k m 1 1 1 2 1 1 1 kf A kr kf dt A d ] )[ ( ] [ * * opposite response](https://image.slidesharecdn.com/kostasludwig2005c-101219074918-phpapp01/85/KL-PhD-Presentation-15-320.jpg)


![Shear stress and calcium influx dynamics Relationship between strain energy density and applied shear stress Fraction of channels in the open state Relationship for Membrane Potential Relationship for Membrane Permeability Balance equation for cytosolic-free calcium ions kTN - f e W( τ ) 1+ α *exp f o ( τ ) = 1 W( τ ) = (1- ε ) τ L + 16 μ 2 + τ 2 L 2 ( ε 2 -2 ε +1) - 4 μ ] 2 16 μ 2 + τ 2 L 2 ( ε 2 -2 ε +1) [ ] (1- ε ) τ L + [ 8 q s +q in -q b -q out dCa c dt f 0 (0)+tanh [f 0 ( τ )- f 0 (0)] P max P(t, τ ) = { } π t t f [ ] Δφ (t, τ ) = -E r - Δ E m ( τ ) 1-e -t/t φ](https://image.slidesharecdn.com/kostasludwig2005c-101219074918-phpapp01/85/KL-PhD-Presentation-38-320.jpg)


![[Ebooks PDF] download Current Topics in Membranes 1st Edition Klaus Ley (Eds....](https://cdn.slidesharecdn.com/ss_thumbnails/51184-250217110538-e38d4180-thumbnail.jpg?width=640&height=640&fit=bounds)


