Data Teknis Gossen Metrawatt Insulation Tester METRISO PROPT. Siwali Swantika
Pemesanan produk, hubungi PT Siwali Swantika melalui WhatsApp, Jakarta : 0811-1519-949 (chat only) | Surabaya : 0811-1519-948 (chat only). Kunjungi website kami di www.siwali.com, untuk detail informasi spesifikasi dan model alat.
Fiber Optic Sensors, Fiber Optical Temperature Sensor - Rugged Monitoringrugged_monitoring
Check what is Fiber Optic Sensor? The sensor which uses optical fiber as sensing device. Rugged Monitoring have top fiber optic temperature sensors team on monitors, Software accessories, E-mobility, medical, energy, RF/Microwave, research labs etc.
* Basics of Induction heating and heat treating
* Role and specifics of induction technology in heat treating in automotive parts
* Main processes of induction heat treating of automotive parts
* Computer simulation and optimization of induction processes and heating coils
* Advanced design of induction coils
* Magnetic controllers on induction coils
* Induction coil manufacturing
* Maintenance of induction coils
* Stresses and distortions in the process of induction heating
* Examples of induction heat treating (parts, processes, coils, installations)
* Conclusions
Charlotte Lelieveld - Smart Material Systems for Architectural ApplicationsMerford
Een presentatie van Charlotte Lelieveld. Zij is promovendus aan de TU Delft, faculteit Building Technology & Architectural Engineering met een specialiteit in "smart materials". Het onderwerp van deze lezing was slimme materialen. Wat verstaat men onder deze term? Aan de hand van welke eigenschappen kun je deze materialen onderscheiden? Er bestaan passieve en actieve slimme materialen. Voor welke toepassingen zijn deze geschikt? Charlotte schetste tijdens deze presentatie een toekomstbeeld van het gebruik van deze materialen in de architectuur.
Gegeven op dag 7 van Soundbites by Merford met als thema: Slimme Materialen.
http://www.merford.nl/soundbites
ASM 2013 Fluxtrol Presentation - Enhancing Inductor Coil ReliabilityFluxtrol Inc.
http://fluxtrol.com
In induction hardening, thermal fatigue is one of the main failure modes of induction heating coils. There have been papers published that describe this failure mode and others that describe some good design practices [1-3]. The variables previously identified as the sources of thermal fatigue include radiation from the part surface, frequency, current, concentrator losses, water pressure and coil wall thickness. However, there is very little quantitative data on the factors that influence thermal fatigue in induction coils available in the public domain. By using finite element analysis software this study analyzes the effect of common design variables of inductor cooling, and quantifies the relative importance of these variables. A comprehensive case study for a single shot induction coil with Fluxtrol A concentrator applied is used for the analysis.
Chapter 1a: Fluxtrol Basics of Induction Techniques Part 1Fluxtrol Inc.
http://fluxtrol.com
Chapter 1a Fluxtrol Basics of Induction Techniques Part 1
Includes:
Principles of Induction Heating,
Process Control and Layout, Theory, and more.
Study on Droplet-based Liquid Cooling of an Hotspot using Digital Microfluidicsbgshreyas85
Thermal management in present day integrated circuits (ICs) has become extremely challenging to deal with, as more number of transistors is packed into smaller die sizes. Conventional macro-scale and bulky cooling mechanisms like heat sinks, fans and heat pipes are unsuitable to handle the non-uniform spatial power distributions (hotspots) found on these small, yet, powerful ICs. To tackle this thermal management issue, we present a digital microfluidics (DMF) microscale liquid cooling system working on the principle of electrowetting on dielectric (EWOD). EWOD is an efficient and low power consuming actuation technique to pump liquids at microscale. In EWOD DMF, fluids are handled in droplet-wise by external electric field, thus, mechanical pumps and valves are not necessary to control the liquid motion.
In this demonstration, the EWOD system comprises a parallel arrangement of thin film Indium Tin Oxide (ITO) coated glass devices separated by spacer gap of 150µm. The bottom device is patterned with a 3D arrangement of ITO heaters/RTDs (Resistance temperature detectors) with EWOD electrodes separated by a passivation layer. By using the heaters and RTDs in a 600µm x 600µm area on the bottom device, we emulate hotspots found on ICs by controlling and sensing the temperature. A reservoir holds a pool of de-ionized water from which a small liquid drop of 800nL is dispensed and delivered to the hotspot at high velocities. When multiple drops are passed over the hotspot, considerable cooling will occur.
With the help of the ITO thin film RTDs and a pre-calibrated temperature coefficient of resistance data, the temperature of the hotspot before and after cooling is recorded for different dwell times of water droplets on the hotspot and heat fluxes. A plot between the temperature and the droplet traveling time for various speeds and heat flux is established. By using a high speed camera and synchronizing it with the RTD measurement, the meniscus of the droplet on the hotspot is examined for phase change at various heat fluxes to identify and study its effects on the hotspot temperature. This study is crucial to distinguish single phase and phase change of the coolant in estimating the performance of the hotspot cooling. This demonstration provides a foundation to a novel microfluidic hotspot cooling system in current generation ICs and can be extended to 3D ICs.
Presentation from 2013 30th International Battery Symposium by Cindy Millsaps related to designing for compliance with various portable battery standards.
Pemesanan produk, hubungi PT Siwali Swantika melalui WhatsApp, Jakarta : 0811-1519-949 (chat only) | Surabaya : 0811-1519-948 (chat only). Kunjungi website kami di www.siwali.com, untuk detail informasi spesifikasi dan model alat.
2 Fluxtrol Sample Induction Heating InstallationsFluxtrol Inc.
http://fluxtrol.com
Typical Induction Installation,
Review of Various Induction Machine Types, Block Diagrams of Process and Equipment Required, Generators, Frequesncy Variations, and more.
Resonant-tunneling-diode effect in Si-based double-barrier structure sputtere...IJRES Journal
This paper presents the resonant-tunneling-diode (RTD) effect in a SiO2/n-Si/SiO2/p-Si double-barrier structural thin films fabricated using radio frequency (RF) magnetron sputtering at room temperature (300 K). The implementation of a circuit prototype is first accomplished by modulating a Si-based RTD with a solar-cell bias voltage. The important electrical properties of the peak current density and peak-to-valley current ratio (PVCR) are 184 nA/cm2 and 1.67, respectively. The connection between the two RTDs in series is biased by a solar cell. The value of the switching transition time is 24.37 μs; oscillation occurs with an operating frequency of 41.6 KHz. In semiconductor applications, the developed RTD is characterized by stability, enduring environmentally elevated temperature and relative humidity.
Effect of Temperature on Power Output from Different Commercially available P...IJERA Editor
Photovoltaic (PV) modules are rated at standard test condition (STC) i.e. at irradiance of 1000 W/m2, temperature at 25 0C and solar spectrum of Air Mass 1.5G. The actual output from the PV module in the field varies from its rated output due to change in ambient environmental conditions from the STC. The reduction in output due to temperature is determined by temperature coefficient which varies with the different types of solar module technologies. In this study, temperature coefficient of different types of commercially available solar modules is evaluated. The testing has been carried out at PV test facility of Solar Energy Centre, New Delhi. The modules are selected randomly from various manufactures. It is found that the average temperature coefficient of power for mono-crystalline, multi-crystalline and CdTe based modules are -0.446 %/°C, -0.387 %/°C and -0.172 %/°C respectively. In case of amorphous silicon module, only one sample is measured and the temperature coefficient is -0.234 %/°C. This study shows that the temperature coefficient for mono crystalline silicon module is higher than the other types of solar modules. This study provides an understanding on the variation in energy generation due to temperature correction between different cell technologies.
Electrical current, voltage, resistance, capacitance, and inductance are a few of the basic elements of electronics and radio. Apart from current, voltage, resistance, capacitance, and inductance, there are many other interesting elements to electronic technology. ... Use Electronics Notes to learn electronics online.
Microelectronic technology
This report briefly discusses the need for Metal-Oxide-Semiconductor Field Effect Transistors (MOSFETs), their structure and principle of operation. Then it details the fabrication and characterization of the MOSFETs fabricated at the microelectronic lab at University of Malaya
shows the simulation and analysis of a MOSFET device using the MOSFet tool. Several powerful analytic features of this tool are demonstrated, including the following:
calculation of Id-Vg curves
potential contour plots along the device at equilibrium and at the final applied bias
electron density contour plots along the device at equilibrium and at the final applied bias
spatial doping profile along the device
1D spatial potential profile along the device
Analysis and Modeling of Transformerless Photovoltaic Inverter SystemsIJMER
International Journal of Modern Engineering Research (IJMER) is Peer reviewed, online Journal. It serves as an international archival forum of scholarly research related to engineering and science education.
Similar to Kikusui tos7210s pid_insulation_tester_denkei (20)
Multi-channel low noise arbitrary waveform generation system
Multi-channel precision low noise DC voltage source
Multi-channel low noise amplification system
PBZ Series Intelligent Bi-Polar Power Supplies
The PBZ series is a bipolar type DC regulated power source that can continuously change both + and – polarities passing through 0 without changing the output terminal.
By adopting a “Switching + Linear” system, the PBZ is able to realize both drastic weight reduction as well as high speed and low noise operation. Since operation covers 4 quadrants, power can be both supplied (source) and absorbed (sink). The PBZ can also drive inductive or capacitive loads. The unit also equips a signal generator function which enables waveform and sequence creation. The PBZ is also capable of synchronized operation which is required for voltage variation tests, and it can also be expanded for large current applications through master-slave parallel operation.
Inspect solar panel bypass diodes for opens and shorts in broad daylight without covering panels
INSPECT SOLAR PANEL BYPASS DIODES FOR OPENS AND SHORTS IN BROAD DAYLIGHT WITHOUT COVERING PANELS
Traditionally, bypass diodes can only be inspected for good working condition at night or when power is not being generated by the solar panels in order to verify that any applied current is guided past the solar cells.
With the FT4310, you can detect for open faults even when the sun is out without covering the panels.
Testing can also be performed at night.
*Testing for short-circuit faults can only be performed during the day.
DP800 series includes single output, two output and three output programmable linear DC power supply. They have pure output, excellent performance indicators, multiple analysis functions, rich interfaces, and can meet the diverse testing needs.
Essentials of Automations: Optimizing FME Workflows with ParametersSafe Software
Are you looking to streamline your workflows and boost your projects’ efficiency? Do you find yourself searching for ways to add flexibility and control over your FME workflows? If so, you’re in the right place.
Join us for an insightful dive into the world of FME parameters, a critical element in optimizing workflow efficiency. This webinar marks the beginning of our three-part “Essentials of Automation” series. This first webinar is designed to equip you with the knowledge and skills to utilize parameters effectively: enhancing the flexibility, maintainability, and user control of your FME projects.
Here’s what you’ll gain:
- Essentials of FME Parameters: Understand the pivotal role of parameters, including Reader/Writer, Transformer, User, and FME Flow categories. Discover how they are the key to unlocking automation and optimization within your workflows.
- Practical Applications in FME Form: Delve into key user parameter types including choice, connections, and file URLs. Allow users to control how a workflow runs, making your workflows more reusable. Learn to import values and deliver the best user experience for your workflows while enhancing accuracy.
- Optimization Strategies in FME Flow: Explore the creation and strategic deployment of parameters in FME Flow, including the use of deployment and geometry parameters, to maximize workflow efficiency.
- Pro Tips for Success: Gain insights on parameterizing connections and leveraging new features like Conditional Visibility for clarity and simplicity.
We’ll wrap up with a glimpse into future webinars, followed by a Q&A session to address your specific questions surrounding this topic.
Don’t miss this opportunity to elevate your FME expertise and drive your projects to new heights of efficiency.
Securing your Kubernetes cluster_ a step-by-step guide to success !KatiaHIMEUR1
Today, after several years of existence, an extremely active community and an ultra-dynamic ecosystem, Kubernetes has established itself as the de facto standard in container orchestration. Thanks to a wide range of managed services, it has never been so easy to set up a ready-to-use Kubernetes cluster.
However, this ease of use means that the subject of security in Kubernetes is often left for later, or even neglected. This exposes companies to significant risks.
In this talk, I'll show you step-by-step how to secure your Kubernetes cluster for greater peace of mind and reliability.
GraphRAG is All You need? LLM & Knowledge GraphGuy Korland
Guy Korland, CEO and Co-founder of FalkorDB, will review two articles on the integration of language models with knowledge graphs.
1. Unifying Large Language Models and Knowledge Graphs: A Roadmap.
https://arxiv.org/abs/2306.08302
2. Microsoft Research's GraphRAG paper and a review paper on various uses of knowledge graphs:
https://www.microsoft.com/en-us/research/blog/graphrag-unlocking-llm-discovery-on-narrative-private-data/
DevOps and Testing slides at DASA ConnectKari Kakkonen
My and Rik Marselis slides at 30.5.2024 DASA Connect conference. We discuss about what is testing, then what is agile testing and finally what is Testing in DevOps. Finally we had lovely workshop with the participants trying to find out different ways to think about quality and testing in different parts of the DevOps infinity loop.
State of ICS and IoT Cyber Threat Landscape Report 2024 previewPrayukth K V
The IoT and OT threat landscape report has been prepared by the Threat Research Team at Sectrio using data from Sectrio, cyber threat intelligence farming facilities spread across over 85 cities around the world. In addition, Sectrio also runs AI-based advanced threat and payload engagement facilities that serve as sinks to attract and engage sophisticated threat actors, and newer malware including new variants and latent threats that are at an earlier stage of development.
The latest edition of the OT/ICS and IoT security Threat Landscape Report 2024 also covers:
State of global ICS asset and network exposure
Sectoral targets and attacks as well as the cost of ransom
Global APT activity, AI usage, actor and tactic profiles, and implications
Rise in volumes of AI-powered cyberattacks
Major cyber events in 2024
Malware and malicious payload trends
Cyberattack types and targets
Vulnerability exploit attempts on CVEs
Attacks on counties – USA
Expansion of bot farms – how, where, and why
In-depth analysis of the cyber threat landscape across North America, South America, Europe, APAC, and the Middle East
Why are attacks on smart factories rising?
Cyber risk predictions
Axis of attacks – Europe
Systemic attacks in the Middle East
Download the full report from here:
https://sectrio.com/resources/ot-threat-landscape-reports/sectrio-releases-ot-ics-and-iot-security-threat-landscape-report-2024/
Builder.ai Founder Sachin Dev Duggal's Strategic Approach to Create an Innova...Ramesh Iyer
In today's fast-changing business world, Companies that adapt and embrace new ideas often need help to keep up with the competition. However, fostering a culture of innovation takes much work. It takes vision, leadership and willingness to take risks in the right proportion. Sachin Dev Duggal, co-founder of Builder.ai, has perfected the art of this balance, creating a company culture where creativity and growth are nurtured at each stage.
JMeter webinar - integration with InfluxDB and GrafanaRTTS
Watch this recorded webinar about real-time monitoring of application performance. See how to integrate Apache JMeter, the open-source leader in performance testing, with InfluxDB, the open-source time-series database, and Grafana, the open-source analytics and visualization application.
In this webinar, we will review the benefits of leveraging InfluxDB and Grafana when executing load tests and demonstrate how these tools are used to visualize performance metrics.
Length: 30 minutes
Session Overview
-------------------------------------------
During this webinar, we will cover the following topics while demonstrating the integrations of JMeter, InfluxDB and Grafana:
- What out-of-the-box solutions are available for real-time monitoring JMeter tests?
- What are the benefits of integrating InfluxDB and Grafana into the load testing stack?
- Which features are provided by Grafana?
- Demonstration of InfluxDB and Grafana using a practice web application
To view the webinar recording, go to:
https://www.rttsweb.com/jmeter-integration-webinar
GDG Cloud Southlake #33: Boule & Rebala: Effective AppSec in SDLC using Deplo...James Anderson
Effective Application Security in Software Delivery lifecycle using Deployment Firewall and DBOM
The modern software delivery process (or the CI/CD process) includes many tools, distributed teams, open-source code, and cloud platforms. Constant focus on speed to release software to market, along with the traditional slow and manual security checks has caused gaps in continuous security as an important piece in the software supply chain. Today organizations feel more susceptible to external and internal cyber threats due to the vast attack surface in their applications supply chain and the lack of end-to-end governance and risk management.
The software team must secure its software delivery process to avoid vulnerability and security breaches. This needs to be achieved with existing tool chains and without extensive rework of the delivery processes. This talk will present strategies and techniques for providing visibility into the true risk of the existing vulnerabilities, preventing the introduction of security issues in the software, resolving vulnerabilities in production environments quickly, and capturing the deployment bill of materials (DBOM).
Speakers:
Bob Boule
Robert Boule is a technology enthusiast with PASSION for technology and making things work along with a knack for helping others understand how things work. He comes with around 20 years of solution engineering experience in application security, software continuous delivery, and SaaS platforms. He is known for his dynamic presentations in CI/CD and application security integrated in software delivery lifecycle.
Gopinath Rebala
Gopinath Rebala is the CTO of OpsMx, where he has overall responsibility for the machine learning and data processing architectures for Secure Software Delivery. Gopi also has a strong connection with our customers, leading design and architecture for strategic implementations. Gopi is a frequent speaker and well-known leader in continuous delivery and integrating security into software delivery.
UiPath Test Automation using UiPath Test Suite series, part 4DianaGray10
Welcome to UiPath Test Automation using UiPath Test Suite series part 4. In this session, we will cover Test Manager overview along with SAP heatmap.
The UiPath Test Manager overview with SAP heatmap webinar offers a concise yet comprehensive exploration of the role of a Test Manager within SAP environments, coupled with the utilization of heatmaps for effective testing strategies.
Participants will gain insights into the responsibilities, challenges, and best practices associated with test management in SAP projects. Additionally, the webinar delves into the significance of heatmaps as a visual aid for identifying testing priorities, areas of risk, and resource allocation within SAP landscapes. Through this session, attendees can expect to enhance their understanding of test management principles while learning practical approaches to optimize testing processes in SAP environments using heatmap visualization techniques
What will you get from this session?
1. Insights into SAP testing best practices
2. Heatmap utilization for testing
3. Optimization of testing processes
4. Demo
Topics covered:
Execution from the test manager
Orchestrator execution result
Defect reporting
SAP heatmap example with demo
Speaker:
Deepak Rai, Automation Practice Lead, Boundaryless Group and UiPath MVP
Connector Corner: Automate dynamic content and events by pushing a buttonDianaGray10
Here is something new! In our next Connector Corner webinar, we will demonstrate how you can use a single workflow to:
Create a campaign using Mailchimp with merge tags/fields
Send an interactive Slack channel message (using buttons)
Have the message received by managers and peers along with a test email for review
But there’s more:
In a second workflow supporting the same use case, you’ll see:
Your campaign sent to target colleagues for approval
If the “Approve” button is clicked, a Jira/Zendesk ticket is created for the marketing design team
But—if the “Reject” button is pushed, colleagues will be alerted via Slack message
Join us to learn more about this new, human-in-the-loop capability, brought to you by Integration Service connectors.
And...
Speakers:
Akshay Agnihotri, Product Manager
Charlie Greenberg, Host
Kubernetes & AI - Beauty and the Beast !?! @KCD Istanbul 2024Tobias Schneck
As AI technology is pushing into IT I was wondering myself, as an “infrastructure container kubernetes guy”, how get this fancy AI technology get managed from an infrastructure operational view? Is it possible to apply our lovely cloud native principals as well? What benefit’s both technologies could bring to each other?
Let me take this questions and provide you a short journey through existing deployment models and use cases for AI software. On practical examples, we discuss what cloud/on-premise strategy we may need for applying it to our own infrastructure to get it to work from an enterprise perspective. I want to give an overview about infrastructure requirements and technologies, what could be beneficial or limiting your AI use cases in an enterprise environment. An interactive Demo will give you some insides, what approaches I got already working for real.
Kubernetes & AI - Beauty and the Beast !?! @KCD Istanbul 2024
Kikusui tos7210s pid_insulation_tester_denkei
1. T O S 7 2 1 0 S ( S P E C 8 0 7 7 6 )
Capable of setting within the range of 50 Vdc to 2000 Vdc (resolution 1 V)
Ability to switch the applied voltage polarity instantly by the switch on the front panel
The output is floating from the ground potential.
Capable of measuring the current value between measurement points.
S A F E T Y T E S T E R
PID Insulation Tester
(Potential Induced Degradation)
TOS7210S
SAFETY TESTER
2. 2
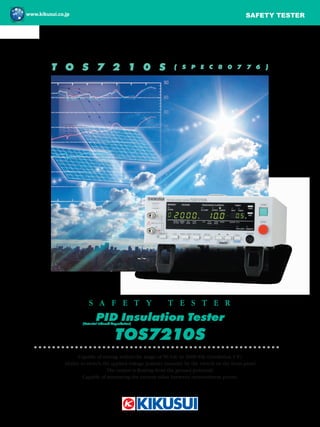
TOS7210S [SPEC80776]
You can set the test voltage that is applied
to the DUT within the range of 50 Vdc to 2000 Vdc
(resolution 1 V). In addition, an insulation resistance
test of the electricity/electronic components or
the electricity/electronic devices is also
possible besides the voltage
specified in JIS C 1302:1994.
In the range of 50 V to 1000 V,
the output properties are complied to JIS C 1302:1994.
Capable of arbitrary setting
of the output voltage
PID Insulation Tester
To evaluate the PID
*
effect
of the PV module!
You can easily change the output polarity
by the switch on the front panel.
The PID deterioration is a reversible phenomenon
that may recover after the reverse bias voltage is applied.
The polarity switching is a convenient function
that can avoid a wiring change that connects
to the DUT. In addition, switching
by the external control through
the RS232C interface is also possible.
Polarity switching function
Conceptual diagram of test
Back sheet
terminal box
Connection to
the solar
cell frame
Connecting the positive polarity and
the negative polarity of the terminal box as one unit
Connects TOS7210S and
the solar cell module
with an attached shield cable.
The PID insulation tester (TOS7210S) is designed based on the insulation resistance tester (TOS7200) to carry out the
evaluation of the PID (Potential Induced Degradation) effect of the PV module precisely and efficiently. Being equipped
with the output ability of 2000 V and the ammeter with nA resolution as well as a polarity switching function, the TOS7210S
is also applicable not only to the PID evaluation but also the evaluation of the insulators that requires a high sensitivity of
measurement. The tester is equipped with the panel memory that is externally accessible and RS232C interface as standard;
it can be flexibly compatible with the automated system.
*Potential Induced Degradation
3. 3
The PID effect is a phenomenon that the amount of power generation by a
cell remarkably decreases when high voltage is applied between the solar
cell and the frame for long hours. It is supposed that the higher the applied
voltage is and/or the higher and more humid the environment is, the further
deterioration accelerates. For example, the potential difference in the string
becomes extremely higher when the number of sheets that are connected in
series increases even if the output voltage of the crystalline silicon solar cell
module is just tens of volts. On the other hand, the grounding methods of the
PCS (Power Conditioning System) that connects to the system as an AC power
supply varies according to the type of PCS. In recent years, the transformerless
method, where the input side is in the floating method (the negative polarity
is not connected to the ground) is increasing. In this case, a high potential
difference occurs between the cell and the ground. Regarding the crystalline
silicon solar cell module, it is proved that the cell having a higher negative
electric potential than that of the frame (ground) easily causes the PID effect.
(See Fig. 1) The PV modules are currently managed with the maximum system
of voltage as 600 V in Japan and 1000 V in Europe. There is a market trend that
the maximum voltage of the commercial mega solar system is raised from the
perspective of reducing the number of the strings and the total number of the
PCS, and improving the efficiency of power generation.
PID effect
The output terminal is floating from the
ground electric potential. *1
In addition, a shield cable is adopted as an output cable.
Therefore, it can be measured only an electric current flowing
between test points excluding the one between
the DUT and the ground, and it realizes to conduct
the highly-sensitiveand precise evaluation.
The output is floating from the ground.
*1: Ground voltage of the terminal that polarity is set as an anode (± 1000 Vdc)
Ground voltage of the terminal that polarity is set as a cathode
(+1000 Vdc and -3000 Vdc)
Back sheet
Sealing material (EVA)
Frame
Na+
Na+
Na+
Na+
White tempered glass
Surface electrode
Anti-reflection film
(Anti-Reflection)
Cell
Back side electrode
Na+
Na+
Na+
Na+
[Fig. 1]
[Fig. 2]
Analog output terminal
In the resistance display mode,
the voltage depending on the measured resistance
is logarithmically compressed and output
within the range of 0 V to 4 V.
In the current display mode, the current is output in a
linear scale depending on the measured current and
ranges of measurement (4 ranges).
You can analyze the changes or the deterioration
status of the DUT by using an external recording
device such as the data logger.
Actual
size
System
Positive
polarity
Negative
polarity
String
Electrode interval
Potential difference
Approx. 360 V
Frame
Panel interval
Potential difference
Approx. 40 V
PCS
Figure 2 shows the simulation of a crystalline silicon solar cell
module being exposed to a high potential difference. It is
considered that, in the PID effect of the crystalline silicon solar
cell module, the sodium ion in the white tempered plate glass
moves to the side of the cell and then causes the deterioration.
(The PID effect of the thin film solar cell module is also
confirmed, however, the mechanism of the deterioration is
different from that of the crystalline silicon solar cell module.)
The cause of the PID effect is currently being tested with and
researched by various research organizations.
4. 4
Information related to PID test
■ Test method
We installed the light receiving surface of the glass covered with an aluminum board in a constant temperature chamber and connected it to
the PID insulation tester TOS7210S. We then kept the module temperature at 85 °C and applied -1000 Vdc, -1500 Vdc, and -2000 Vdc to each
of three pieces of the single cell modules.
■ Confirmation of the output characteristics by the solar simulator
An output drop can be confirmed with the initial (Pmax/F.F./Isc /Voc) characteristics of the module and the changes with the elapsed time.
▲ 6-inch polycrystalline silicon / unit cell module
The 6-inch polycrystalline silicon cell of the test module is laminated, as a unit cell module,
with white tempered glass, ethylene vinyl acetate (sealing material), and back sheet.
▼ Module in the temperature chamber
▼ Method of connecting the PV module
(solar panel) and TOS7201S
▼ Leakage current and
temperature graph of the module
▲ Applied voltage and
maximum power
▲ Applied voltage and F.F ▲ Applied voltage and
short circuit current
▲ Applied voltage and
open circuit voltage
■ Creation of the single cell module
■ Test on the PID effect
The experiment to reproduce the PID effect was conducted as the collaborative research theme in "Stage II Consortium of high-reliability
PV module development and evaluation" that was established in April 2011 by the Research Center of Photovoltaic Technologies, National
Institute of Advanced Industrial Science and Technology (hereinafter called "AIST"). Kikusui Electronics Corp. developed TOS7210S as a
necessary test equipment contributed for this experiment project.
*The contents mentioned above was announced in the 61st academic lecture of Japan Society of Applied Physics on March 19, 2014.
Maximum power P max Fill factor F.F Short circuit current I sc Open circuit voltage V oc
● Materials used for a solar battery module
Cell substrate 6-inch polycrystalline silicon cell
Light-receiving glass White tempered glass
Sealing material Ethylene vinyl acetate (EVA)
Back sheet PVF/PET/PVF constituted back sheet
Reference: National Institute of Advanced Industrial Science and Technology
+
Back sheet
- Polycrystalline silicon cell EVA
White tempered glass
Aluminum board
Conductive rubber sheet
5. 5
The normal part emits light perfectly, but as
the deterioration accelerates, the shaded area
increases eventually and ceases to emit light.
This method is adopted useful to confirm the
PID effect. In addition, it is admitted that the
deterioration in the PID effect is reduced with the
elapled time by a reversible effect or recovered
nearly to the initial state.
■ Confirmation of the deterioration by EL (electro-luminescence)
■ Various evaluation methods
Under the present conditions, any of the evaluation test method or the standard are not established.
Each of the research organizations, experiment stations, and module manufacturers in the various countries conducting its own evaluation.
● Water method : Method to apply the water on the module glass surface and apply the voltage
● Chamber method : Method to manage temperature and humidity in the temperature chamber and apply the voltage
● Aluminum method
: Method to cover the glass with an aluminum foil or let an aluminum board adhere to the glass surface, and apply the voltage
We continue experiments in each test method to examine each superiority and inferiority, difference by the temperature or humidity for future
standardization. The international standard IEC is devising the test method for the PID effect.
■ Confirm the difference in deterioration by applied voltage
The ratio that the maximum electricity (Pmax) of the module decreases when the applied voltage increases. In addition, as the EL image
indicates, the higher the applied voltage becomes, the shaded area in the EL image increases in the same interval.
In the PID effect after conducting the
reversible effect test, it may be found that
the deterioration is reduced or recover
nearly to the initial state in some module
by being left or the reverse voltage is
being applied. The polarity can be easily
changed in TOS7210S with the switch.
You are not bothered by the complicated
connection to the DUT. The module that
the Pmax drops remarkably (less than -99
%), and the recovery is not confirmed even
after applying voltage for long hours. On
the other hand, the module that the Pmax
drops moderately (approximately -53 % to
-71 %) recovered almost perfectly in 0.5 to
two hours. In addition, it canbe recovered
regardless of the applied voltage.
Deteriorated Deteriorated
Normal Normal (recovered)
Reversible effect (exposed indoor)
Result of EL test
Reference: National Institute of Advanced Industrial Science and Technology
■ Recovery examination and the results by applying the reverse voltage
▼Recovery of the sample that output drops by -99 % and less in the PID experiment
+1000 V +1500 V +2000 V
▼Recovery of the sample that output drops by -65 % to -71 % and less in the PID experiment
+1000 V +1500 V +2000 V
▼Recovery of the sample that output drops by -53 % to -58 % and less in the PID experiment
+1000 V +1500 V +2000 V Result of EL test after recovery test
-99 % and less
200 hours later
-65 to -71 %
2 hours later
-53 to -58 %
2 hours later
Output lowered
Information related to PID test
6. Output section
Output voltage range 50 V to 2000 V
Resolution 1 V
Accuracy ± (1.5 % of setting + 2 V)
Maximum rated output 2 W (2000 V/1 mA)
Maximum rated current 1 mA
Output
terminals
Output type Floating
Isolation voltage
± 1000 Vdc (The terminal that polarity is set to positive polarity)
+ 1000 Vdc and -3000 Vdc (The terminal that polarity is set to negative polarity)
Ripple 2000 V/under no load 20 Vp-p or less
Maximum rated load 20 Vp-p or less
Voltage regulation 1 % or less (maximum rated load → no load)
Short-circuiting current 2 mA or less (250 mA or less instantaneous)
Output rise time 50 ms or less (10 % to 90 %, no load)
Discharge function Forced discharge at the end of test (discharge resistance: 20 kΩ)
Voltmeter
Measurement range 0 V to 2400 V
Resolution 1 V
Accuracy ± (1 % of reading +1 V)
Resistance meter
Measurement range 0.01 MΩ to 5000 MΩ (In the range of over 100 nA to a maximum rated current of 1 mA)
Display □.□□MΩ [R < 10.0 MΩ]
□□.□MΩ [10.0 MΩ ≤ R < 100.0 MΩ]
□□□MΩ [100.0 MΩ ≤ R < 1 000 MΩ]
□□□□MΩ [1 000 MΩ ≤ R ≤ 5 000 MΩ]
(R = measured insulation resistance)
Accuracy *1 ±(10 % of reading) [100 nA < i ≤ 200 nA]
±(5 % of reading) [200 nA < i ≤ 1 μA]
±(2 % of reading) [1 μA < i ≤ 1 mA]
(i = measured output-voltage value/measured resistance value)
Measurement range The current measurement range is selectable between AUTO and FIX.
AUTO Automatically changes the current measurement range according to the current for measuring resistance.
FIX
Fixes the current measurement range based on the output voltage set value and LOWER set value
(in W COMP OFF status)
Holding function Holds the resistance value obtained at the end of testing while a PASS judgment is being output.
Ammeter
Measurement range 0.000 μA to 1900 μA
Display □.□□□μA [i< 10.00 μA]
□□.□□μA [10.00 μA ≤ i< 100.0 μA]
□□□.□μA [100.0 μA ≤ i< 1 000 μA]
□□□□μA [1 000 μA ≤ i]
(i =measured current value)
Accuracy *2 ±(4 % of reading +0.005 μA) [i< 10.00 μA]
±(4 % of reading +0.005 μA) [10.00 μA ≤ i < 100.0 μA]
±(2 % of reading +0.005 μA) [100.0 μA ≤ i < 1 000 μA]
±(2 % of reading) [1 000 μA ≤ i]
(i =measured current value)
Measurement range The current measurement range is selectable between AUTO and FIX.
AUTO Automatically changes the current measurement range according to the measured current value.
FIX
Fixes the current measurement range based on the output voltage set value and LOWER set value
(in W COMP OFF status)
Judgment function
Judgement
method/action
UPPER FAIL Judgement
If a resistance value equal or less than the lower resistance is detected,
the tester shuts off the output and returns an UPPER FAIL judgment.
LOWER FAIL Judgement
If a resistance value equal or less than the lower resistance is detected,
the tester shuts off the output and returns a LOWER FAIL judgment.
Note that no judgment is made within the judgment wait time (WAIT TIME) after the start of the test.
Time
Setting range for the test duration (TEST TIME) 0.5 s to 999 s (TIMER OFF function provided)
Setting range for the wait time (WAIT TIME) 0.3 s to 10 s (TEST TIME > WAIT TIME)
Accuracy ±(100 ppm +20 ms)
*1. Humidity: 20 %rh to 70 %rh (no condensation). No bends in the test leads.
*2. Humidity: 20 %rh to 80 %rh (no condensation). No bends in the test leads.
Humidity 20 %rh to 70 %rh when either of terminal A or terminal B is grounded (no condensation). No bends in the test leads.
■Specifications
6
7. SIGNAL I/O D-SUB 25-pin connector on the rear panel
Input
specifications
High-level input voltage 11 V to 15 V
All input signals are active Low controlled.
The input terminal is pulled up to +12 V using a resistor.
Opening the input terminal is equivalent to inputting a high-level signal.
Low-level input voltage 0 V to 4 V
Low-level input current -5 mA maximum
Input time width 5 ms minimum
Output
specifications
Output method Open collector output (4.5 Vdc to 30 Vdc)
Output withstand voltage 30 Vdc
Output saturation voltage Approx. 1.1 V (at 25°C)
Maximum output current 400 mA (TOTAL)
ANALOG OUT Outputs the measured resistance, measured current and voltage, and current range in DC voltage.
Measured resistance
Vo = log Rx: Resistance measurement
Rx (1 MΩ: 0.30 V, 10 MΩ: 1.04 V, 100 MΩ: 2.00 V, 1000 MΩ: 3.00 V, 10000 MΩ or more: 4.00 V)
Output impedance: 1 kΩ
Measured current
Range 1: Vo[V] = measured value [μA] / 512
Range 2: Vo[V] = measured value [μA] / 64
Range 3: Vo[V] = measured value [μA] / 8
Range 4: Vo[V] = measured value [μA]
COM Analog output-circuit common
Accuracy ±(2 % of full scale)
RS232C D-SUB 9-pin connector on the rear panel (compliant with EIA-232-D)
All functions other than the POWER switch and KEY-LOCK
Baud rate 9600/19200/38400 bps (data: 8 bits; parity: none; stop bit: 2 bits fixed)
REMOTE 6-pin mini-DIN connector on the front panel
The optional remote controller RC01-TOS or RC02-TOS is connected to control remotely
starting/stopping of a test (note that a DIN-mini DIN adapter is required).
Display 7-segment LED, 4-digit voltage display, 4-digit insulation resistance display, 4-digit current display,
and 3-digit time display
Memory function A maximum of 10 types of test conditions can be stored in memory
TEST MODE MOMENTARY A test is conducted only when the START switch is pressed.
FAIL MODE Disables cancellation of FAIL judgment using a stop signal via remote control.
DOUBLE ACTION
Starts a test only when the STOP switch is pressed and the START switch is pressed within
approximately a half-second.
PASS HOLD Allows the time of holding PASS judgment to be set to 0.2 s or HOLD
KEYLOCK Places the tester in a state in which no keystroke other than the START/STOP switch is accepted
Environment
Installation location Indoors and at altitudes up to 2000 m
Warranty range Temperature/Humidity 15 °C to 30 °C (59 °F to 86 °F)/ 20 %rh to 80 %rh (no condensation)
Operating range Temperature/Humidity 0 °C to 40 °C (32 °F to 104 °F)/ 20 %rh to 80 %rh (no condensation)
Storage range Temperature/Humidity -20 °C to 70 °C (-4 °F to 158 °F)/ 90 %rh or less (no condensation)
Power requirements
Nominal voltage range(allowable voltage range) 100 Vac to 240 Vac (85 Vac to 250 Vac)
Power consumption At rated load 30 VA maximum
Allowable frequency range 47 Hz to 63 Hz
Insulation resistance 30 MΩ or more (500 Vdc) [between AC LINE and the chassis]
Hipot
1500 Vac for 1 minutes, 10 mA or less [between AC LINE and the chassis],
3000 Vac, 1 minutes [between A, B terminal and the chassis]
Ground bond 25 Aac/ 0.1 Ω or less
Dimensions((maximum) (mm (inch))/ Weight 214 (8.43") W × 81(3.19") (115 (4.53")) H × 340 (13.39") (385 (15.16")) D/ Approx. 2 kg (Approx.4.41 lbs)
■Specifications
● Rear panel ● Accessories: Shielded cable
1 +
( )
1 MΩ
Rx
7
8. Printed in Japan Issue:Oct.2019 201910PDFEC11a
■ All products contained in this catalogue are equipment and devices that are premised on use under the
supervision of qualified personnel, and are not designed or produced for home-use or use by general consumers.
■ Specifications, design and so forth are subject to change without prior notice to improve the quality. ■ Product
names and prices are subject to change and production may be discontinued when necessary. ■ Product names,
company names and brand names contained in this catalogue represent the respective registered trade name or
trade mark. ■ Colors, textures and so forth of photographs shown in this catalogue may differ from actual products
due to a limited fidelity in printing. ■ Although every effort has been made to provide the information as accurate
as possible for this catalogue, certain details have unavoidably been omitted due to limitations in space. ■ If you
find any misprints or errors in this catalogue, it would be appreciated if you would inform us. ■ Please contact our
distributors to confirm specifications, price, accessories or anything that may be unclear when placing an order or
concluding a purchasing agreement.
●Distributor/Representative
www.kikusui.cn
Room 305,Shenggao Building , No.137,Xianxia Road, Shanghai City, China
Phone : 021-5887-9067 Facsimile : 021-5887-9069
www.kikusuiamerica.com
1-310-214-0000
3625 Del Amo Blvd, Suite 160, Torrance, CA 90503
Phone : 310-214-0000 Facsimile : 310-214-0014
Southwood 4F,6-1 Chigasaki-chuo,Tsuzuki-ku,Yokohama,224-0032,Japan
Phone: (+81)45-482-6353,Facsimile: (+81)45-482-6261,www.kikusui.co.jp