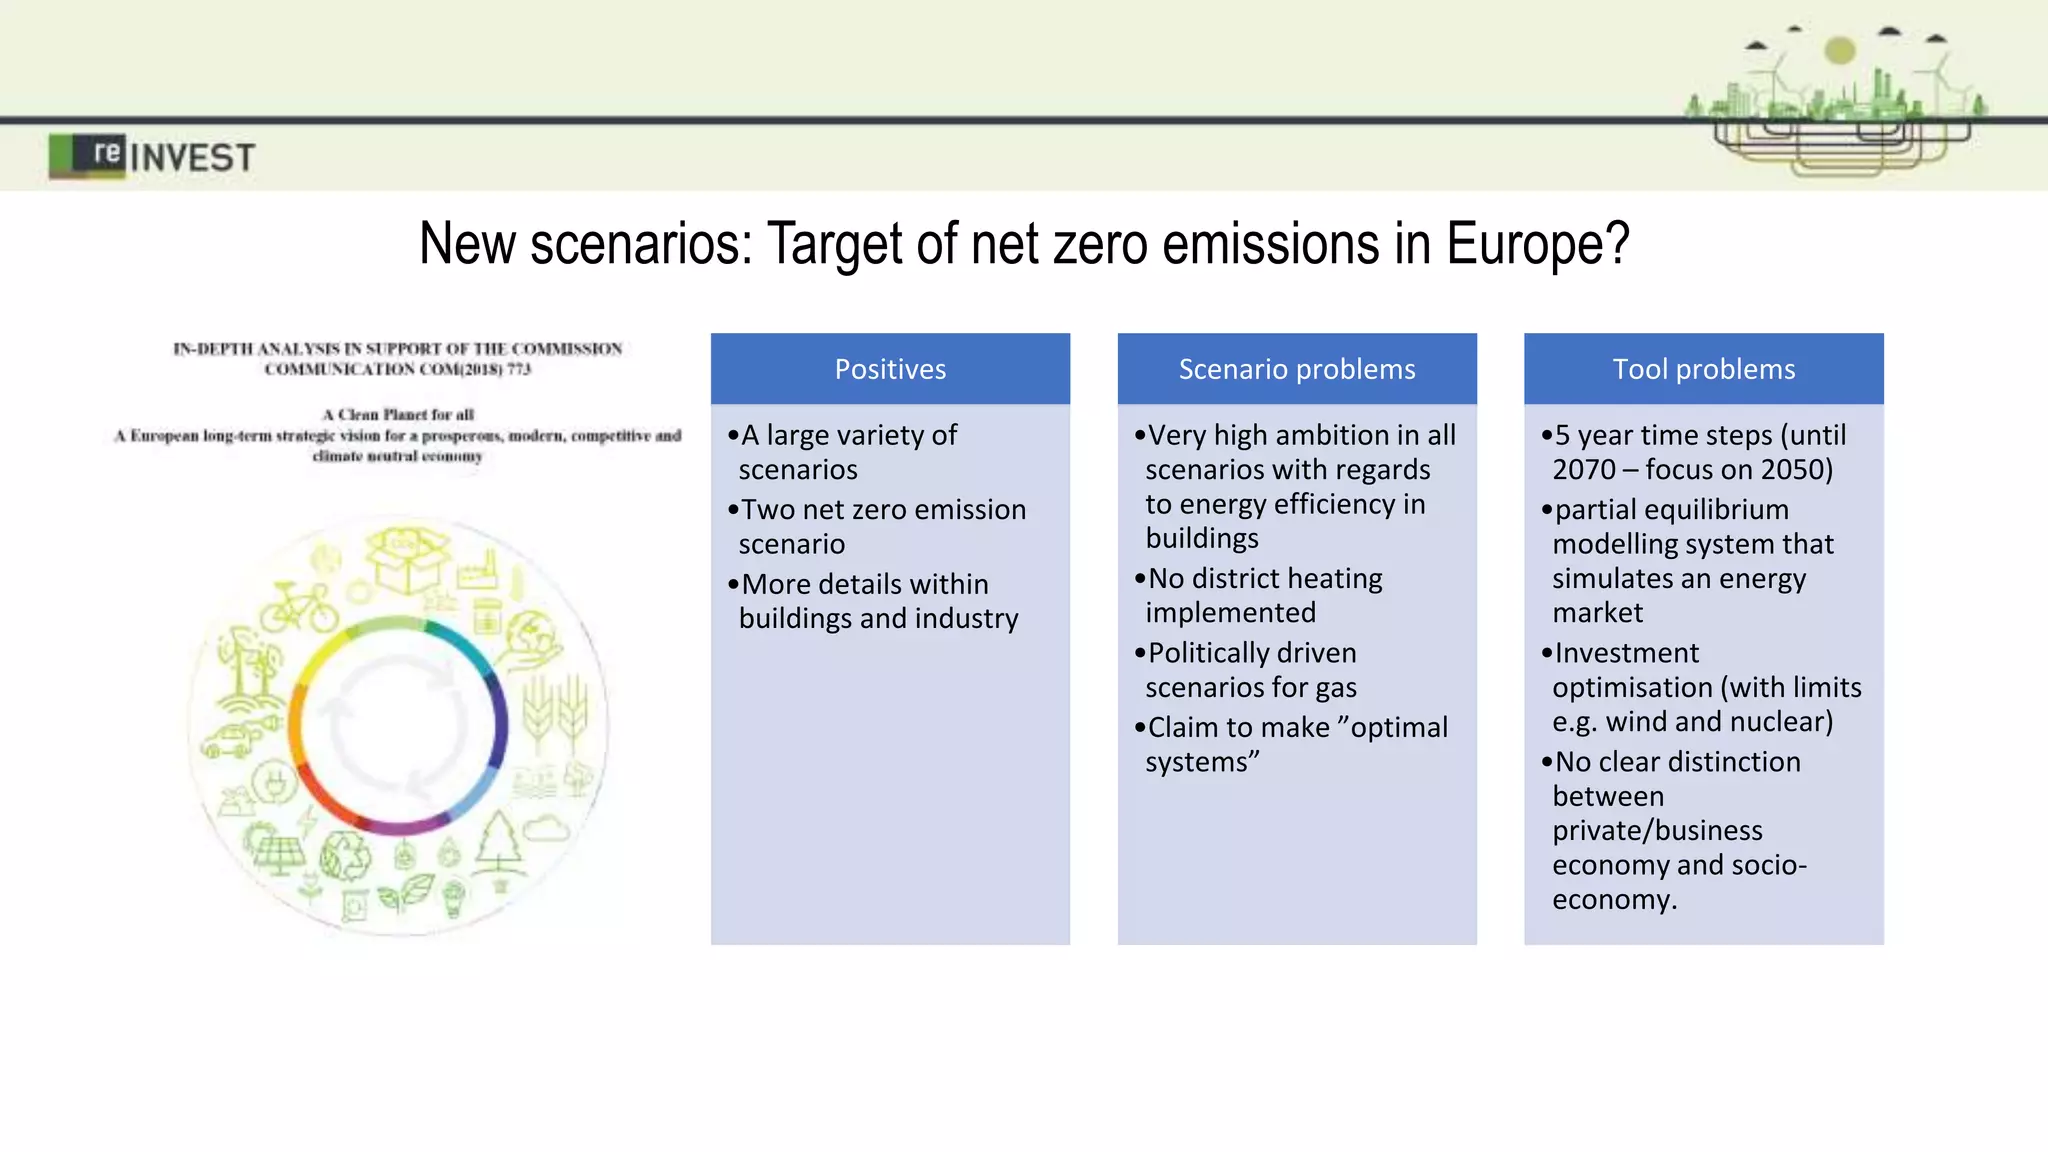
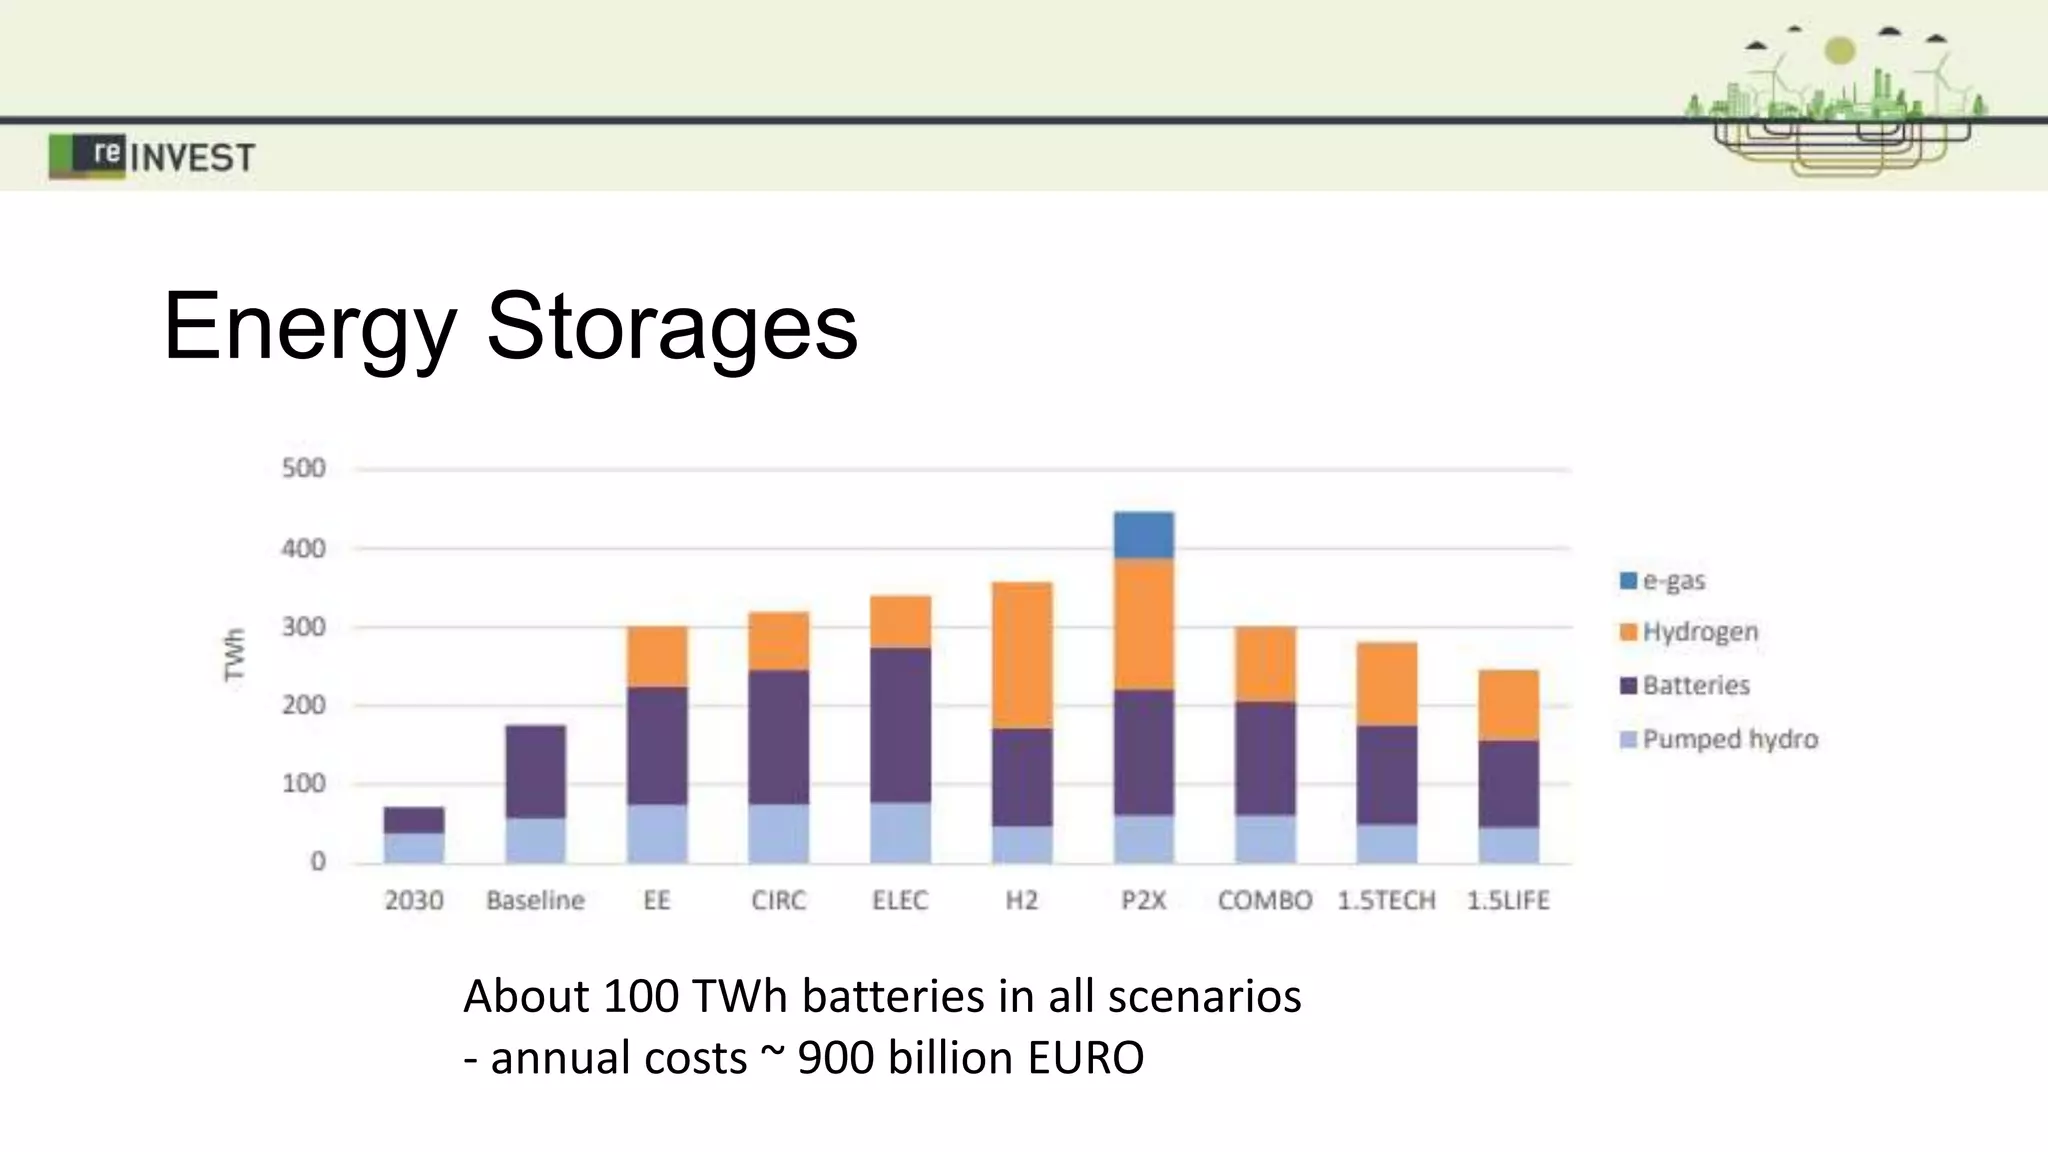
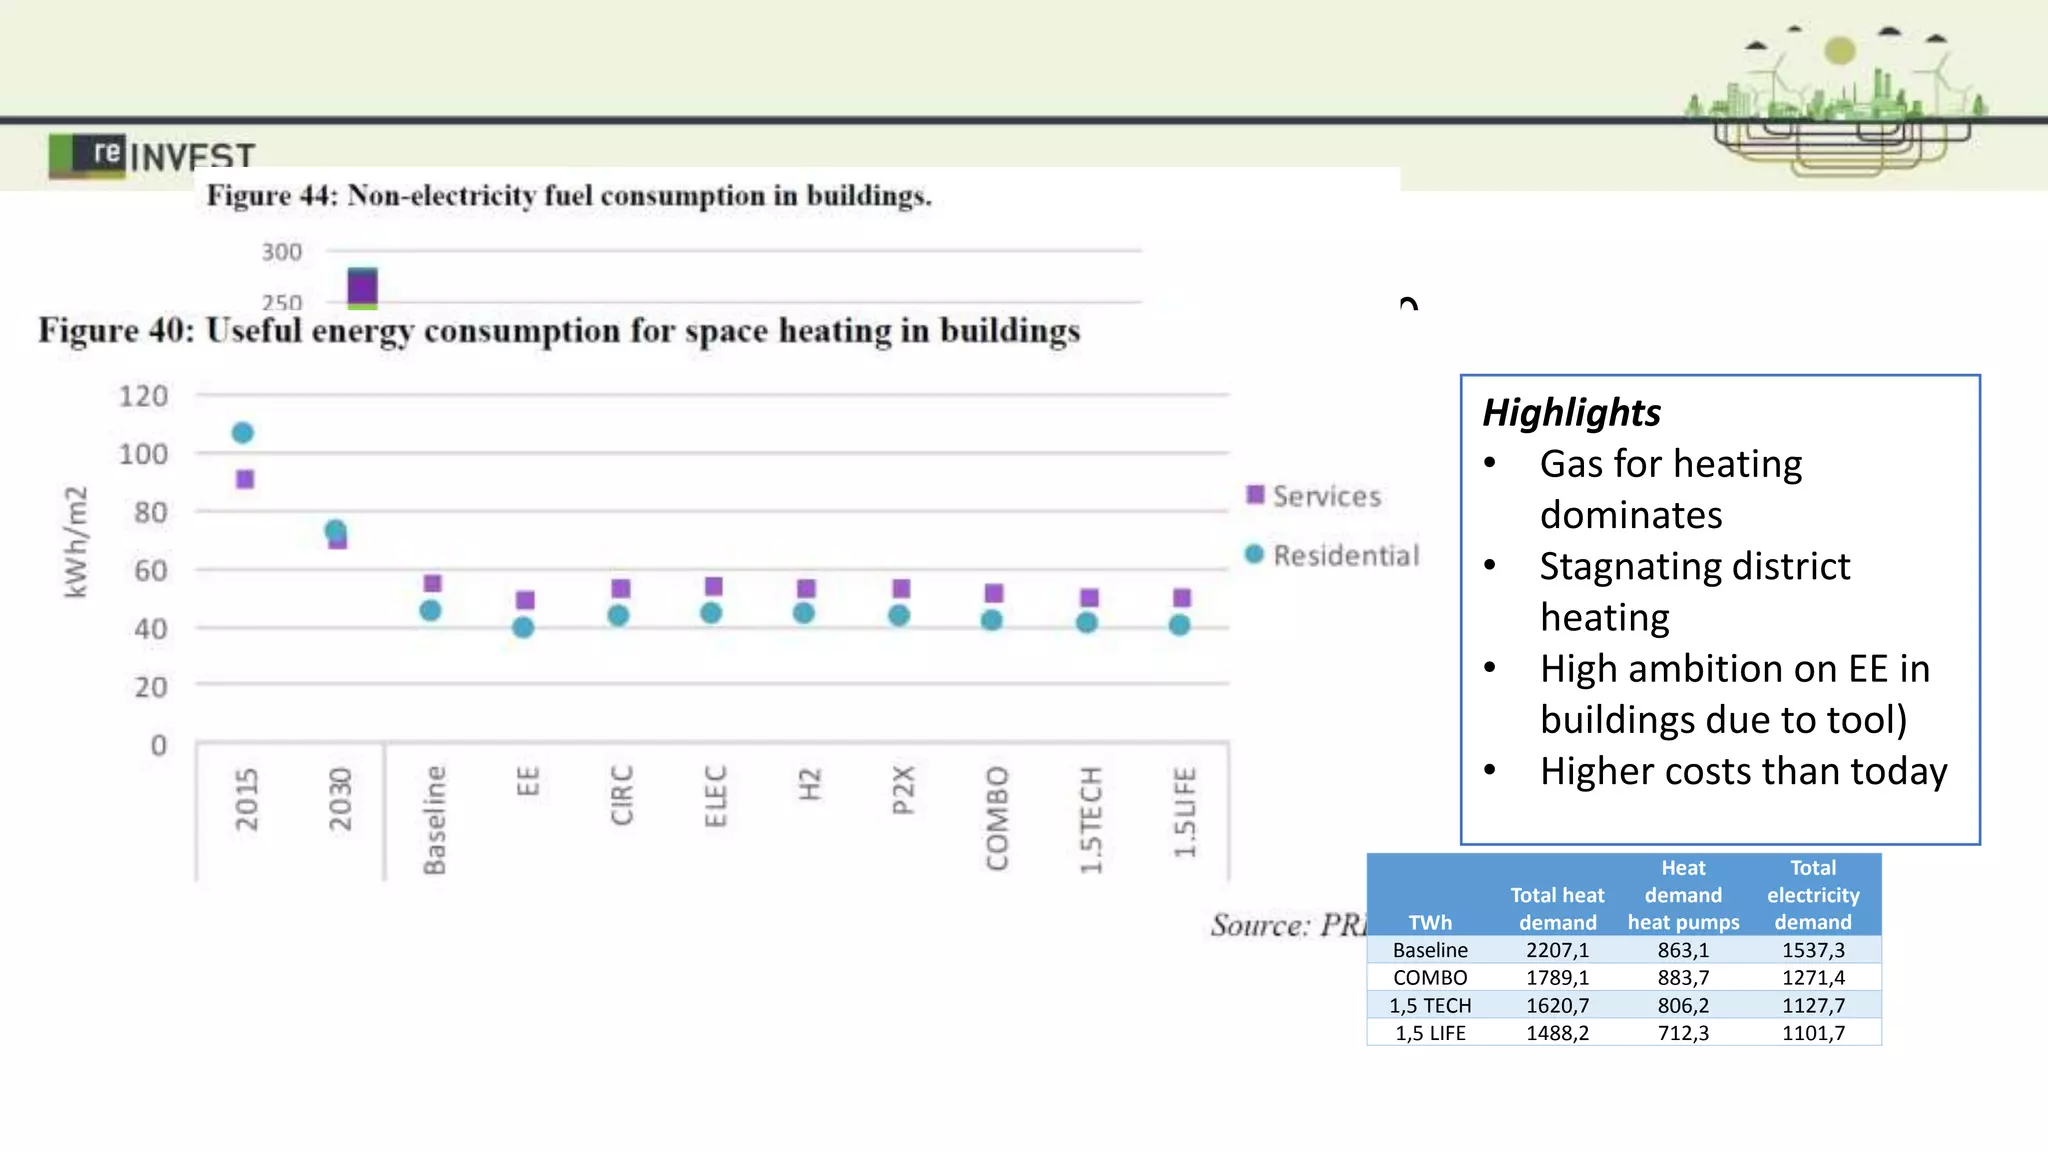
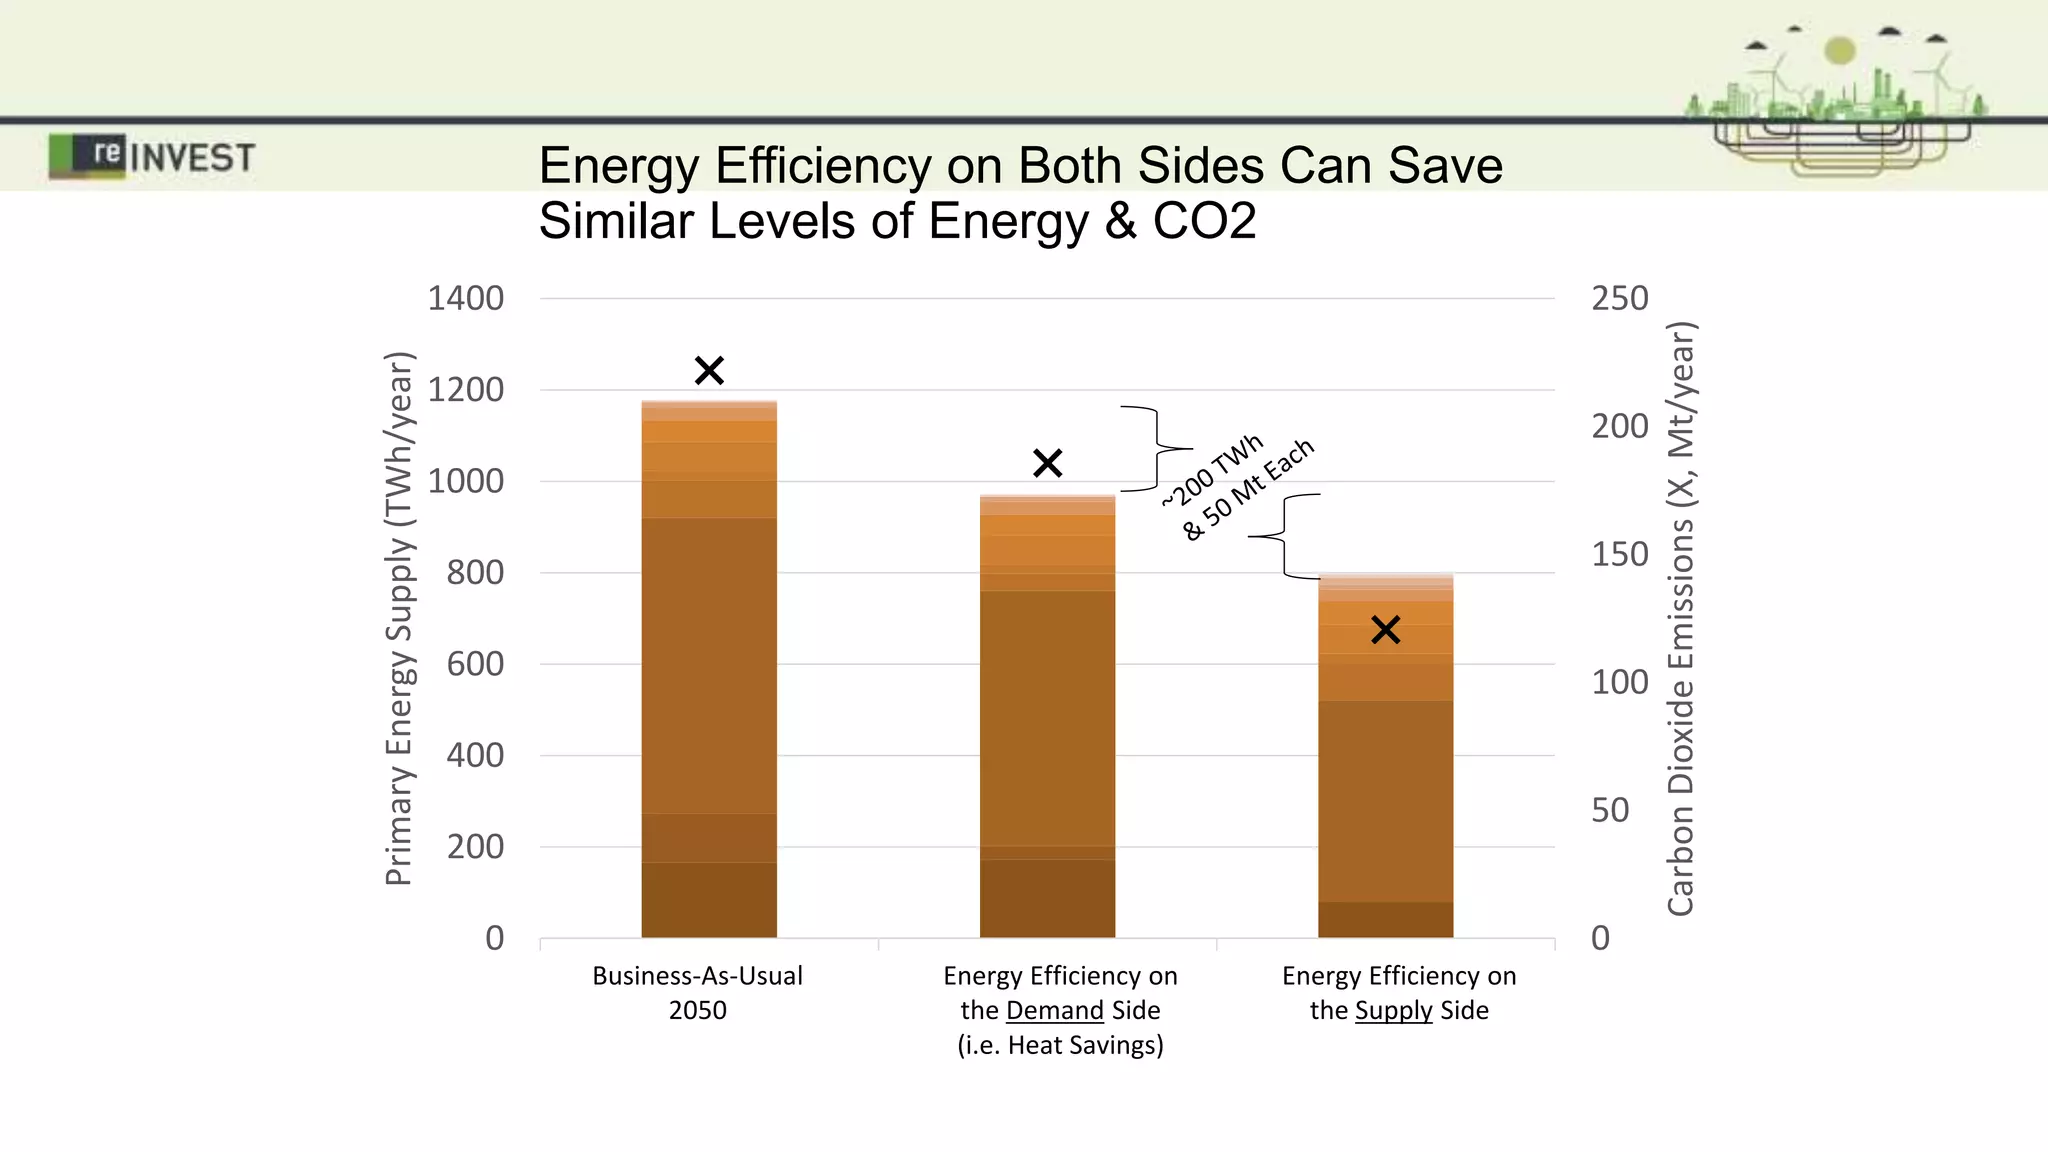
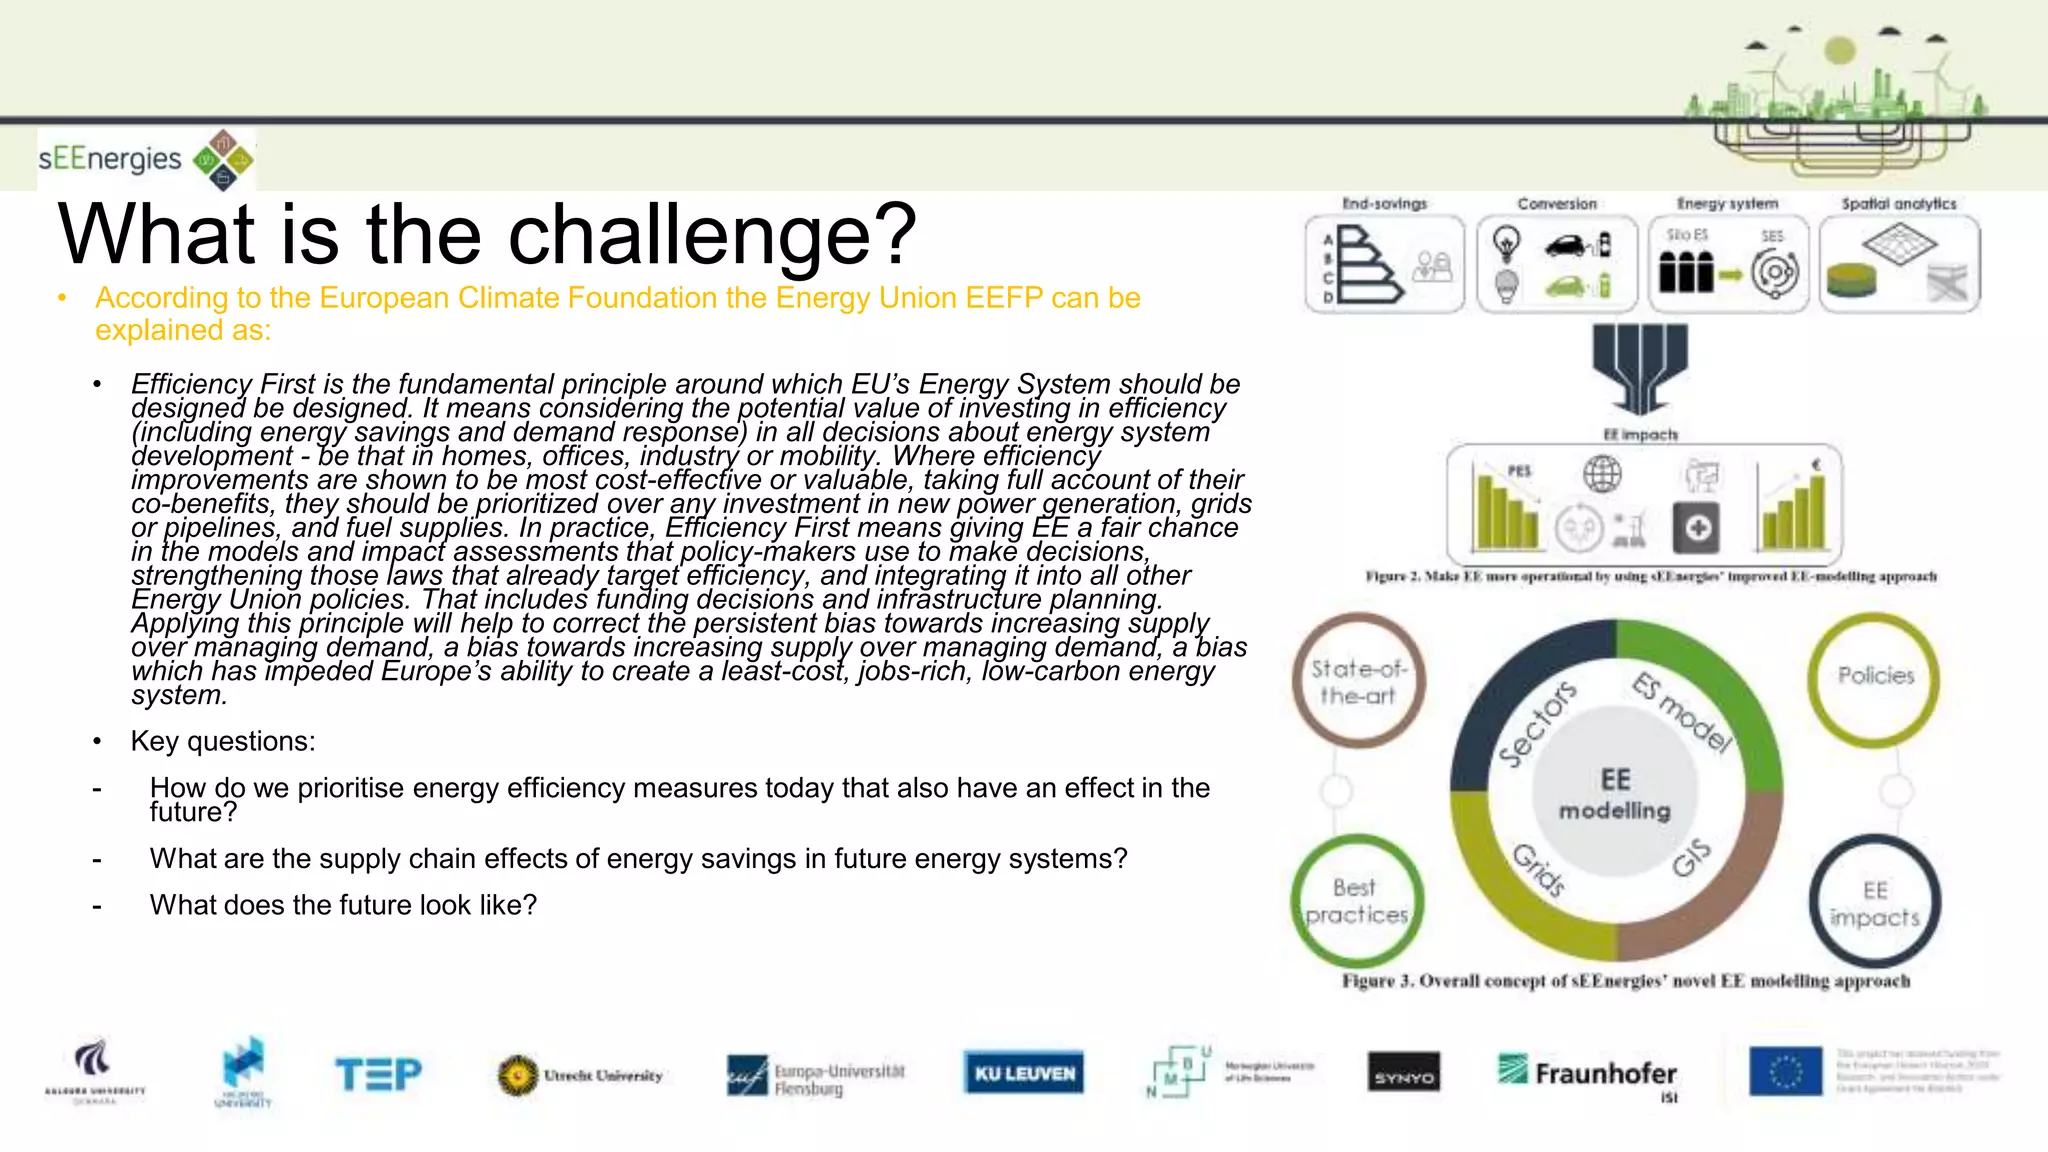
Keeping our cities sustainably warm - Inspiring the Efficient Renewal of District Heating
for the Just Transition
Brian Vad Mathiesen, Aalborg University
November 12 2020, Brussels - Online
@BrianVad
KEYNOTE: ROADM AP FOR NET ZERO EM ISSIONS WITH KNOWN TECHNOLOGIES
Positives
•A large variety of
scenarios
•Two net zero emission
scenario
•More details within
buildings and industry
Scenario problems
•Very high ambition in all
scenarios with regards
to energy efficiency in
buildings
•No district heating
implemented
•Politically driven
scenarios for gas
•Claim to make ”optimal
systems”
Tool problems
•5 year time steps (until
2070 – focus on 2050)
•partial equilibrium
modelling system that
simulates an energy
market
•Investment
optimisation (with limits
e.g. wind and nuclear)
•No clear distinction
between
private/business
economy and socio-
economy.
New scenarios: Target of net zero emissions in Europe?
Energy Storages
About 100 TWh batteries in all scenarios
- annual costs ~ 900 billion EURO
Buildings in the Energy Union in 2050
Highlights
• Gas for heating
dominates
• Stagnating district
heating
• High ambition on EE in
buildings due to tool)
• Higher costs than today
TWh
Total heat
demand
Heat
demand
heat pumps
Total
electricity
demand
Baseline 2207,1 863,1 1537,3
COMBO 1789,1 883,7 1271,4
1,5 TECH 1620,7 806,2 1127,7
1,5 LIFE 1488,2 712,3 1101,7
Total system costs
Solutions on the table
1. Interconnectors and trading (infrastructure
investments)
2. Flexible electricity demands and smart grids
(batteries and single string supply)
3. Integrated efficient Smart Energy Systems
A new path based on the baseline scenario
Other technology pathways using Smart
Energy Systems
- Balance of energy savings and energy
supply
- Use of electrofuels
- End use of gas
- Types of storages
- Can we manage without nuclear?
Scenario research targets and goals:
- Create more net zero emission
scenarios with lower cost and a
sustianable bioenergy use
- Create negative carbon and carbon
free options
Download rapport:
www.EnergyPLAN.eu/IDA
Smart Energy Systems
Unit Investment Costs for
Energy Storage
Electricity Thermal
€125/kWh
€300/kWh
€1/kWh
€90/kWh
1. Thermal Cheaper at All Scales
Unit Investment Costs for
Energy Storage
Electricity Thermal
€125/kWh
€300/kWh
€1/kWh
€90/kWh
1. Thermal Cheaper at All Scales
2. Bigger is
Better i.e.
Cheaper
Pump Hydro Storage
175 €/kWh
(Source: Electricity Energy Storage
Technology Options: A White Paper
Primer on Applications, Costs, and
Benefits. Electric Power Research
Institute, 2010)
Natural Gas Underground Storage
0.05 €/kWh
(Source: Current State Of and Issues
Concerning Underground Natural Gas
Storage. Federal Energy Regulatory
Commission, 2004)
Oil Tank
0.02 €/kWh
(Source: Dahl KH, Oil tanking
Copenhagen A/S, 2013: Oil Storage
Tank. 2013)
Thermal Storage
1-4 €/kWh
(Source: Danish Technology
Catalogue, 2012)
Heating vs. other sectors
Heating and cooling demand in 2015 in the EU28 by end-use
compared to total final energy demand
- Large share for All Member States (not just the ‘cold’ North)
- Overall cooling share in general is 10-15% Heating and cooling demand in 2015 in the EU28 by end-use
compared to total final energy demand
Three focus areas for buildings
STOP B EFORE
PA SSIVE
H OU SE
STAN DARDS
HRE Methodology
Data and mapping Energy System analyses
Heat Roadmaps for transitions
• Decarbonise in line with Paris Agreement
• Technically possible, socio-economically
feasible
• Consider local nature of heating and cooling
• Consider the wider energy system
• Heating is the largest end-use demand
• District heating increases energy efficiency and
access to supply sources
• Smart energy systems and
sector coupling
Everywhere
Deep energy
savings
Combine savings
and supply
~30-50% demand
reduction
Urban
areas
District energy
networks
High demand
density areas
Supply ~half of
energy demand
Rural areas
Mainly heat
pumps
Low demand
density areas
Remaining ~half
of the energy
demand
Case Study: Middlesbrough,
UK (350,000 People)
Heat Demand
Suitable for DH
10 PJ/Year
Excess Heat
35 PJ/Year
WP2: Pan-European Thermal Atlas: www.heatroadmap.eu
10 km
50% of the heat demand in
Europe can be supplied with
district heating
There is more excess heat in Europe than all of the heat demand in buildings
0
10
20
30
40
50
60
70
80
Primary Energy
Supply
Final
Consumption
End Use
EnergyBalancefortheEU27in2010(EJ)
Non-specified
Non-energy use
Transport
Electricity
Heat for Industry
Heat for Buildings
Energy Efficiency on Both Sides Can Save
Similar Levels of Energy & CO2
0
50
100
150
200
250
0
200
400
600
800
1000
1200
1400
BAU 2050 Step 1 Savings Heat Roadmap
CarbonDioxideEmissions(X,Mt/year)
PrimaryEnergySupply(TWh/year)
Italy
Business-As-Usual
2050
Energy Efficiency on
the Demand Side
(i.e. Heat Savings)
Energy Efficiency on
the Supply Side
Proven Technology!
Renewable Energy vs. District Heating
0%
10%
20%
30%
40%
50%
60%
70%
0% 20% 40% 60%
RenewableEnergyShareinHeating&
Cooling(%)
District Heating Share (%)
Austria
Belgium
Bulgaria
Croatia
Cyprus
Czech Republic
Denmark
Estonia
Finland
France
Germany
Greece
Hungary
Recomended district heating levels in Europe
0
20
40
60
80
100
AT BE CZ DE ES FI FR HU IT NL PL RO SE UK HRE
14
%ofheatdemandsuppliedby
DH
ꓕꓔ Interval of feasible DH share in HRE 2050 Baseline 2015
This project has received funding from the European
Union's Horizon 2020 research and innovation
programme under grant agreement No. 695989.
www.heatroadmap.eu
@HeatRoadmapEU
France: total
energy system
costs (M€/year)
Residential sector space heating savings (additional to
a 30% reduction already in the Baseline)
0 5% 10% 15% 20% 25%
Percentageofmarketshare
coveredbyDH
0% 175532 175582 175266 175452 175883 175978
5% 175219 175263 174932 175104 175529 175608
11% 174875 174898 174548 174699 175099 175162
18% 174566 174570 174197 174329 174706 174752
26% 174327 174317 173922 174037 174394 174418
34% 174197 174168 173752 173852 174191 174200
42% 174190 174142 173709 173789 174107 174101
51% 174400 174334 173878 173940 174240 174216
59% 175121 175038 174562 174604 174885 174844
68% 176559 176454 175961 175986 176246 176185
79% 185911 185790 185275 185282 185524 185443
Roadmap: heat sector investments towards 2050
0
20
40
60
80
B.EUR
District heating investments to implement the
HRE scenario in 2050
DH distribution new investments
DH production new investments
What is the challenge?
• Efficiency First is the fundamental principle around which EU’s Energy System should be
designed be designed. It means considering the potential value of investing in efficiency
(including energy savings and demand response) in all decisions about energy system
development - be that in homes, offices, industry or mobility. Where efficiency
improvements are shown to be most cost-effective or valuable, taking full account of their
co-benefits, they should be prioritized over any investment in new power generation, grids
or pipelines, and fuel supplies. In practice, Efficiency First means giving EE a fair chance
in the models and impact assessments that policy-makers use to make decisions,
strengthening those laws that already target efficiency, and integrating it into all other
Energy Union policies. That includes funding decisions and infrastructure planning.
Applying this principle will help to correct the persistent bias towards increasing supply
over managing demand, a bias towards increasing supply over managing demand, a bias
which has impeded Europe’s ability to create a least-cost, jobs-rich, low-carbon energy
system.
• Key questions:
- How do we prioritise energy efficiency measures today that also have an effect in the
future?
- What are the supply chain effects of energy savings in future energy systems?
- What does the future look like?
sEEnergies 24
• According to the European Climate Foundation the Energy Union EEFP can be
explained as:
Thank you for your attention – Questions?
Follow me on twitter and LinkedIN
Roadmap for achieving the 70% 2030 greenhouse gas emission reduction target in Denmark
- Keynote, INTERNATIONAL CONFERENCE ON GREEN DIGITALIZATION
Brian Vad Mathiesen, Aalborg University
Kolding/Online, November 11th 2020
www.EnergyPLAN.eu
www.4DH.eu
www.energyplan.eu/smartenergysystems/
www.brianvad.eu
www.energyplan.eu/solar
https://ida.dk/om-ida/temaer/klimasvar
www.heatroadmap.eu
www.energyplan.eu/SmartEnergyEurope
www.energyplan.eu/buildings

Keynote: ROADMAP FOR NET ZERO EMISSIONS WITH KNOWN TECHNOLOGIES

  • 1.
    Keeping our citiessustainably warm - Inspiring the Efficient Renewal of District Heating for the Just Transition Brian Vad Mathiesen, Aalborg University November 12 2020, Brussels - Online @BrianVad KEYNOTE: ROADM AP FOR NET ZERO EM ISSIONS WITH KNOWN TECHNOLOGIES
  • 2.
    Positives •A large varietyof scenarios •Two net zero emission scenario •More details within buildings and industry Scenario problems •Very high ambition in all scenarios with regards to energy efficiency in buildings •No district heating implemented •Politically driven scenarios for gas •Claim to make ”optimal systems” Tool problems •5 year time steps (until 2070 – focus on 2050) •partial equilibrium modelling system that simulates an energy market •Investment optimisation (with limits e.g. wind and nuclear) •No clear distinction between private/business economy and socio- economy. New scenarios: Target of net zero emissions in Europe?
  • 3.
    Energy Storages About 100TWh batteries in all scenarios - annual costs ~ 900 billion EURO
  • 4.
    Buildings in theEnergy Union in 2050 Highlights • Gas for heating dominates • Stagnating district heating • High ambition on EE in buildings due to tool) • Higher costs than today TWh Total heat demand Heat demand heat pumps Total electricity demand Baseline 2207,1 863,1 1537,3 COMBO 1789,1 883,7 1271,4 1,5 TECH 1620,7 806,2 1127,7 1,5 LIFE 1488,2 712,3 1101,7
  • 5.
  • 6.
    Solutions on thetable 1. Interconnectors and trading (infrastructure investments) 2. Flexible electricity demands and smart grids (batteries and single string supply) 3. Integrated efficient Smart Energy Systems
  • 7.
    A new pathbased on the baseline scenario Other technology pathways using Smart Energy Systems - Balance of energy savings and energy supply - Use of electrofuels - End use of gas - Types of storages - Can we manage without nuclear? Scenario research targets and goals: - Create more net zero emission scenarios with lower cost and a sustianable bioenergy use - Create negative carbon and carbon free options
  • 8.
  • 9.
    Unit Investment Costsfor Energy Storage Electricity Thermal €125/kWh €300/kWh €1/kWh €90/kWh 1. Thermal Cheaper at All Scales
  • 10.
    Unit Investment Costsfor Energy Storage Electricity Thermal €125/kWh €300/kWh €1/kWh €90/kWh 1. Thermal Cheaper at All Scales 2. Bigger is Better i.e. Cheaper
  • 11.
    Pump Hydro Storage 175€/kWh (Source: Electricity Energy Storage Technology Options: A White Paper Primer on Applications, Costs, and Benefits. Electric Power Research Institute, 2010) Natural Gas Underground Storage 0.05 €/kWh (Source: Current State Of and Issues Concerning Underground Natural Gas Storage. Federal Energy Regulatory Commission, 2004) Oil Tank 0.02 €/kWh (Source: Dahl KH, Oil tanking Copenhagen A/S, 2013: Oil Storage Tank. 2013) Thermal Storage 1-4 €/kWh (Source: Danish Technology Catalogue, 2012)
  • 12.
    Heating vs. othersectors Heating and cooling demand in 2015 in the EU28 by end-use compared to total final energy demand - Large share for All Member States (not just the ‘cold’ North) - Overall cooling share in general is 10-15% Heating and cooling demand in 2015 in the EU28 by end-use compared to total final energy demand
  • 13.
    Three focus areasfor buildings STOP B EFORE PA SSIVE H OU SE STAN DARDS
  • 14.
    HRE Methodology Data andmapping Energy System analyses
  • 15.
    Heat Roadmaps fortransitions • Decarbonise in line with Paris Agreement • Technically possible, socio-economically feasible • Consider local nature of heating and cooling • Consider the wider energy system • Heating is the largest end-use demand • District heating increases energy efficiency and access to supply sources • Smart energy systems and sector coupling Everywhere Deep energy savings Combine savings and supply ~30-50% demand reduction Urban areas District energy networks High demand density areas Supply ~half of energy demand Rural areas Mainly heat pumps Low demand density areas Remaining ~half of the energy demand
  • 16.
    Case Study: Middlesbrough, UK(350,000 People) Heat Demand Suitable for DH 10 PJ/Year Excess Heat 35 PJ/Year WP2: Pan-European Thermal Atlas: www.heatroadmap.eu 10 km
  • 17.
    50% of theheat demand in Europe can be supplied with district heating
  • 18.
    There is moreexcess heat in Europe than all of the heat demand in buildings 0 10 20 30 40 50 60 70 80 Primary Energy Supply Final Consumption End Use EnergyBalancefortheEU27in2010(EJ) Non-specified Non-energy use Transport Electricity Heat for Industry Heat for Buildings
  • 19.
    Energy Efficiency onBoth Sides Can Save Similar Levels of Energy & CO2 0 50 100 150 200 250 0 200 400 600 800 1000 1200 1400 BAU 2050 Step 1 Savings Heat Roadmap CarbonDioxideEmissions(X,Mt/year) PrimaryEnergySupply(TWh/year) Italy Business-As-Usual 2050 Energy Efficiency on the Demand Side (i.e. Heat Savings) Energy Efficiency on the Supply Side
  • 20.
    Energy Efficiency onBoth Sides Can Save Similar Levels of Energy & CO2 0 50 100 150 200 250 0 200 400 600 800 1000 1200 1400 BAU 2050 Step 1 Savings Heat Roadmap CarbonDioxideEmissions(X,Mt/year) PrimaryEnergySupply(TWh/year) Italy Business-As-Usual 2050 Energy Efficiency on the Demand Side (i.e. Heat Savings) Energy Efficiency on the Supply Side
  • 21.
    Proven Technology! Renewable Energyvs. District Heating 0% 10% 20% 30% 40% 50% 60% 70% 0% 20% 40% 60% RenewableEnergyShareinHeating& Cooling(%) District Heating Share (%) Austria Belgium Bulgaria Croatia Cyprus Czech Republic Denmark Estonia Finland France Germany Greece Hungary
  • 22.
    Recomended district heatinglevels in Europe 0 20 40 60 80 100 AT BE CZ DE ES FI FR HU IT NL PL RO SE UK HRE 14 %ofheatdemandsuppliedby DH ꓕꓔ Interval of feasible DH share in HRE 2050 Baseline 2015 This project has received funding from the European Union's Horizon 2020 research and innovation programme under grant agreement No. 695989. www.heatroadmap.eu @HeatRoadmapEU France: total energy system costs (M€/year) Residential sector space heating savings (additional to a 30% reduction already in the Baseline) 0 5% 10% 15% 20% 25% Percentageofmarketshare coveredbyDH 0% 175532 175582 175266 175452 175883 175978 5% 175219 175263 174932 175104 175529 175608 11% 174875 174898 174548 174699 175099 175162 18% 174566 174570 174197 174329 174706 174752 26% 174327 174317 173922 174037 174394 174418 34% 174197 174168 173752 173852 174191 174200 42% 174190 174142 173709 173789 174107 174101 51% 174400 174334 173878 173940 174240 174216 59% 175121 175038 174562 174604 174885 174844 68% 176559 176454 175961 175986 176246 176185 79% 185911 185790 185275 185282 185524 185443
  • 23.
    Roadmap: heat sectorinvestments towards 2050 0 20 40 60 80 B.EUR District heating investments to implement the HRE scenario in 2050 DH distribution new investments DH production new investments
  • 24.
    What is thechallenge? • Efficiency First is the fundamental principle around which EU’s Energy System should be designed be designed. It means considering the potential value of investing in efficiency (including energy savings and demand response) in all decisions about energy system development - be that in homes, offices, industry or mobility. Where efficiency improvements are shown to be most cost-effective or valuable, taking full account of their co-benefits, they should be prioritized over any investment in new power generation, grids or pipelines, and fuel supplies. In practice, Efficiency First means giving EE a fair chance in the models and impact assessments that policy-makers use to make decisions, strengthening those laws that already target efficiency, and integrating it into all other Energy Union policies. That includes funding decisions and infrastructure planning. Applying this principle will help to correct the persistent bias towards increasing supply over managing demand, a bias towards increasing supply over managing demand, a bias which has impeded Europe’s ability to create a least-cost, jobs-rich, low-carbon energy system. • Key questions: - How do we prioritise energy efficiency measures today that also have an effect in the future? - What are the supply chain effects of energy savings in future energy systems? - What does the future look like? sEEnergies 24 • According to the European Climate Foundation the Energy Union EEFP can be explained as:
  • 25.
    Thank you foryour attention – Questions? Follow me on twitter and LinkedIN Roadmap for achieving the 70% 2030 greenhouse gas emission reduction target in Denmark - Keynote, INTERNATIONAL CONFERENCE ON GREEN DIGITALIZATION Brian Vad Mathiesen, Aalborg University Kolding/Online, November 11th 2020 www.EnergyPLAN.eu www.4DH.eu www.energyplan.eu/smartenergysystems/ www.brianvad.eu www.energyplan.eu/solar https://ida.dk/om-ida/temaer/klimasvar www.heatroadmap.eu www.energyplan.eu/SmartEnergyEurope www.energyplan.eu/buildings

Editor's Notes

  • #2 From a group with 28 members. I coordinate research. Many areas. Other pople than Engineers..
  • #7 The wind and sun is there at the same time Trading is only relevant if there are differences Trading should be among “unequals” Savings are important
  • #9 Bioenergy - low
  • #13 Major black box is heating. https://ec.europa.eu/energy/en/topics/imports-and-secure-supplies The EU imports 54% of all the energy it consumes, at a cost of more than €1 billion per day. Energy also makes up more than 20% of total EU imports. Specifically, the EU imports: 90% of its crude oil 69% of its natural gas 42% of its coal and other solid fuels 40% of its uranium and other nuclear fuels.
  • #15 This represents
  • #17 Going to a more local scale – Peta can be used. Areas for district heating based on heat density.