Download as PDF, PPTX
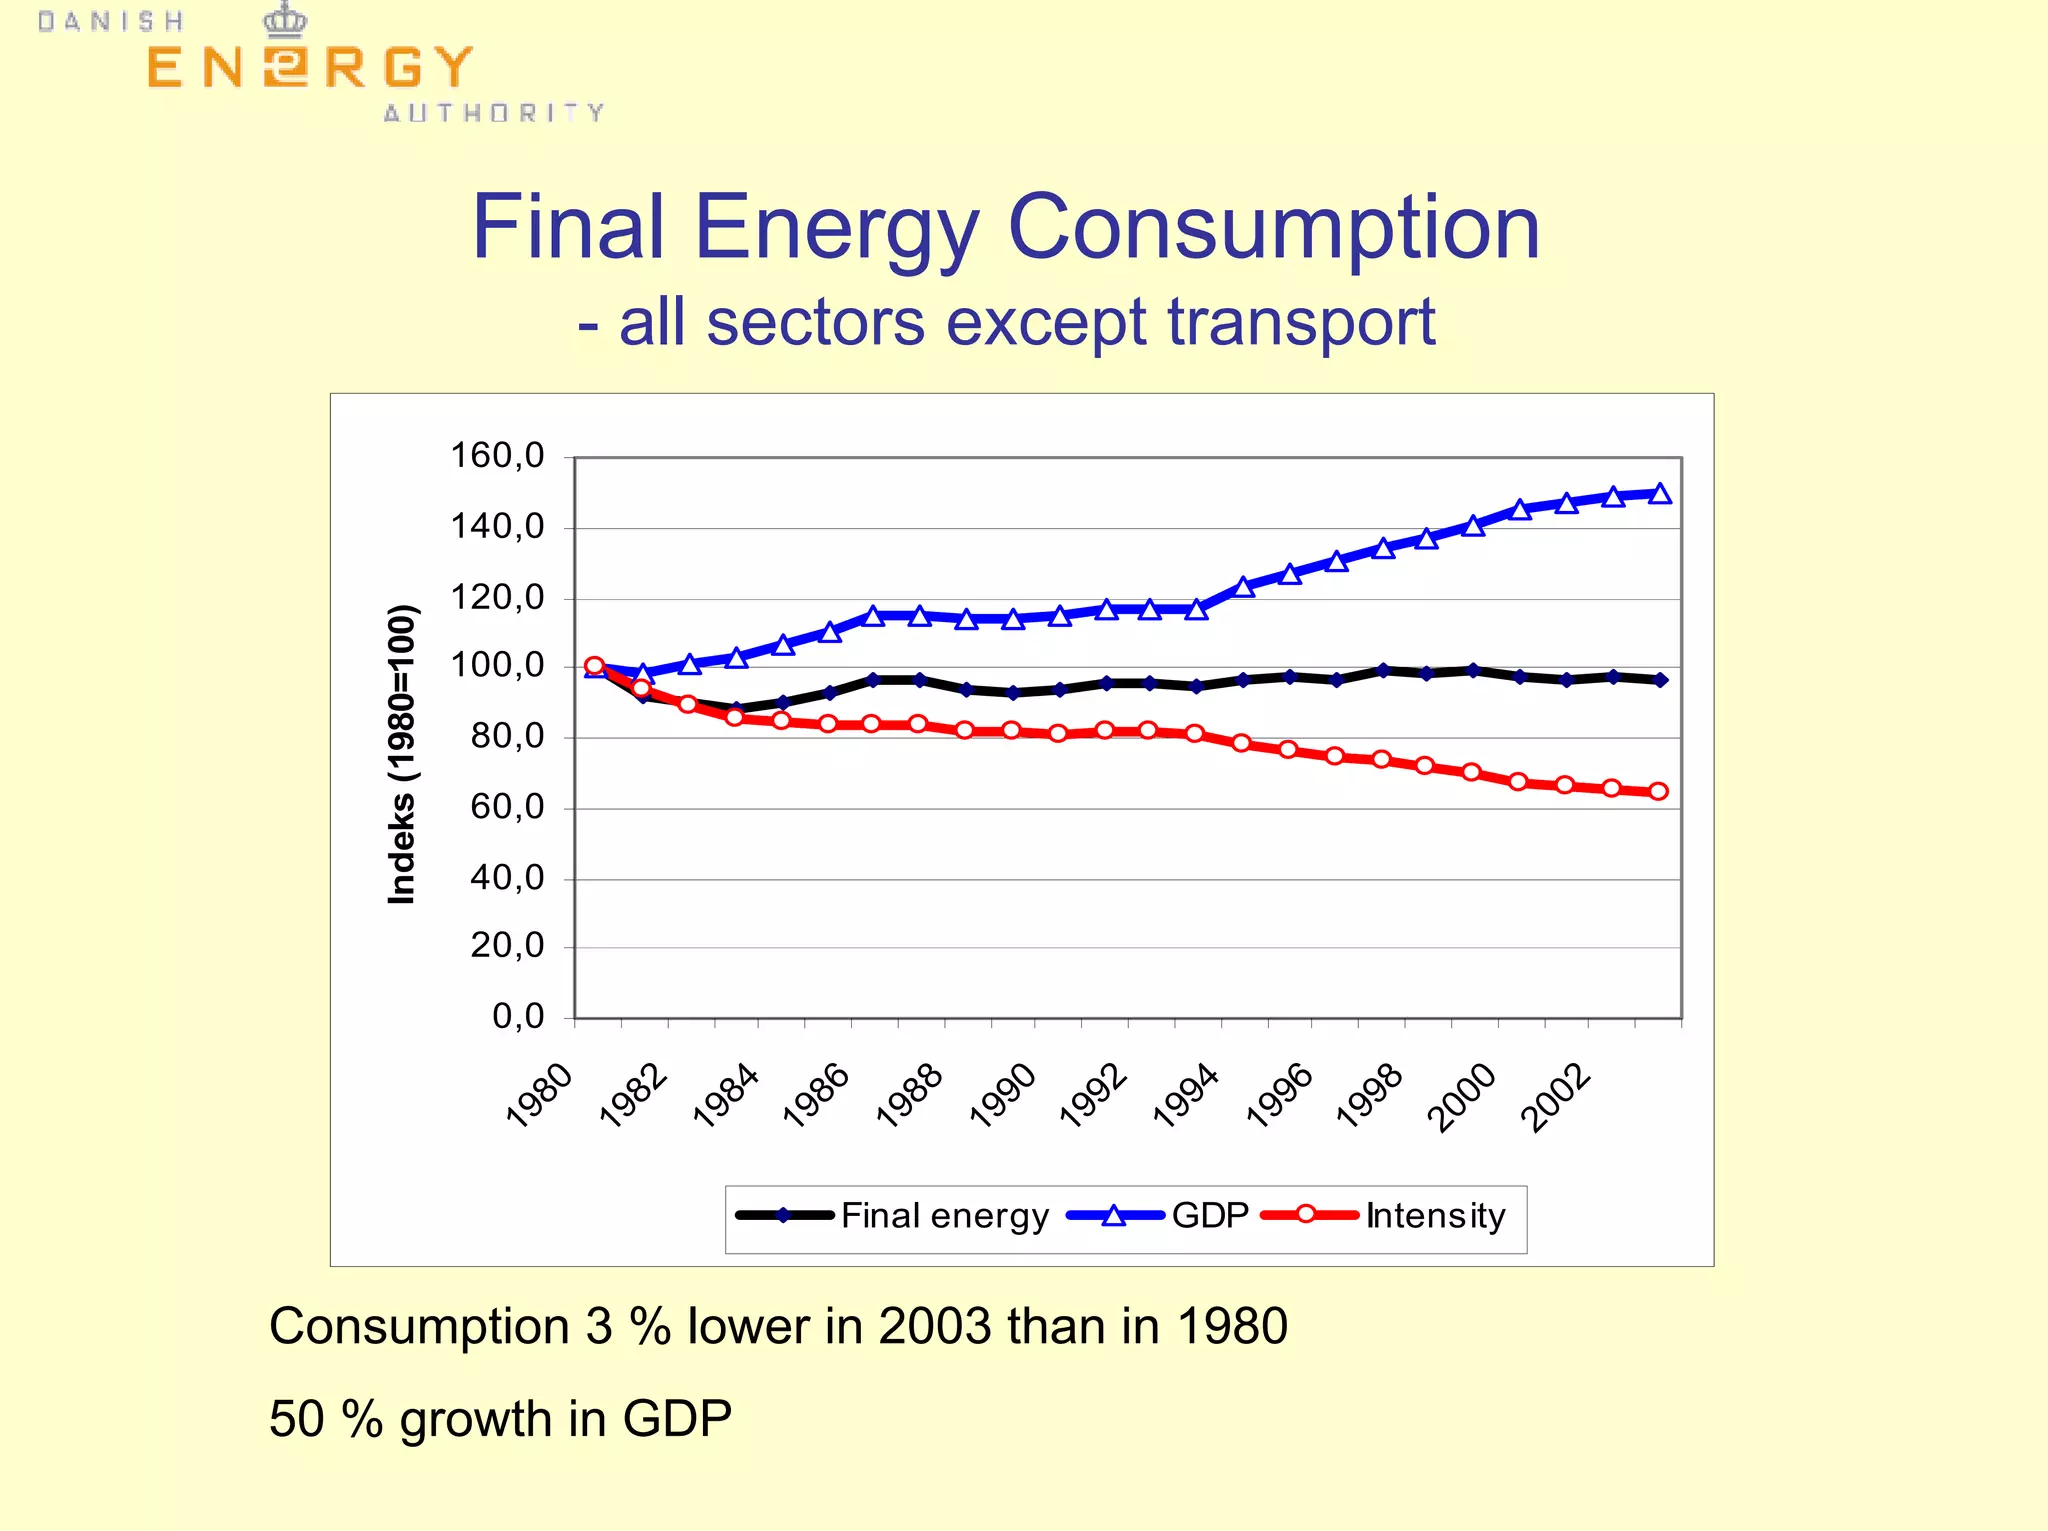
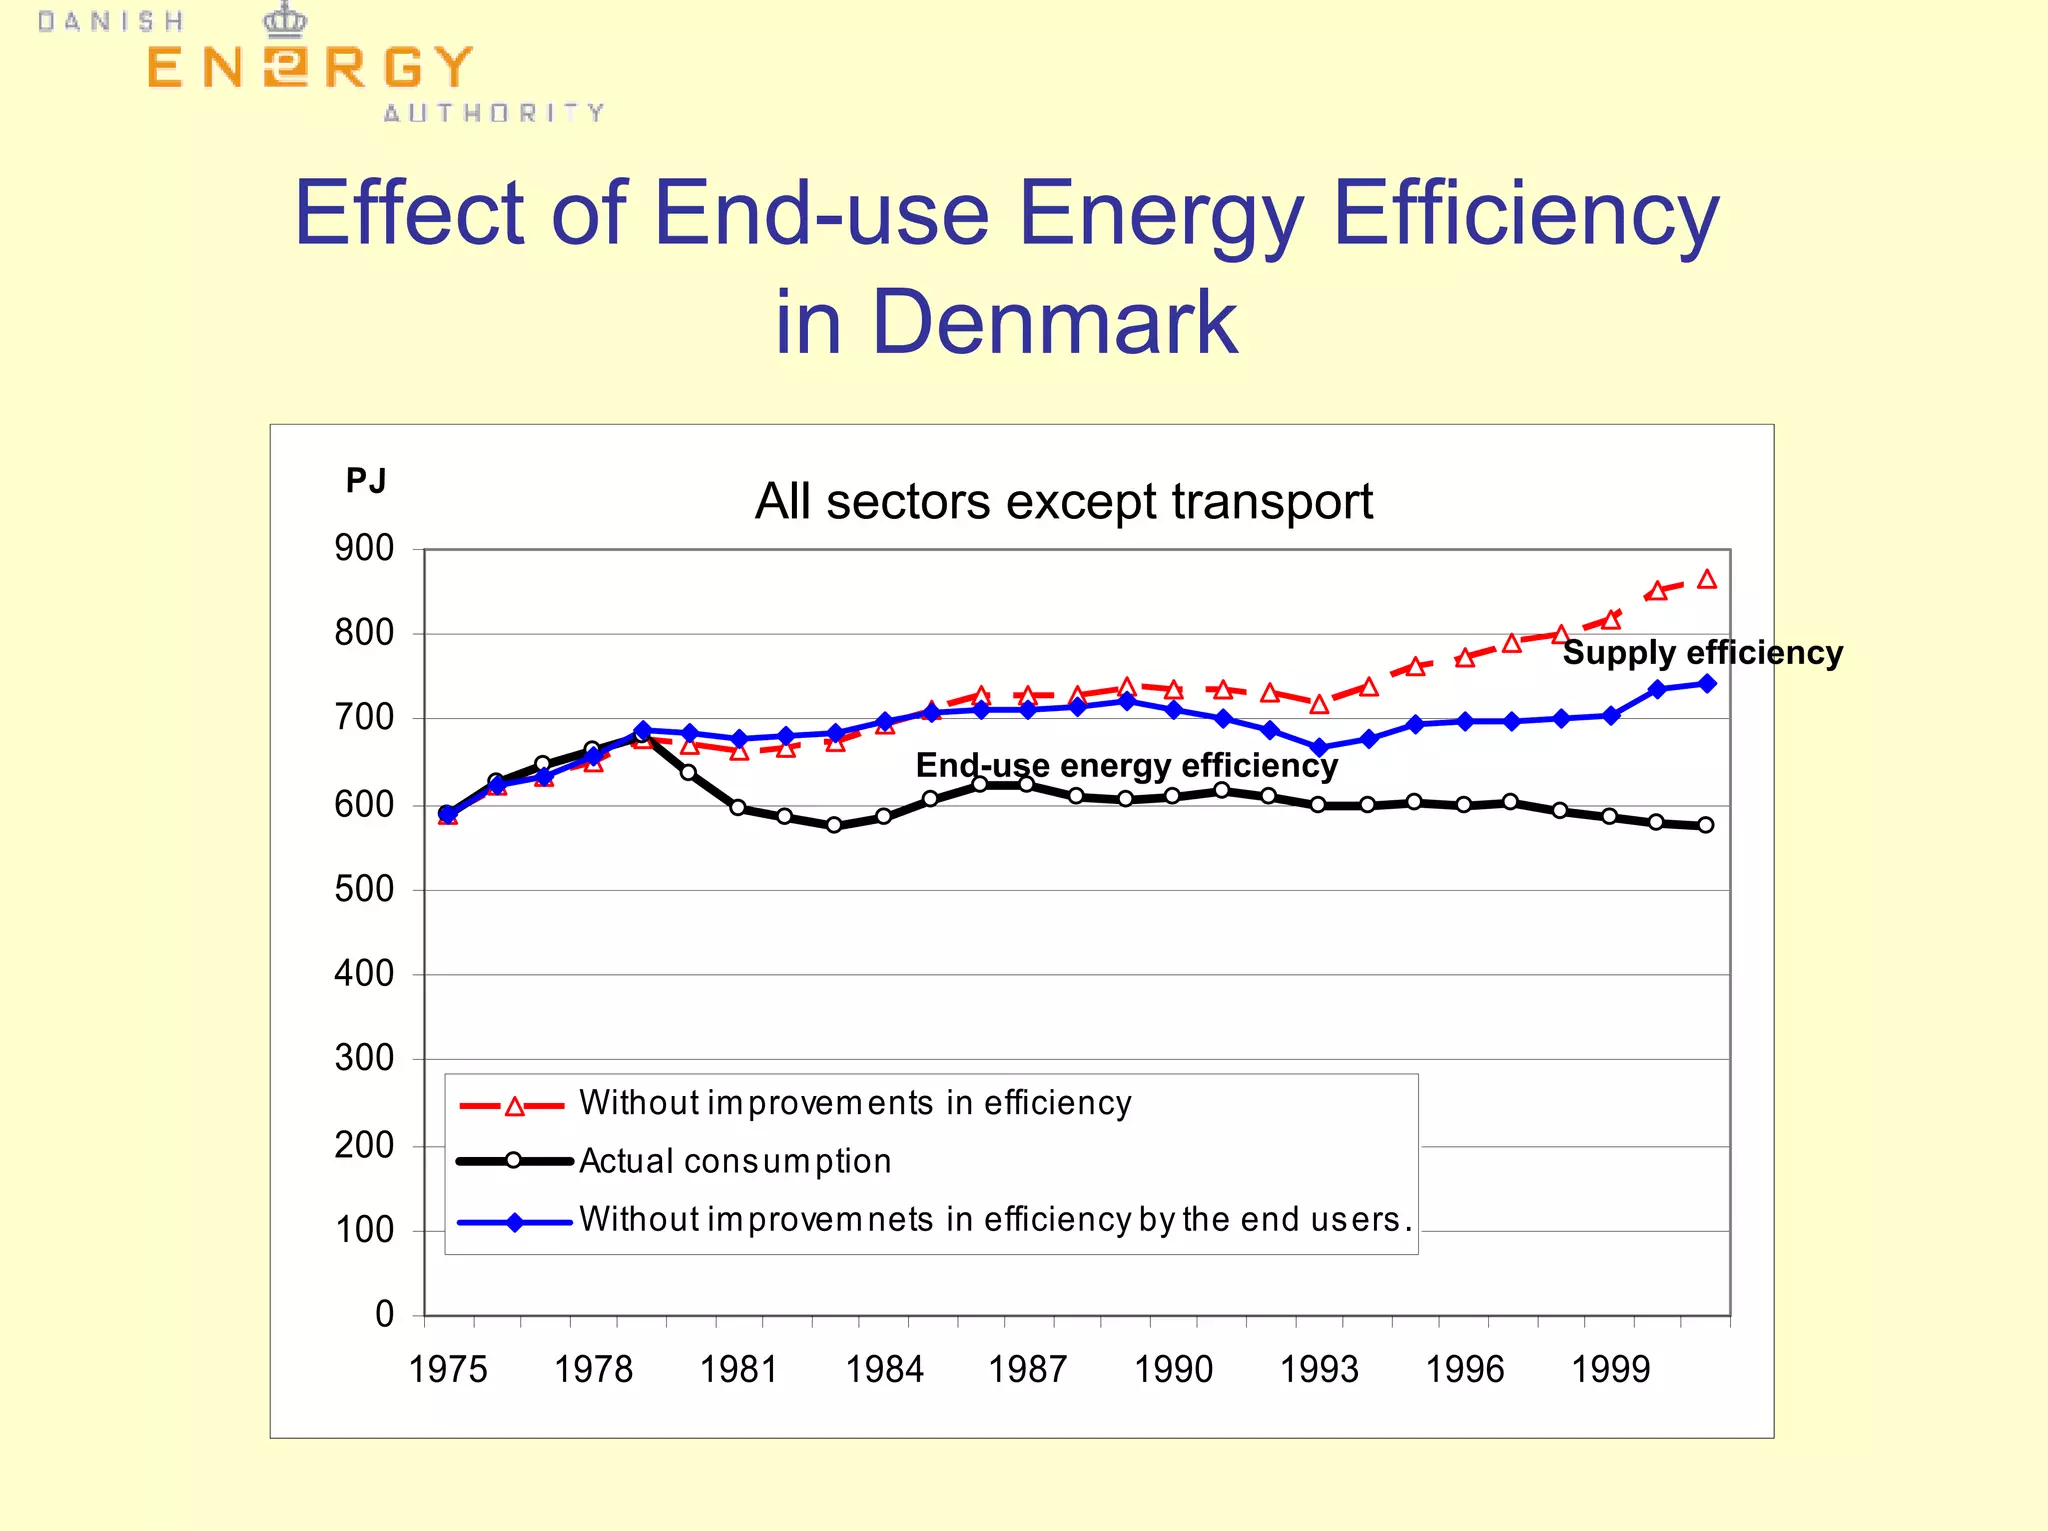
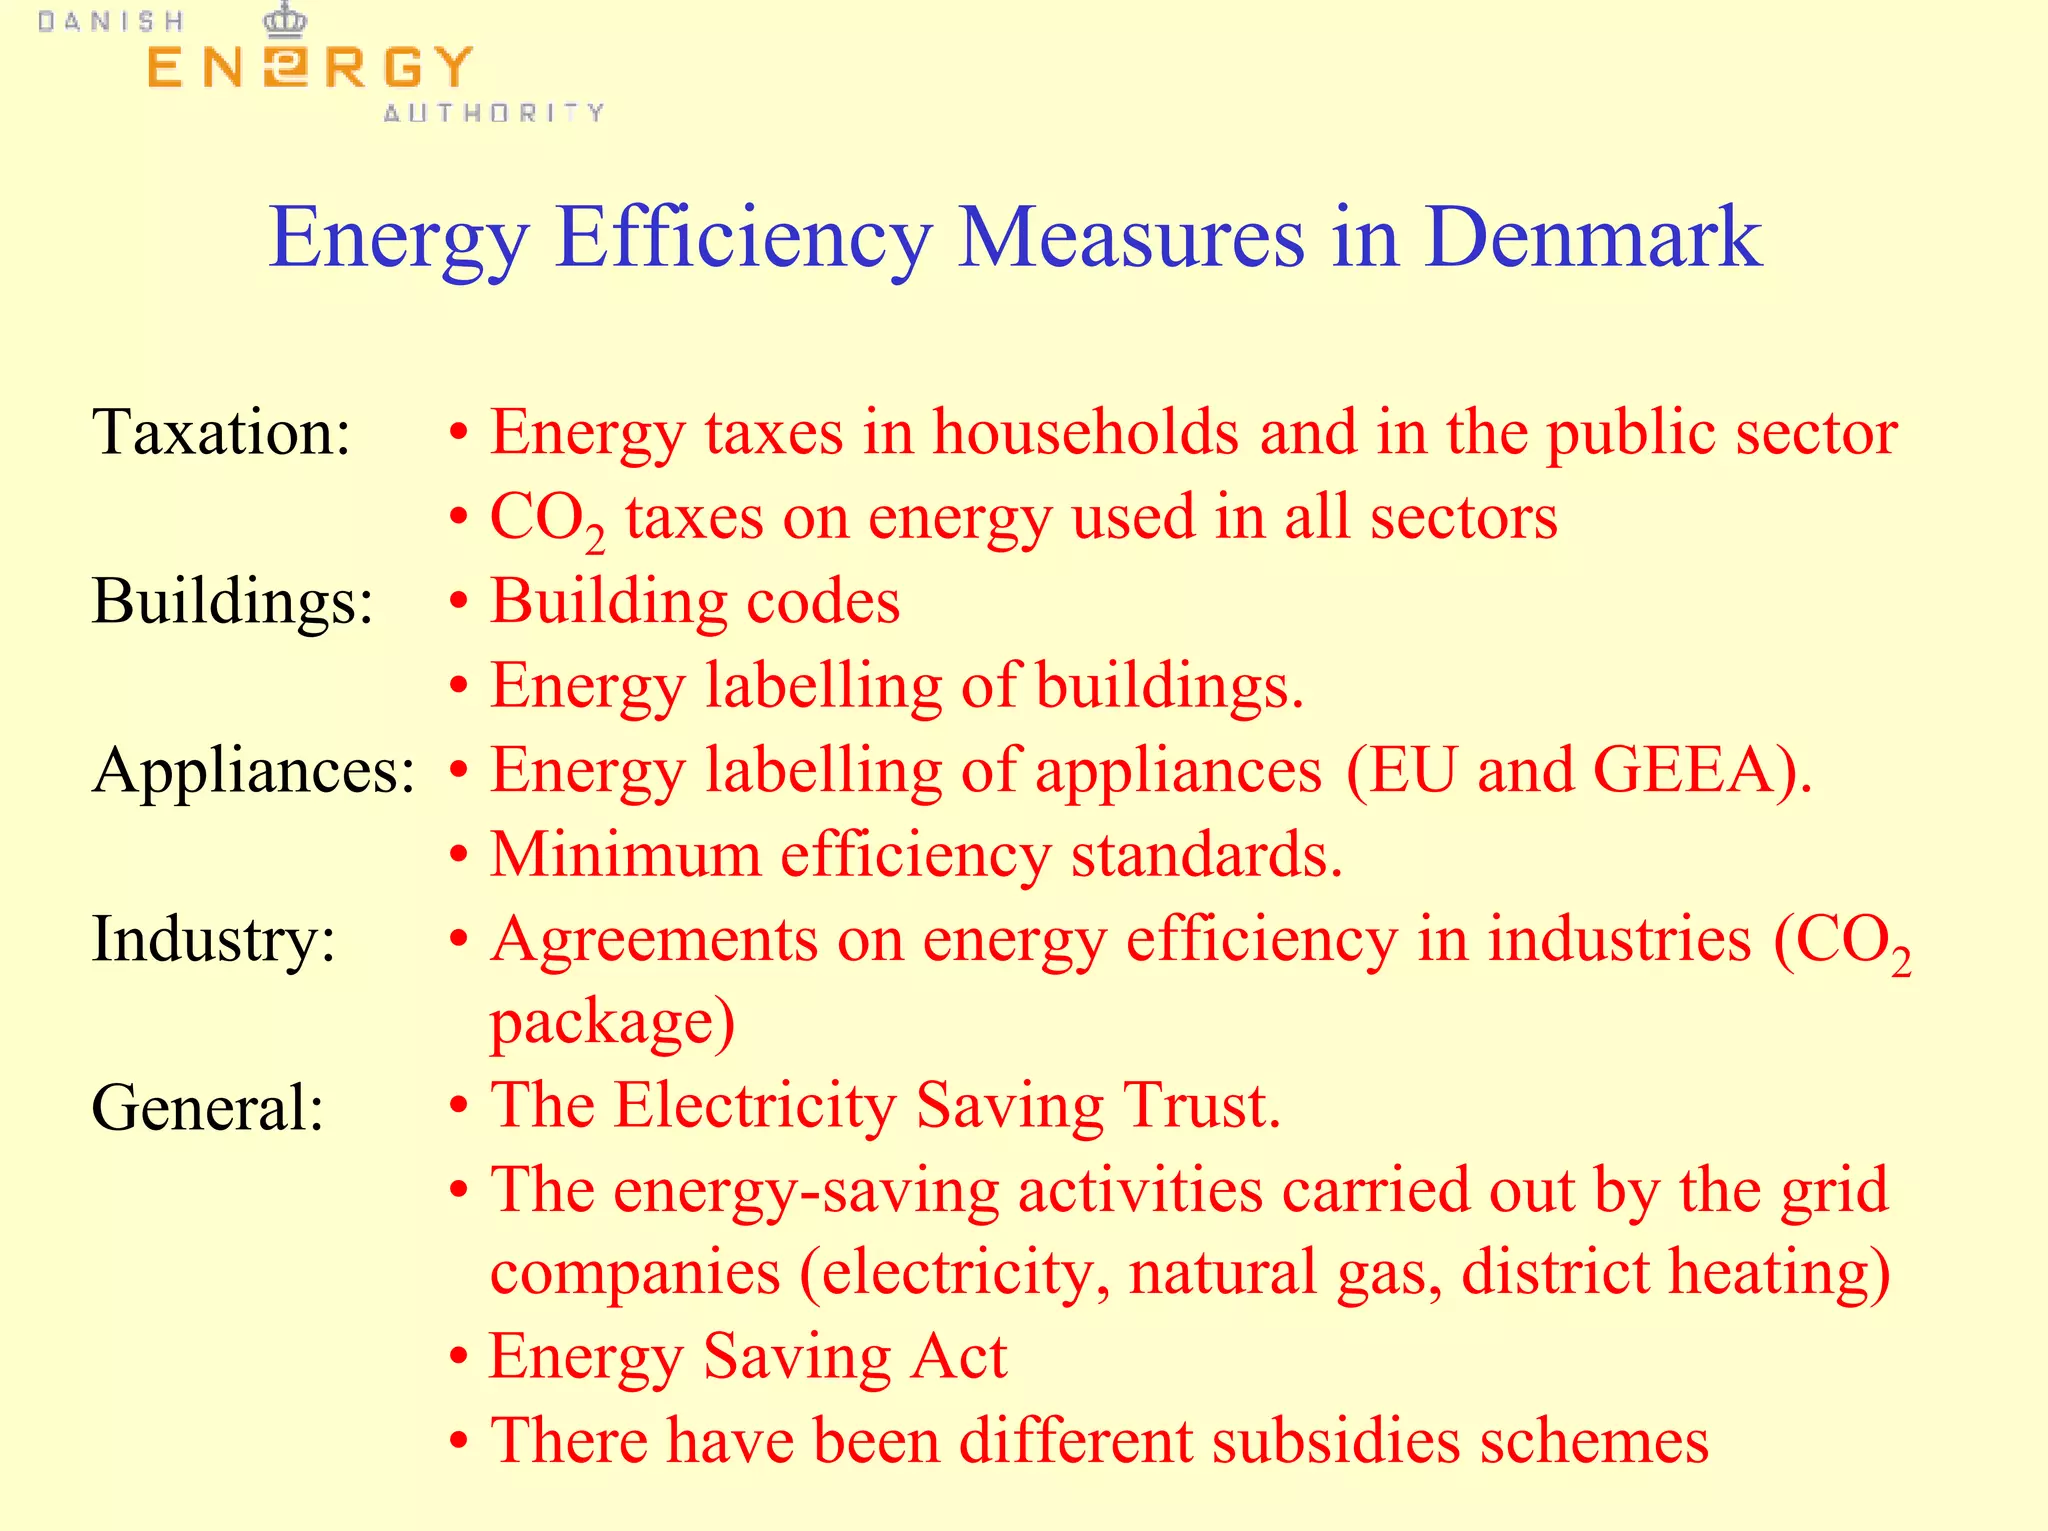
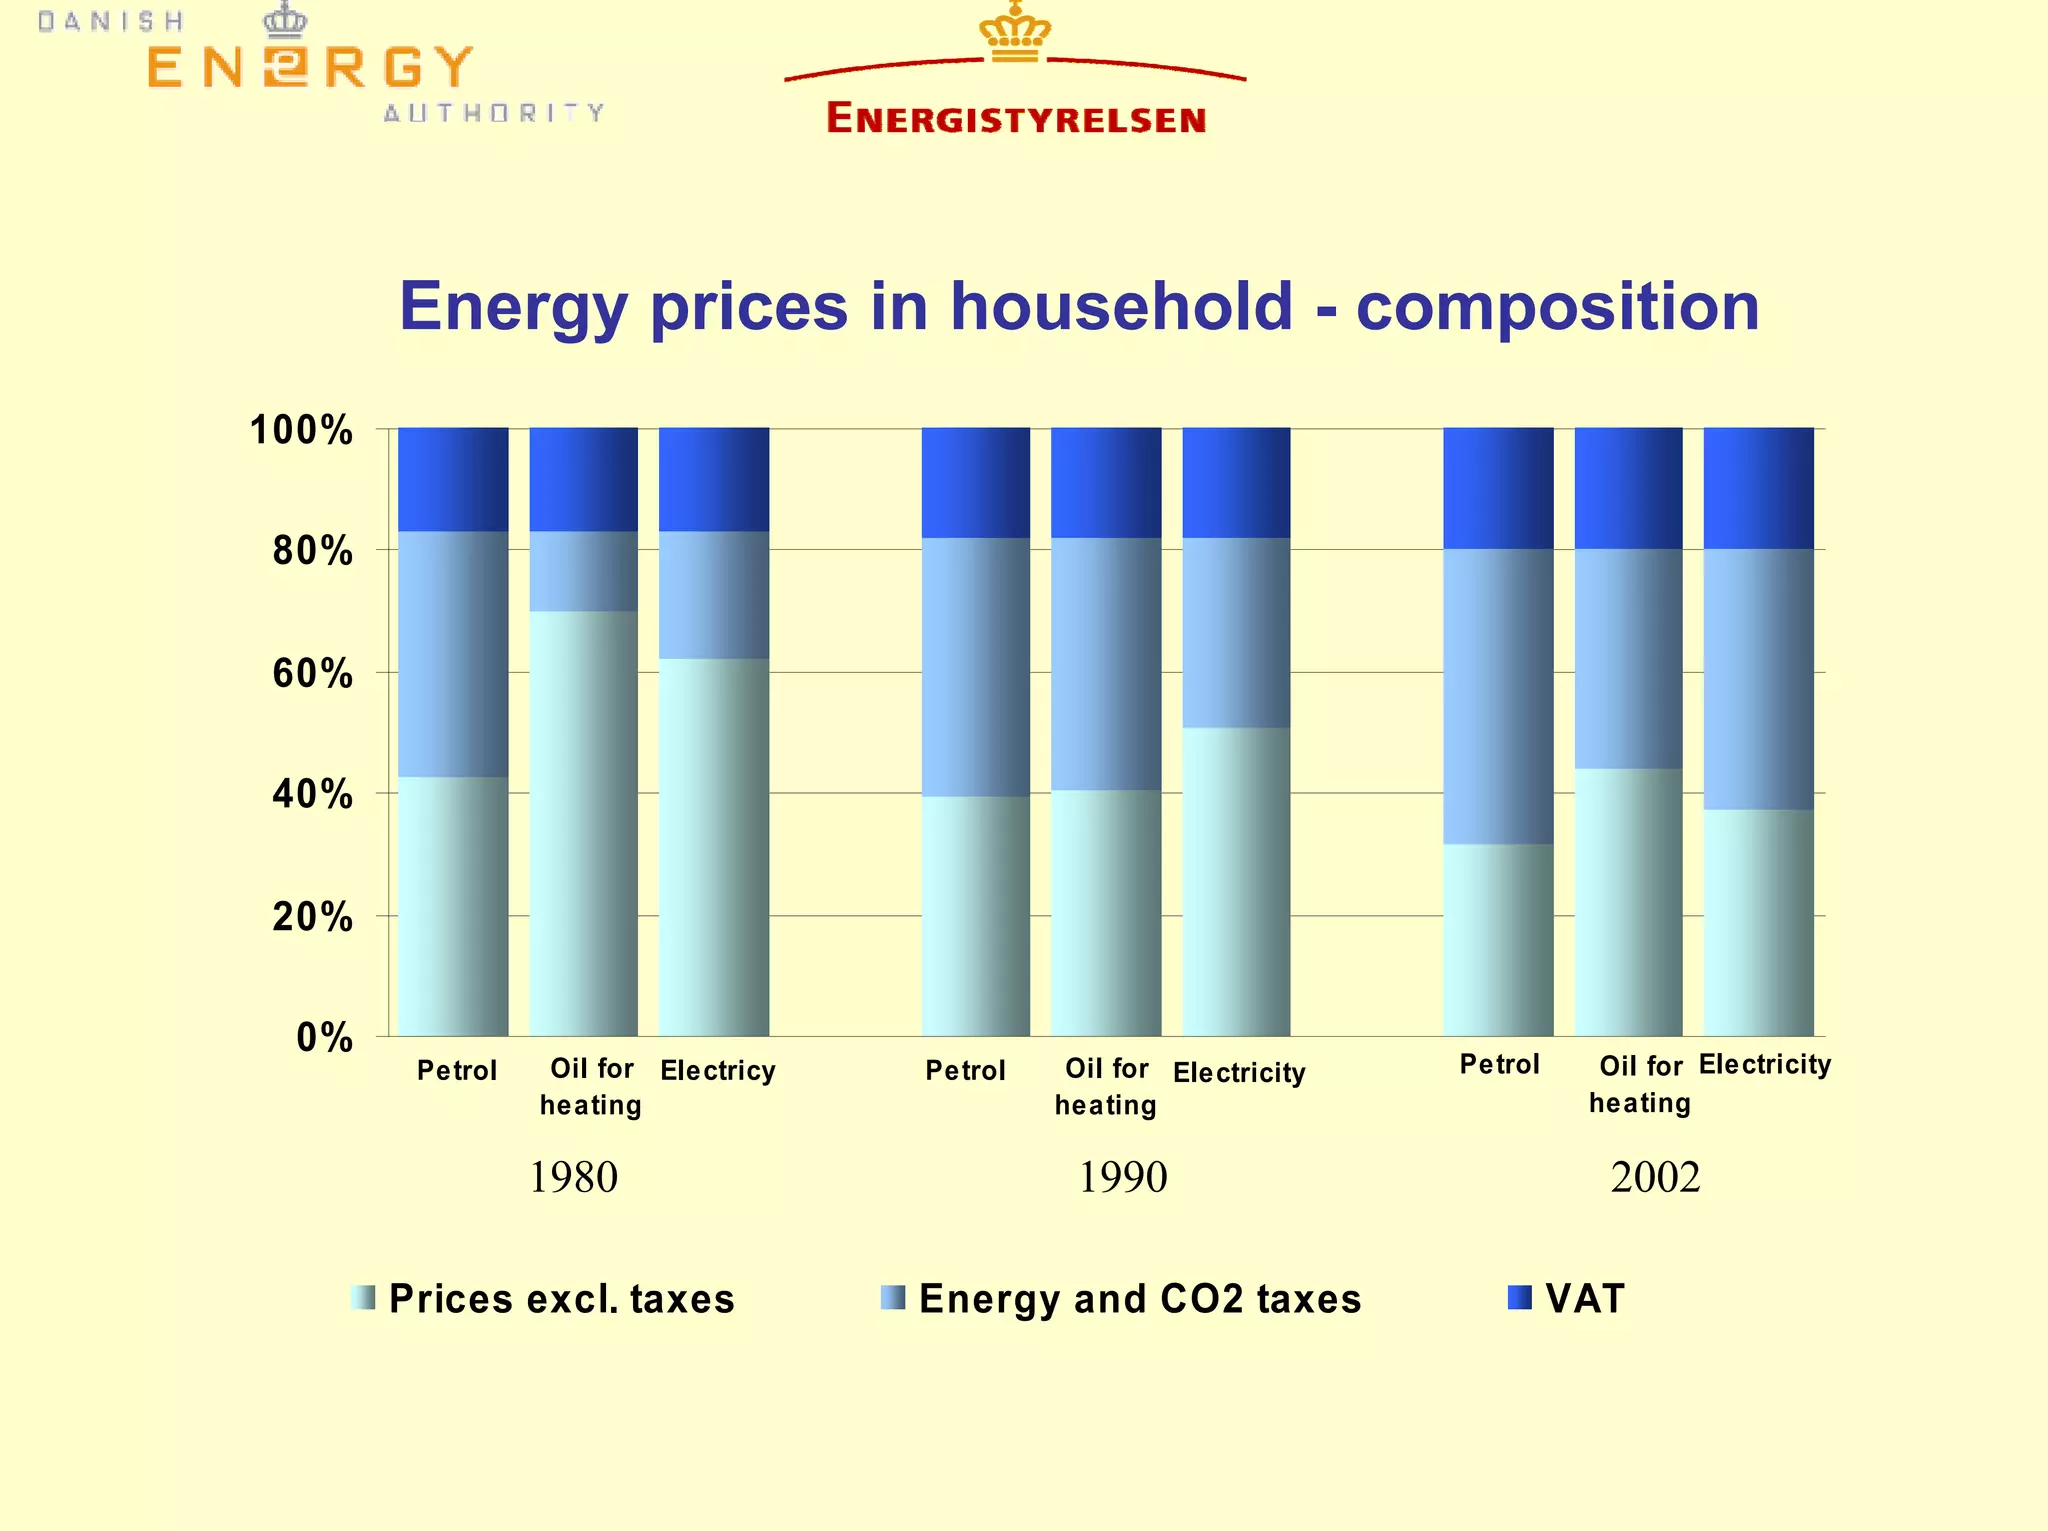
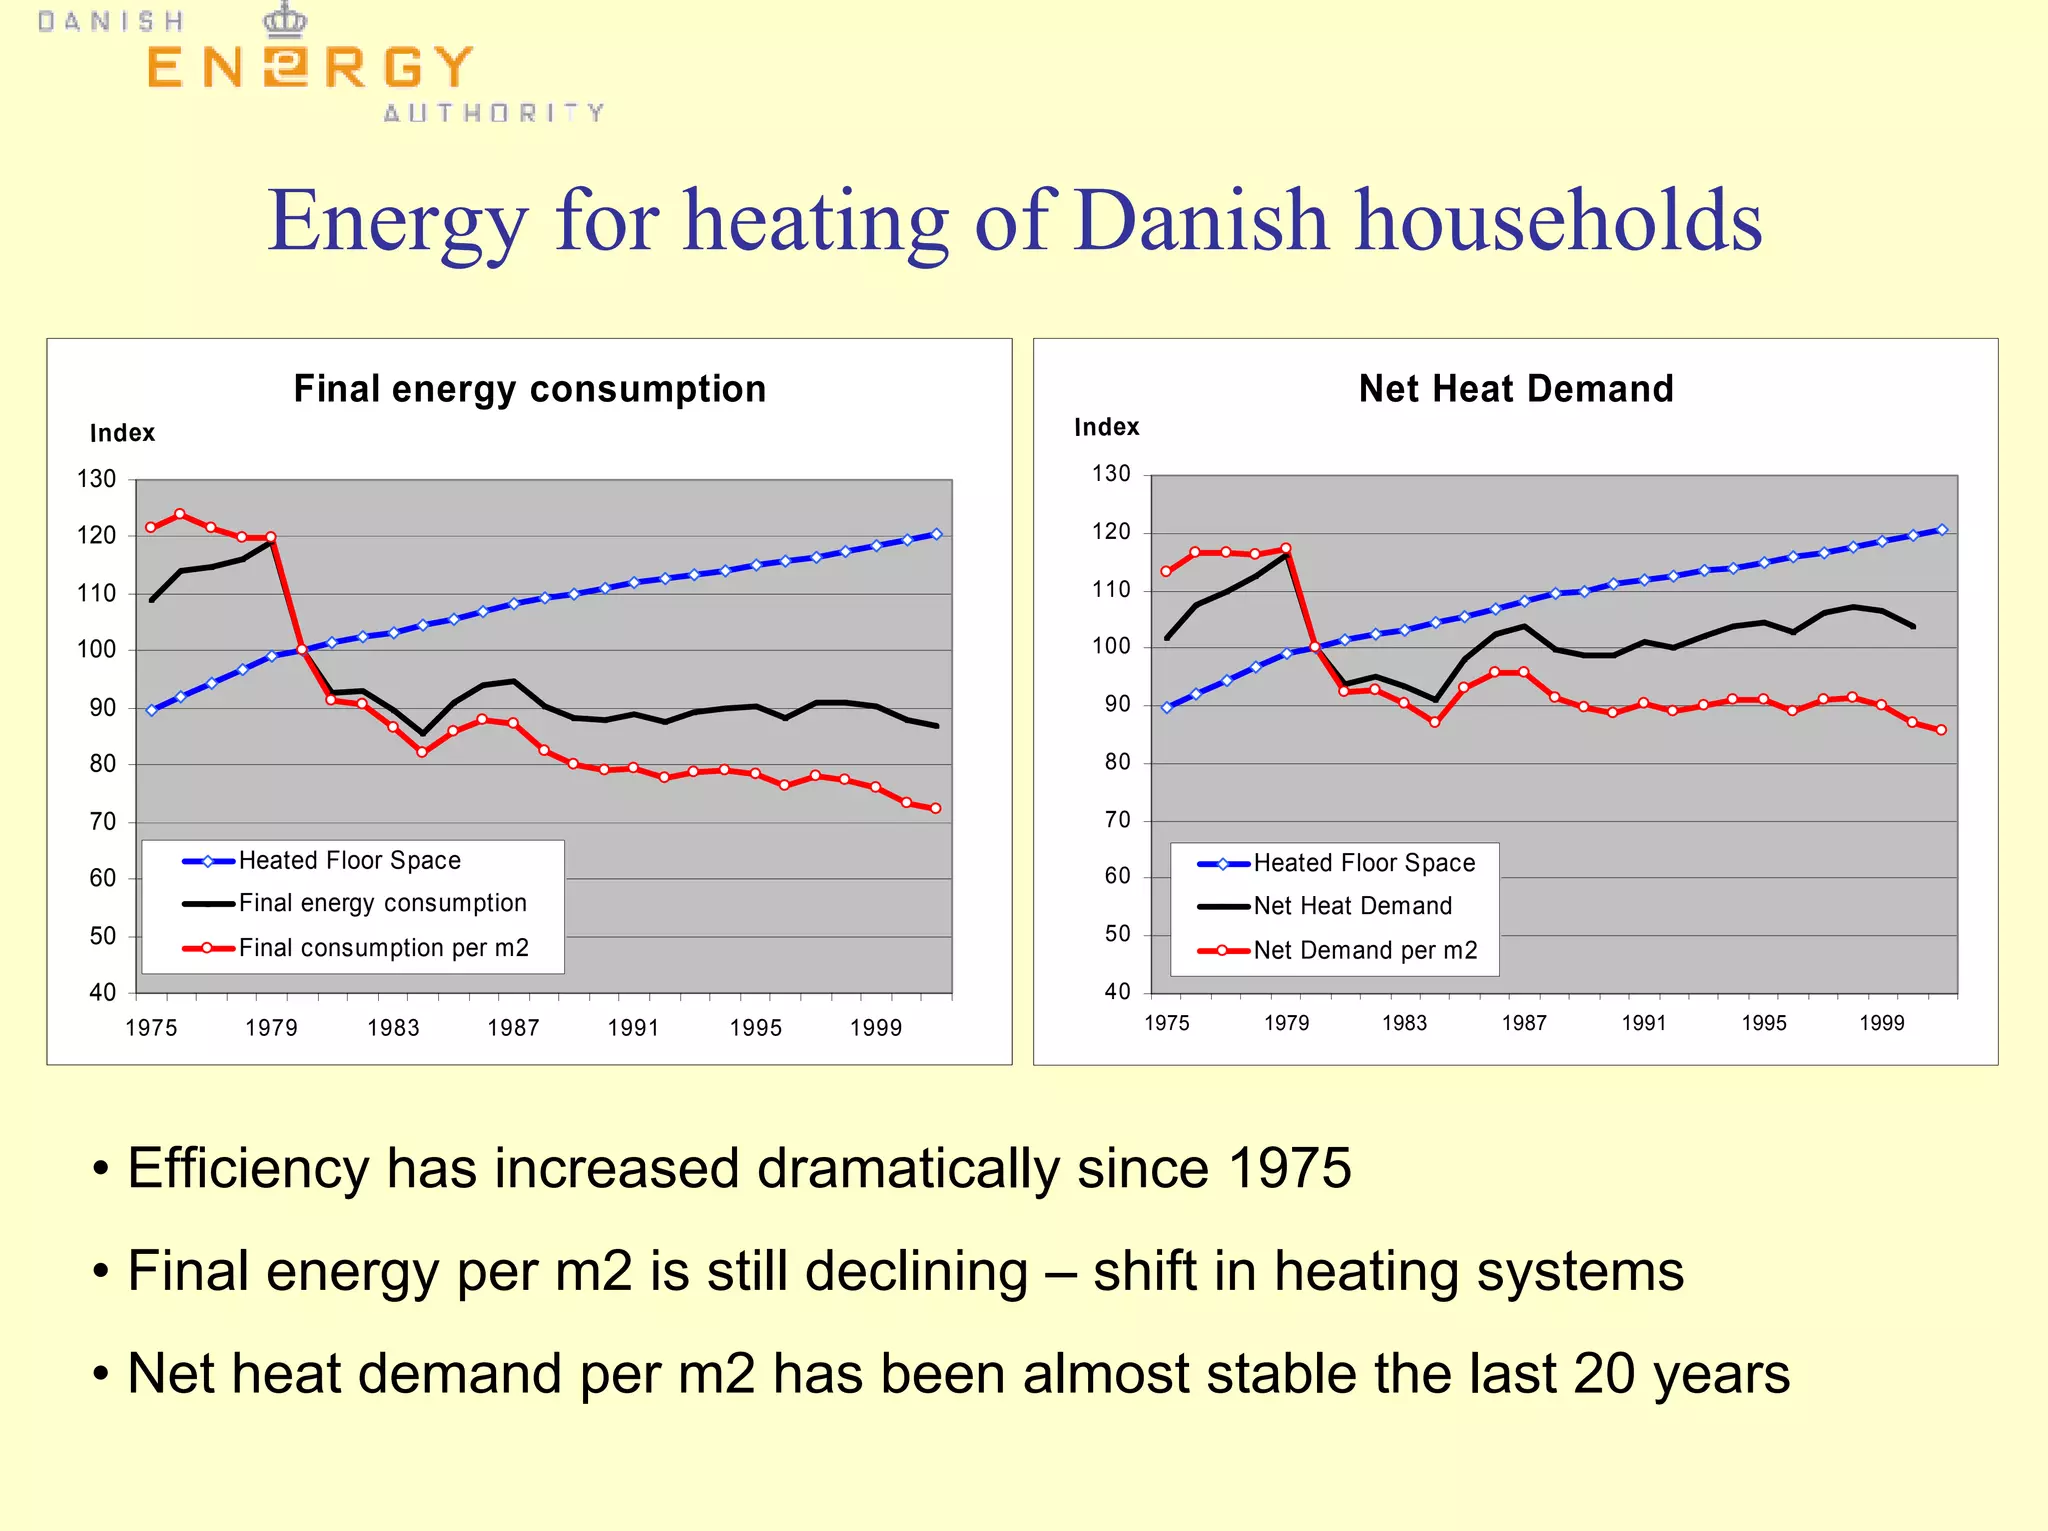
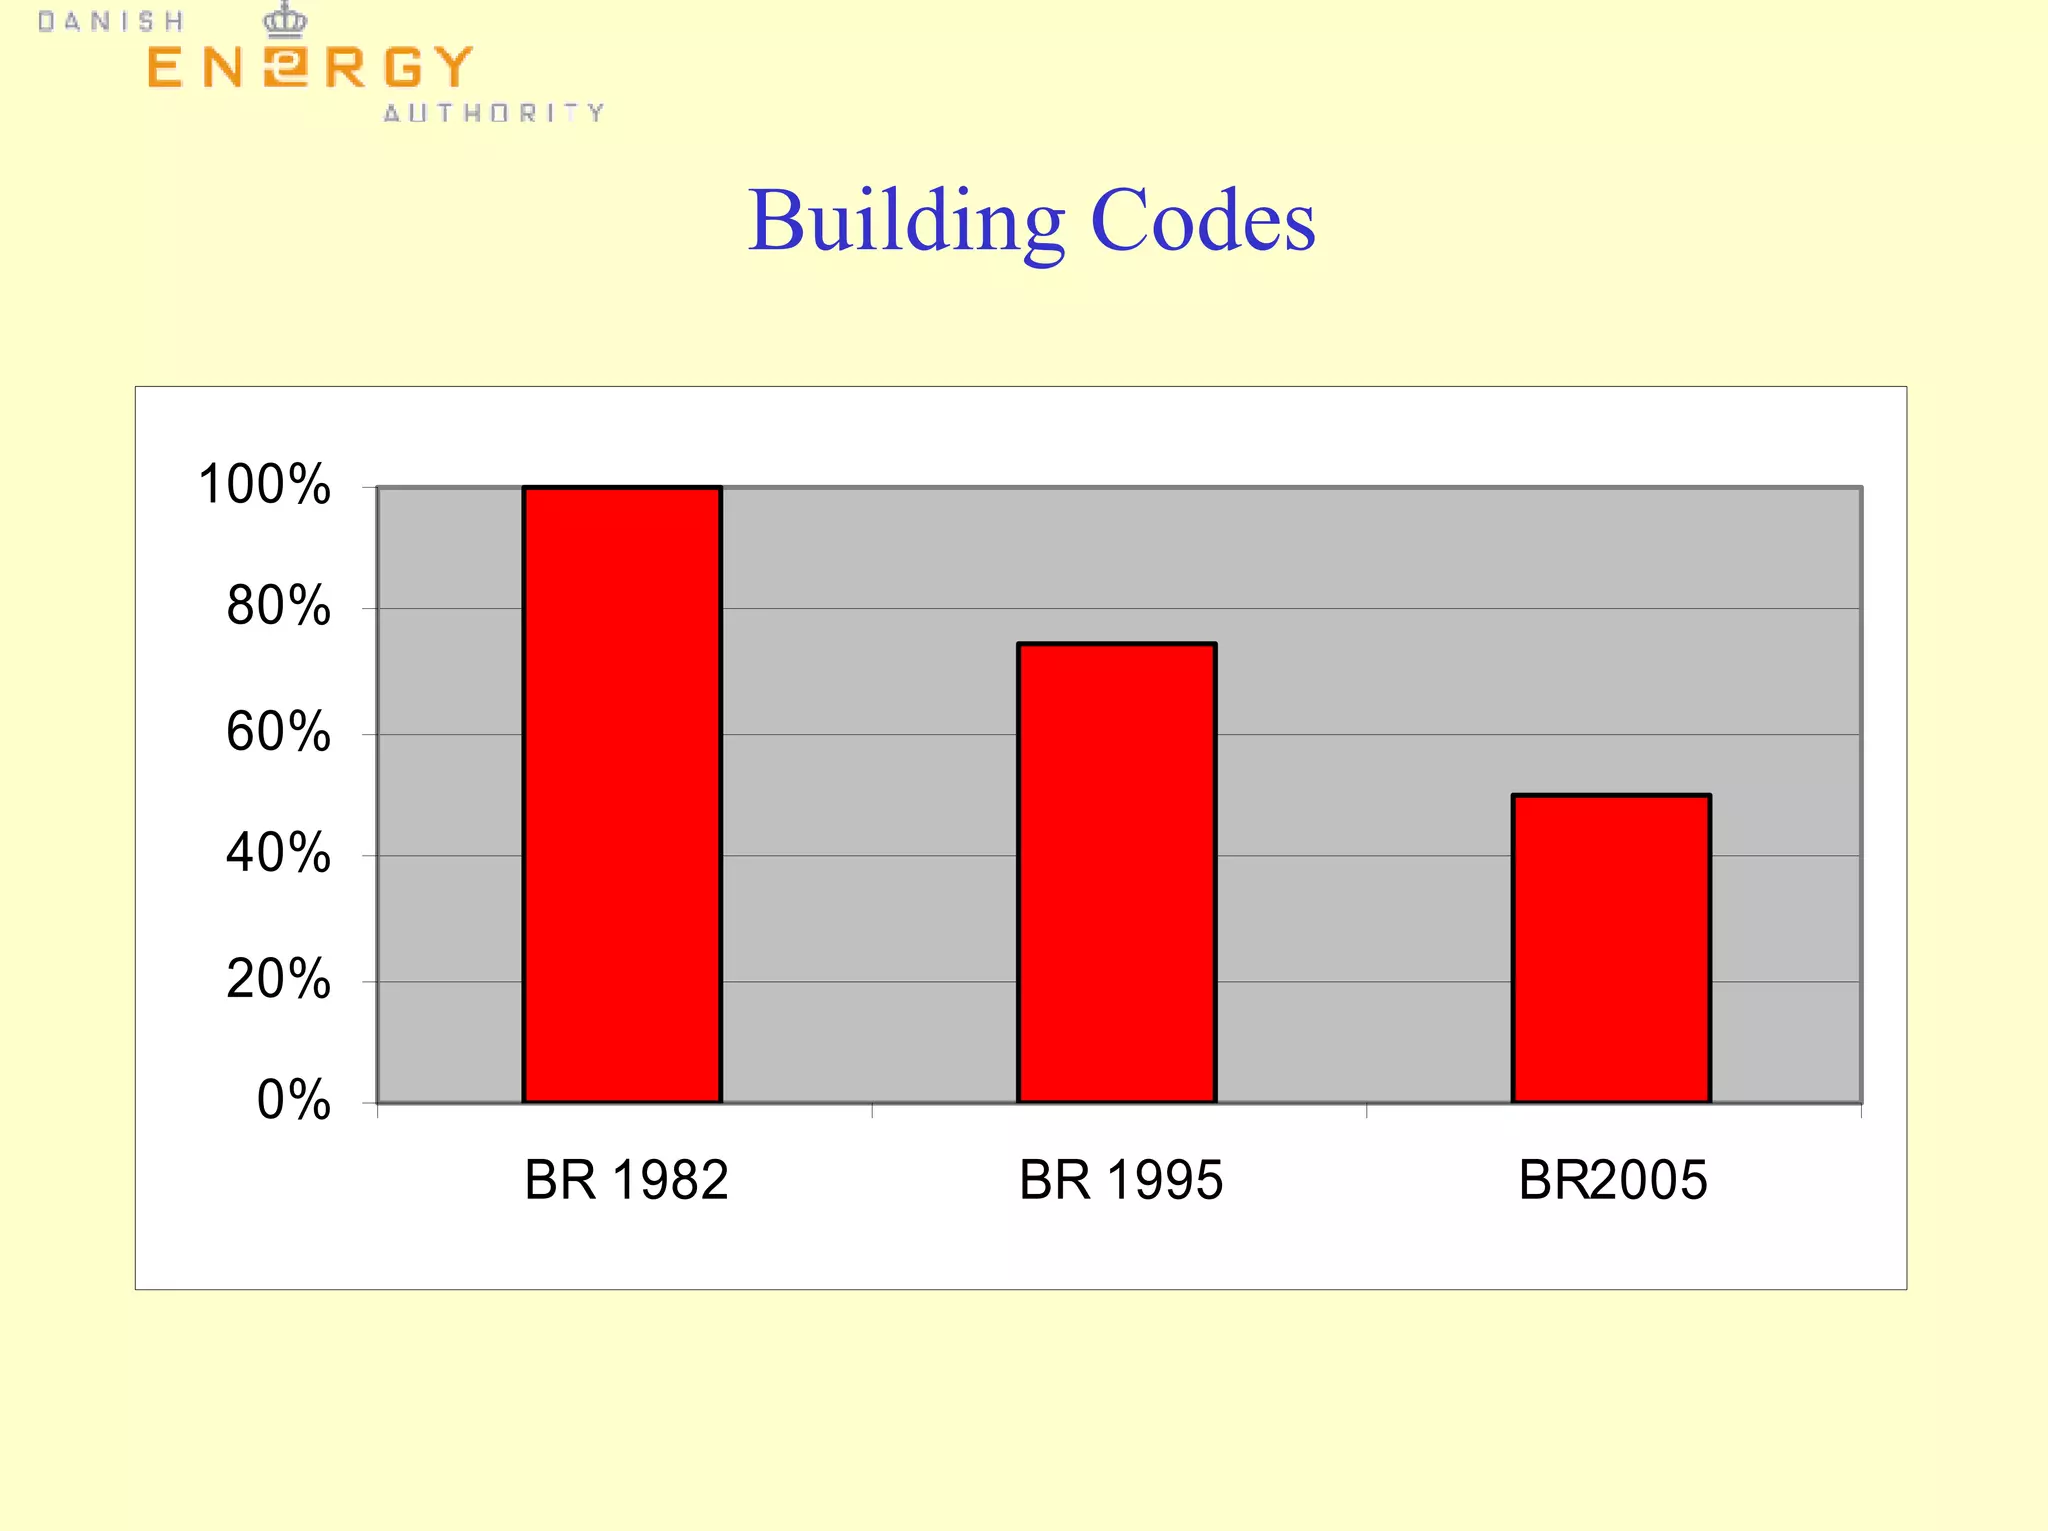
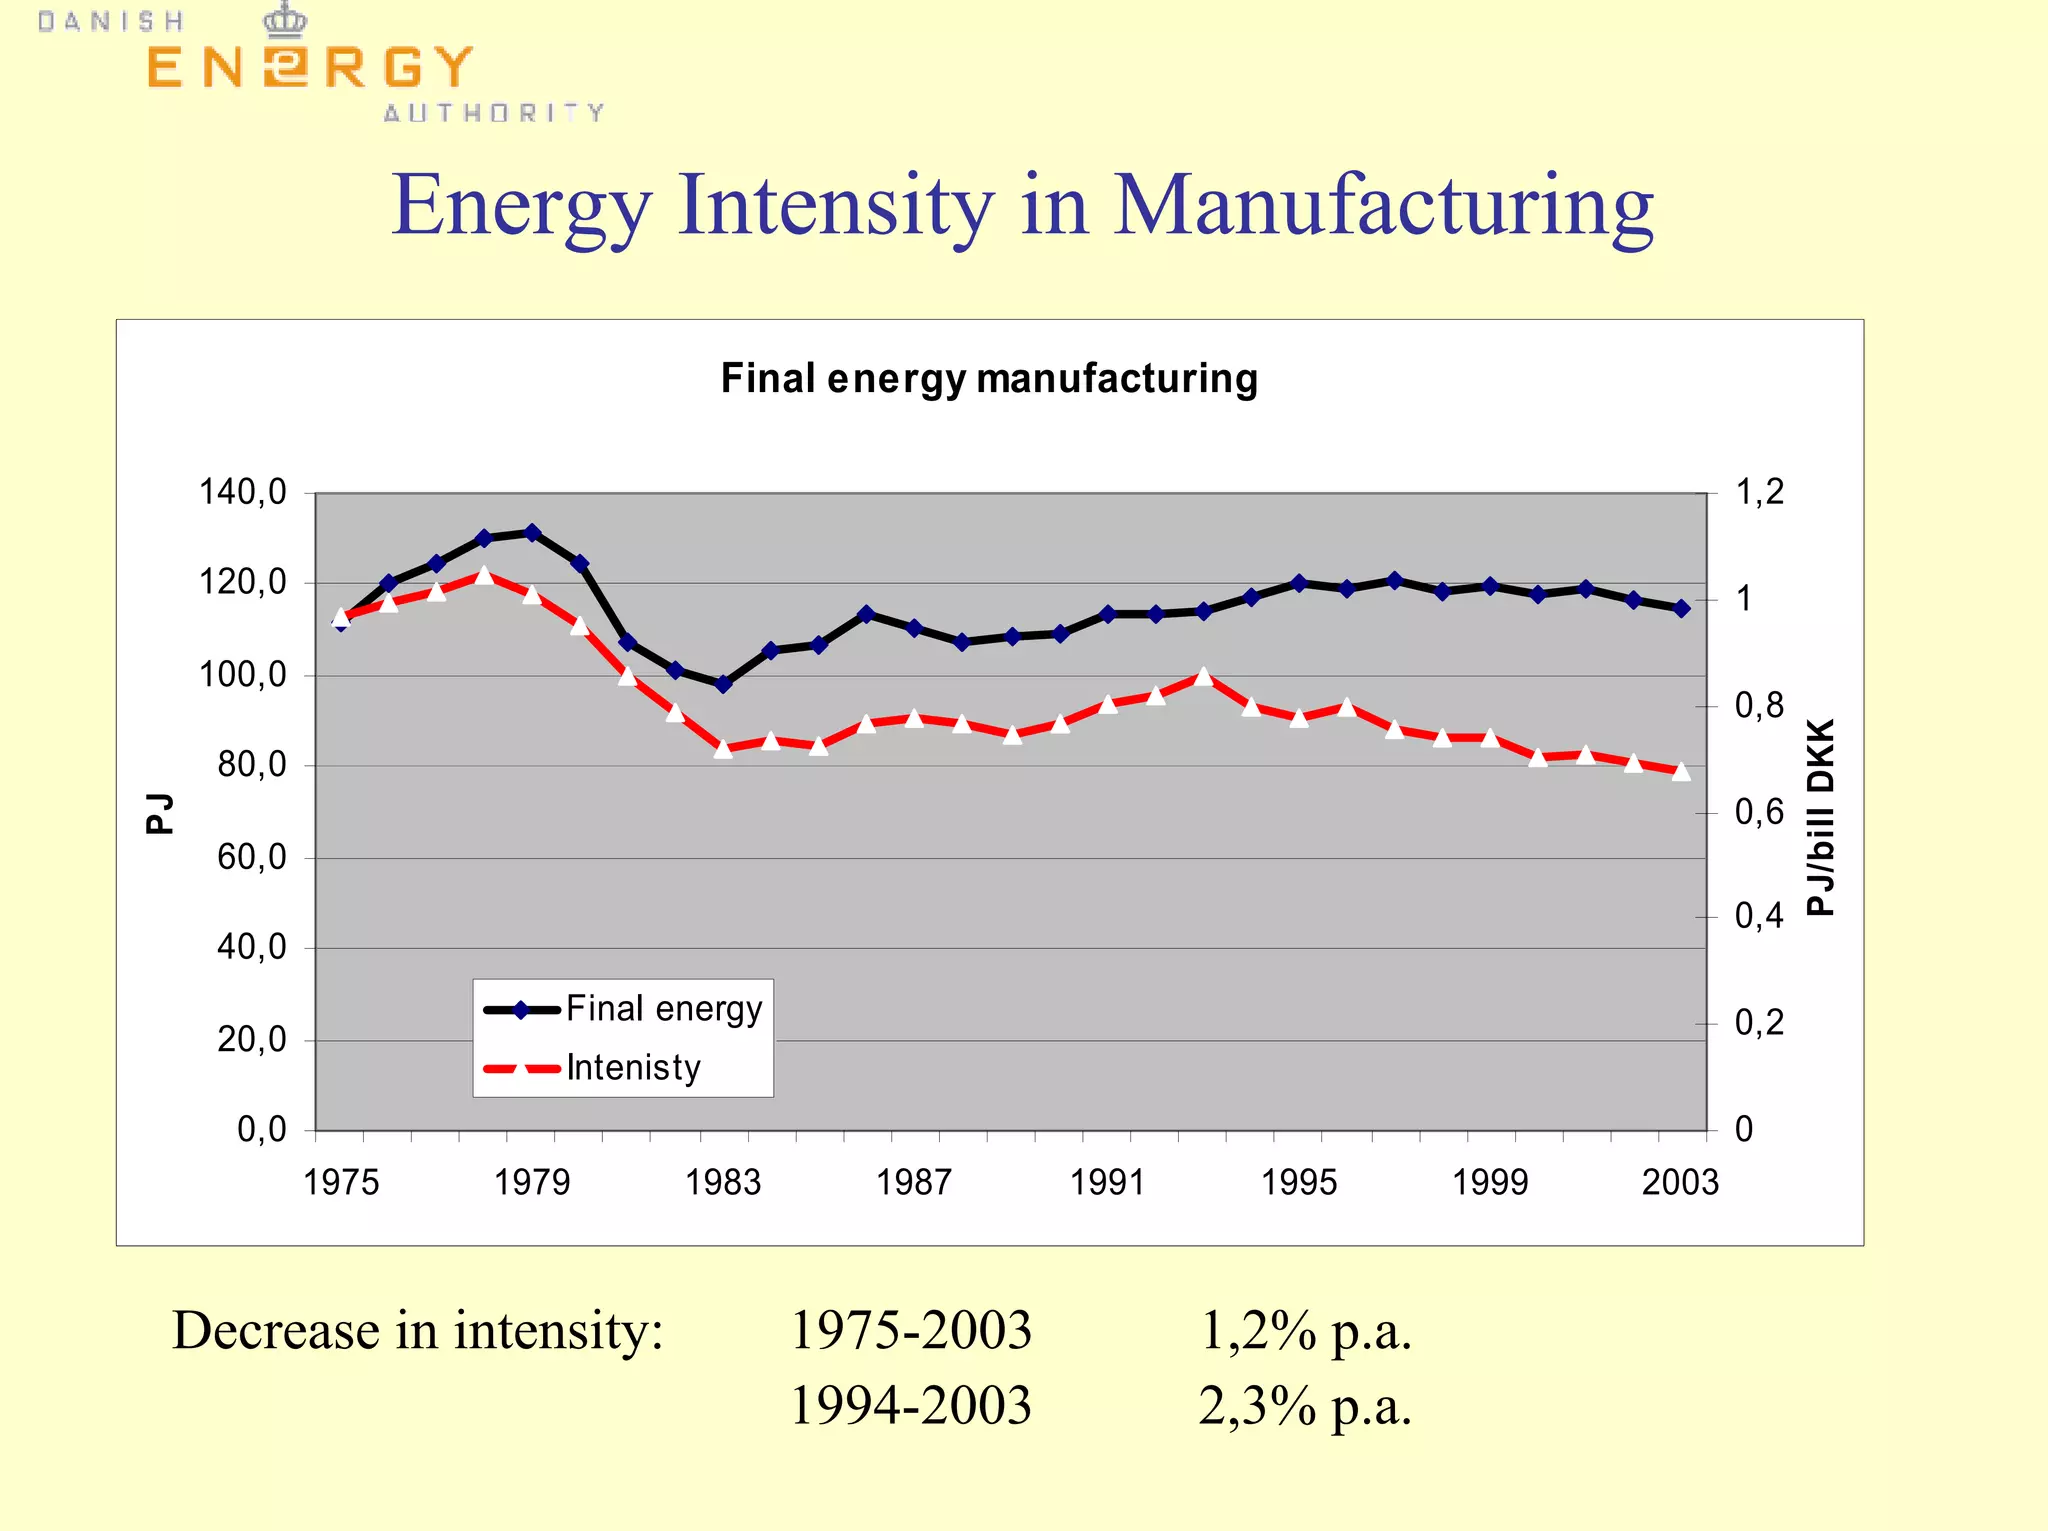
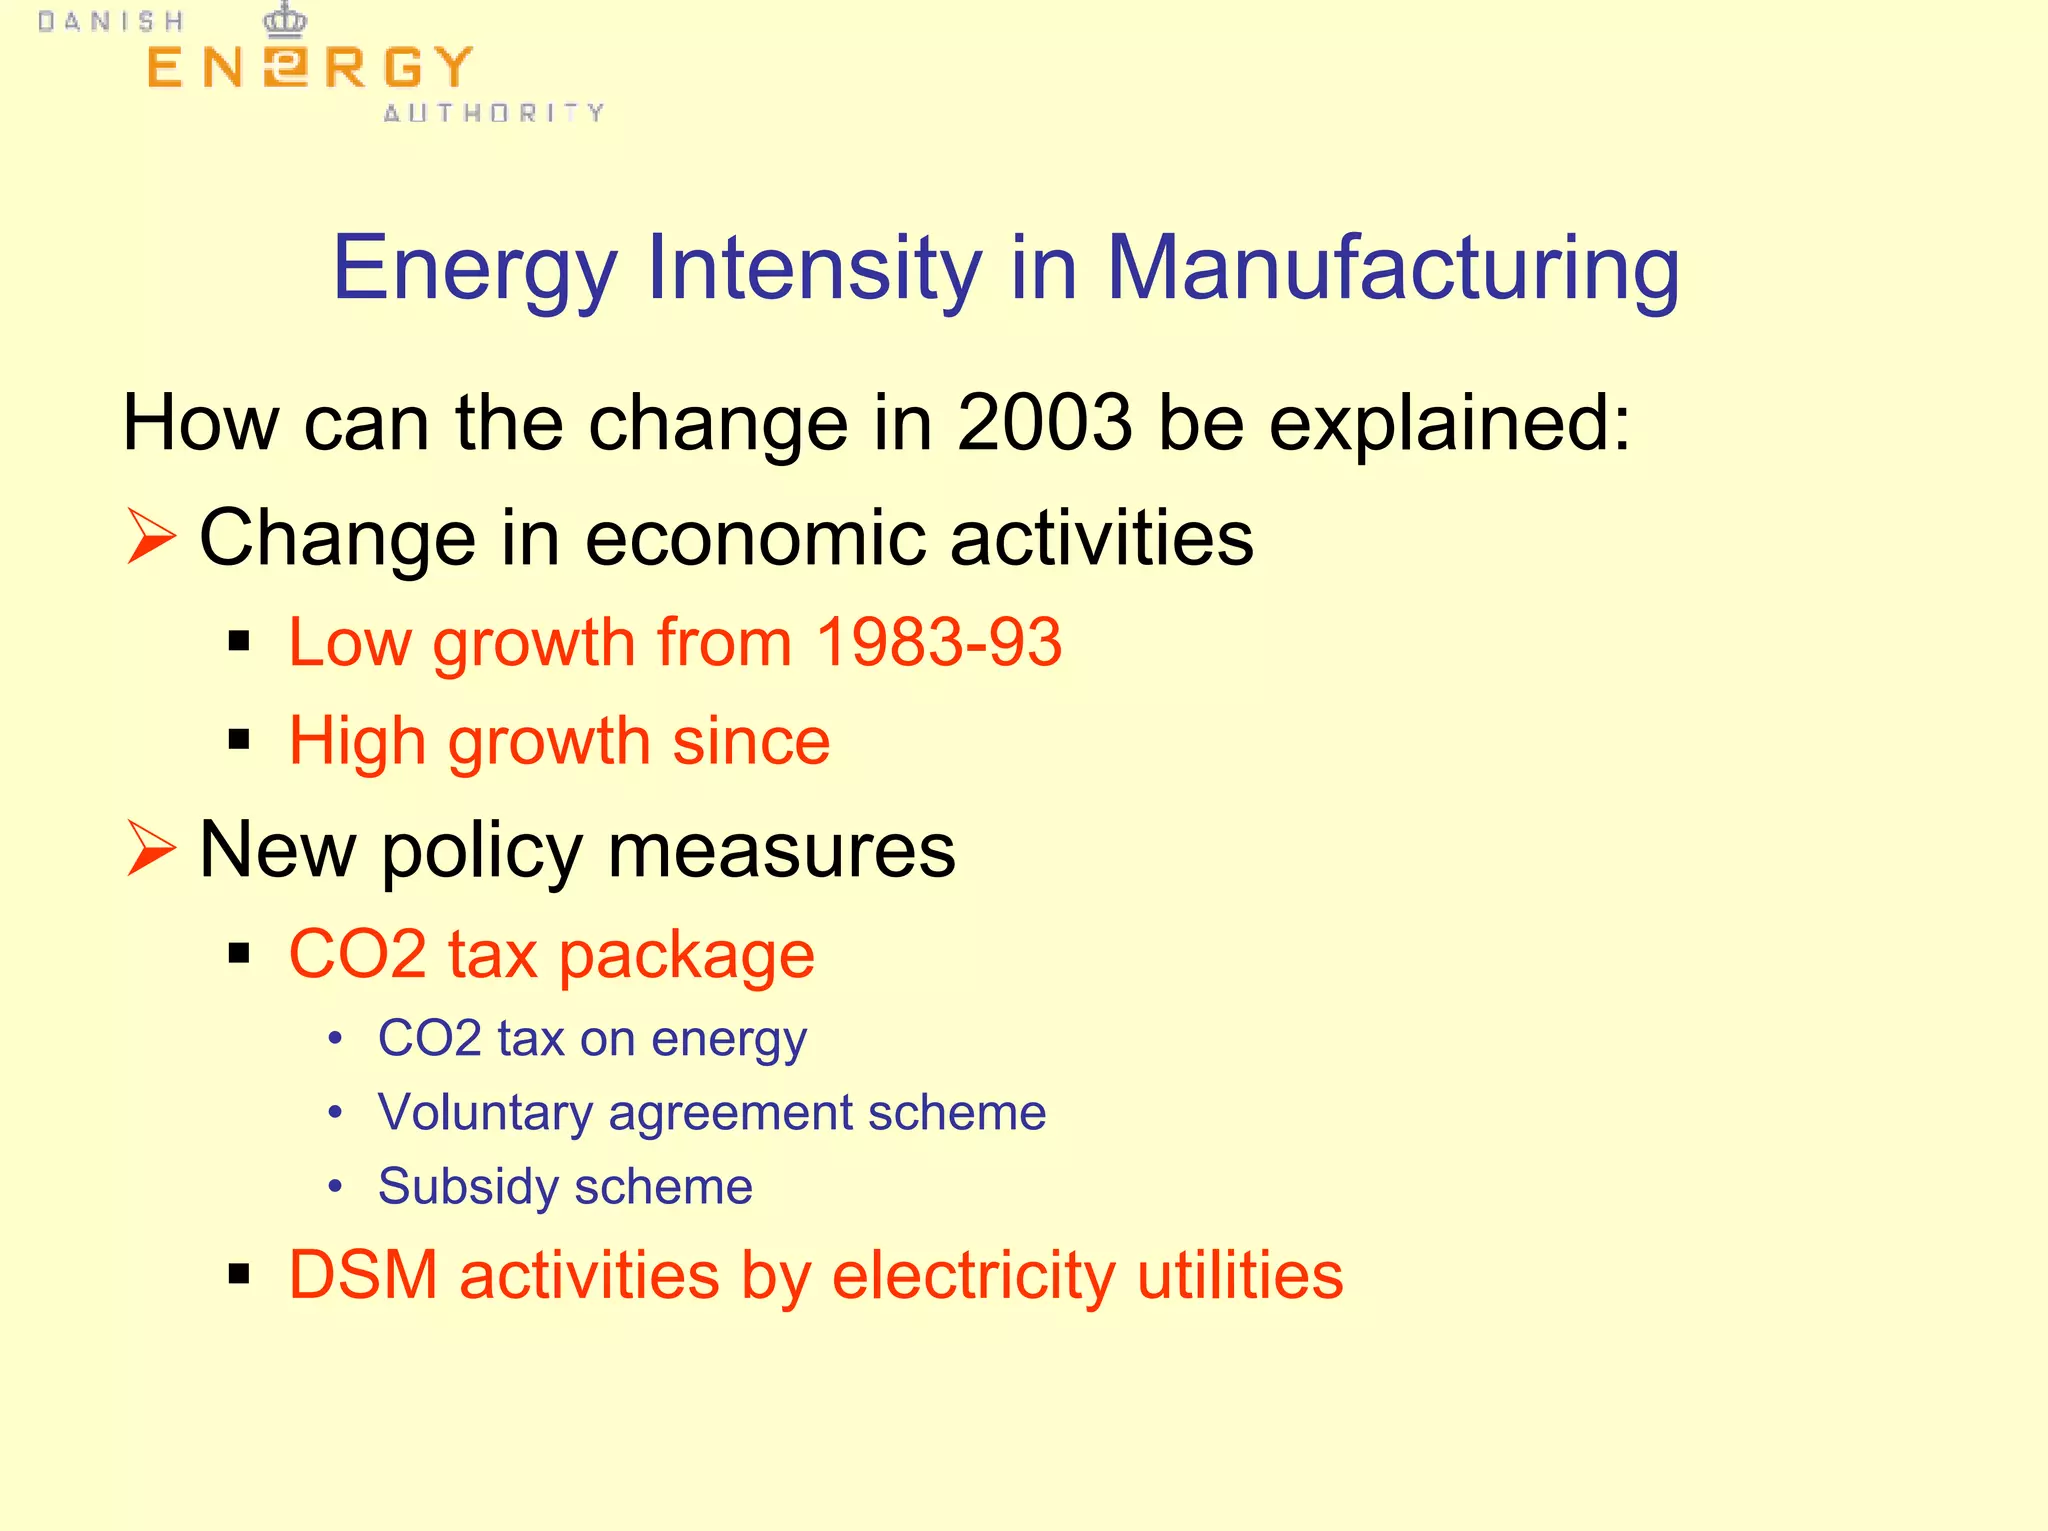
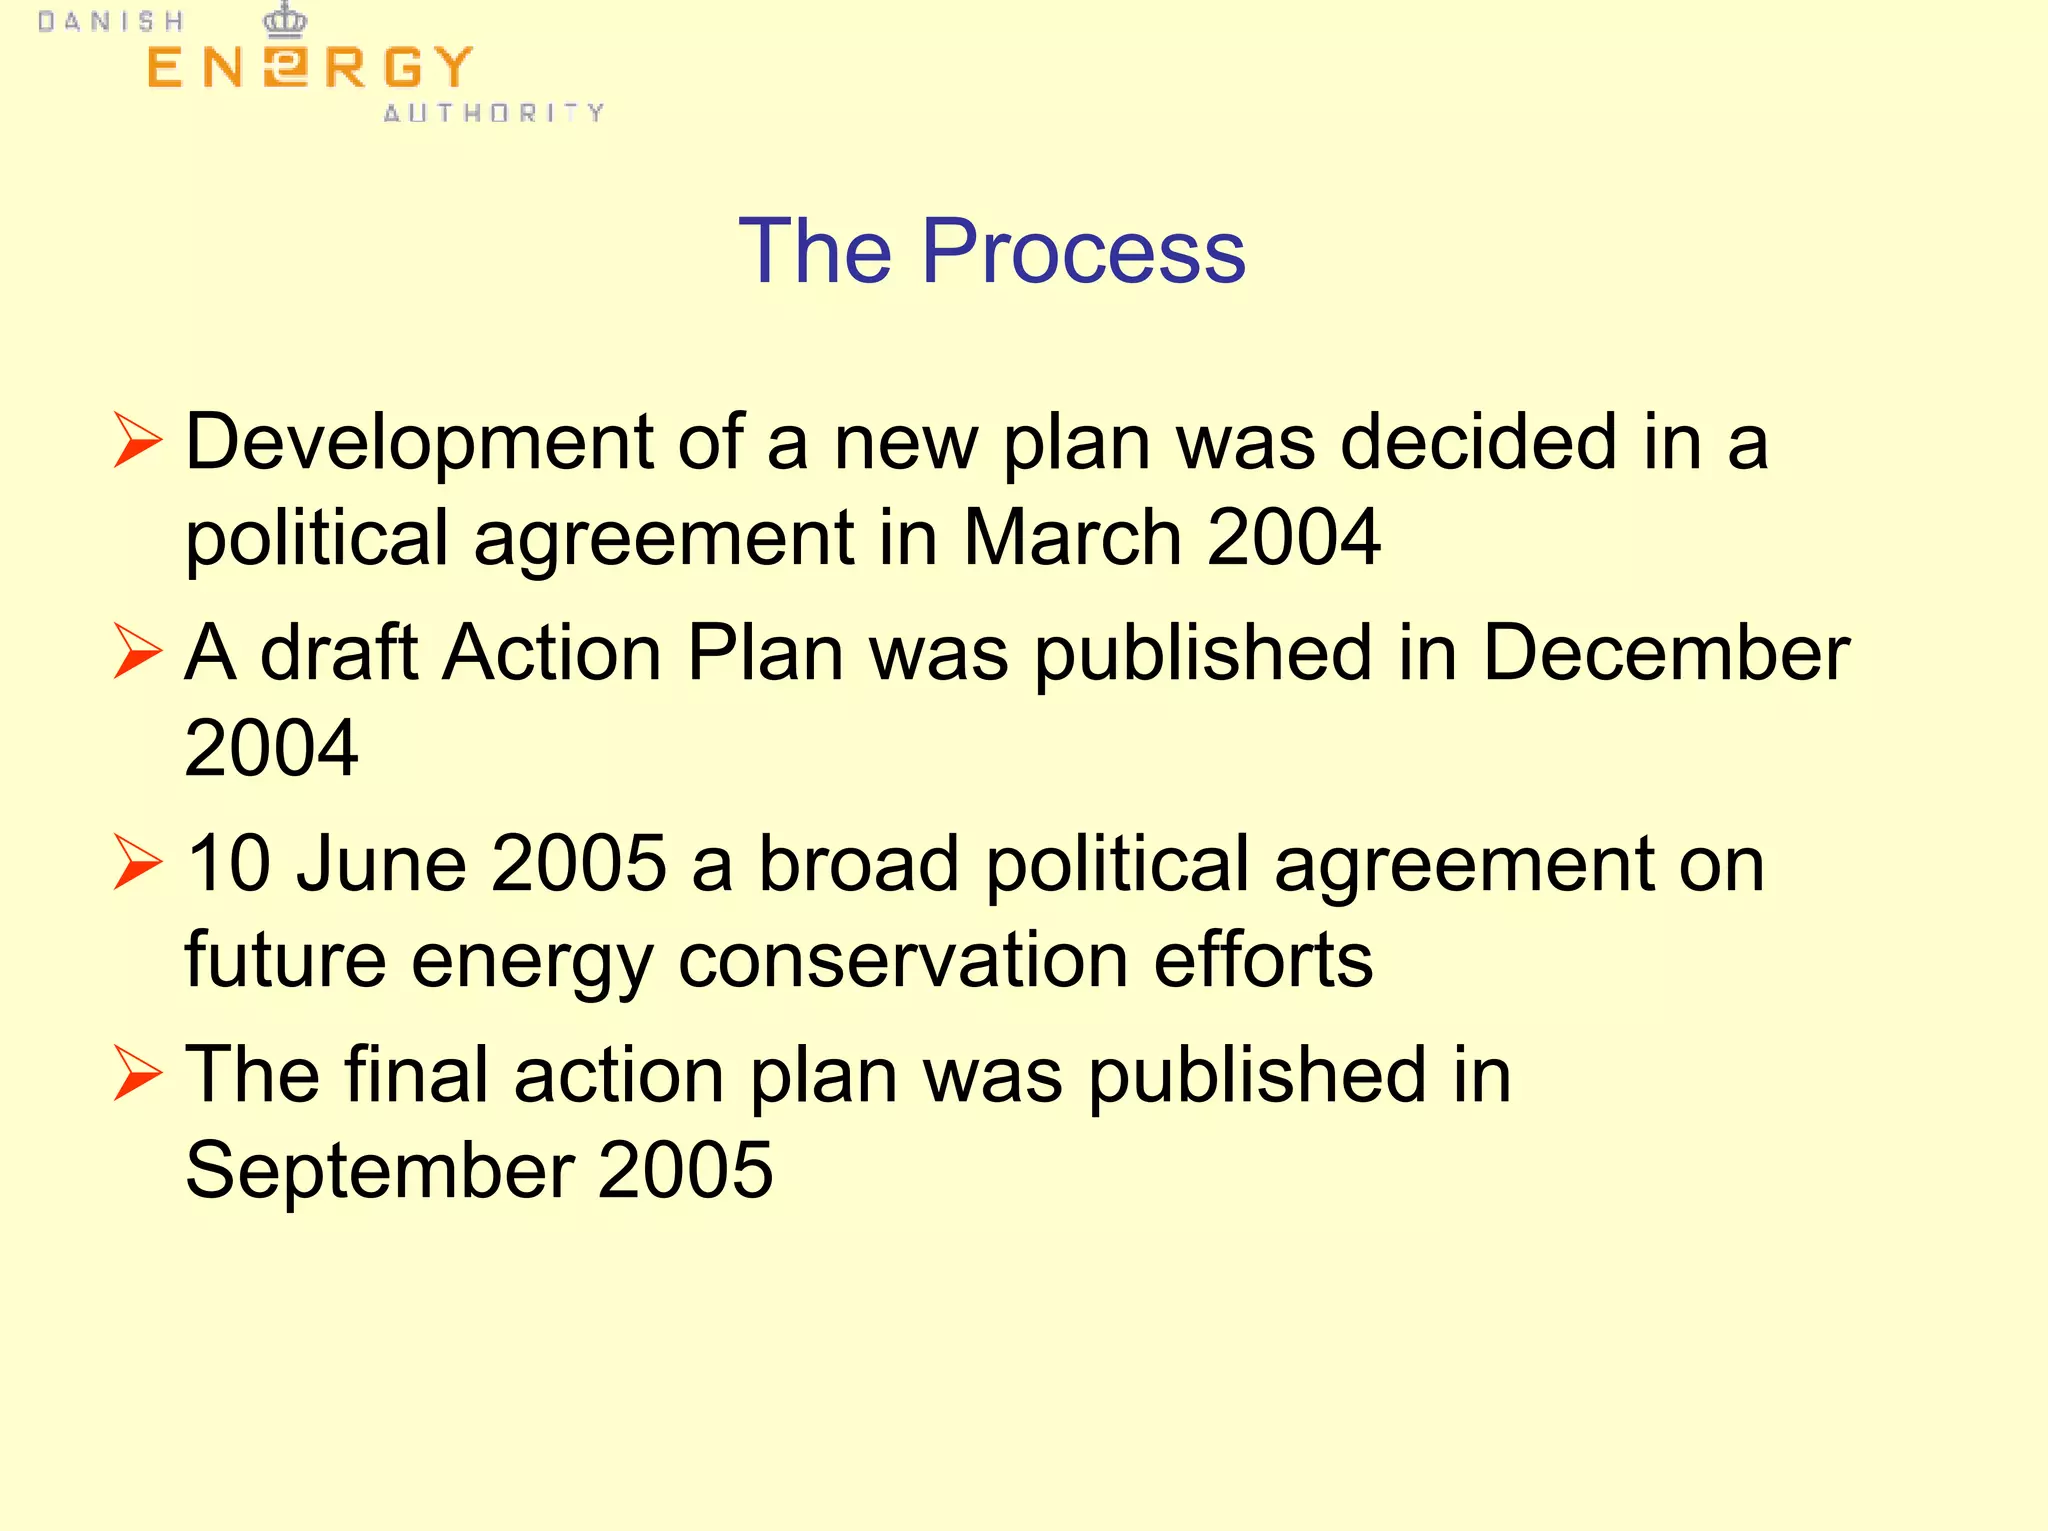
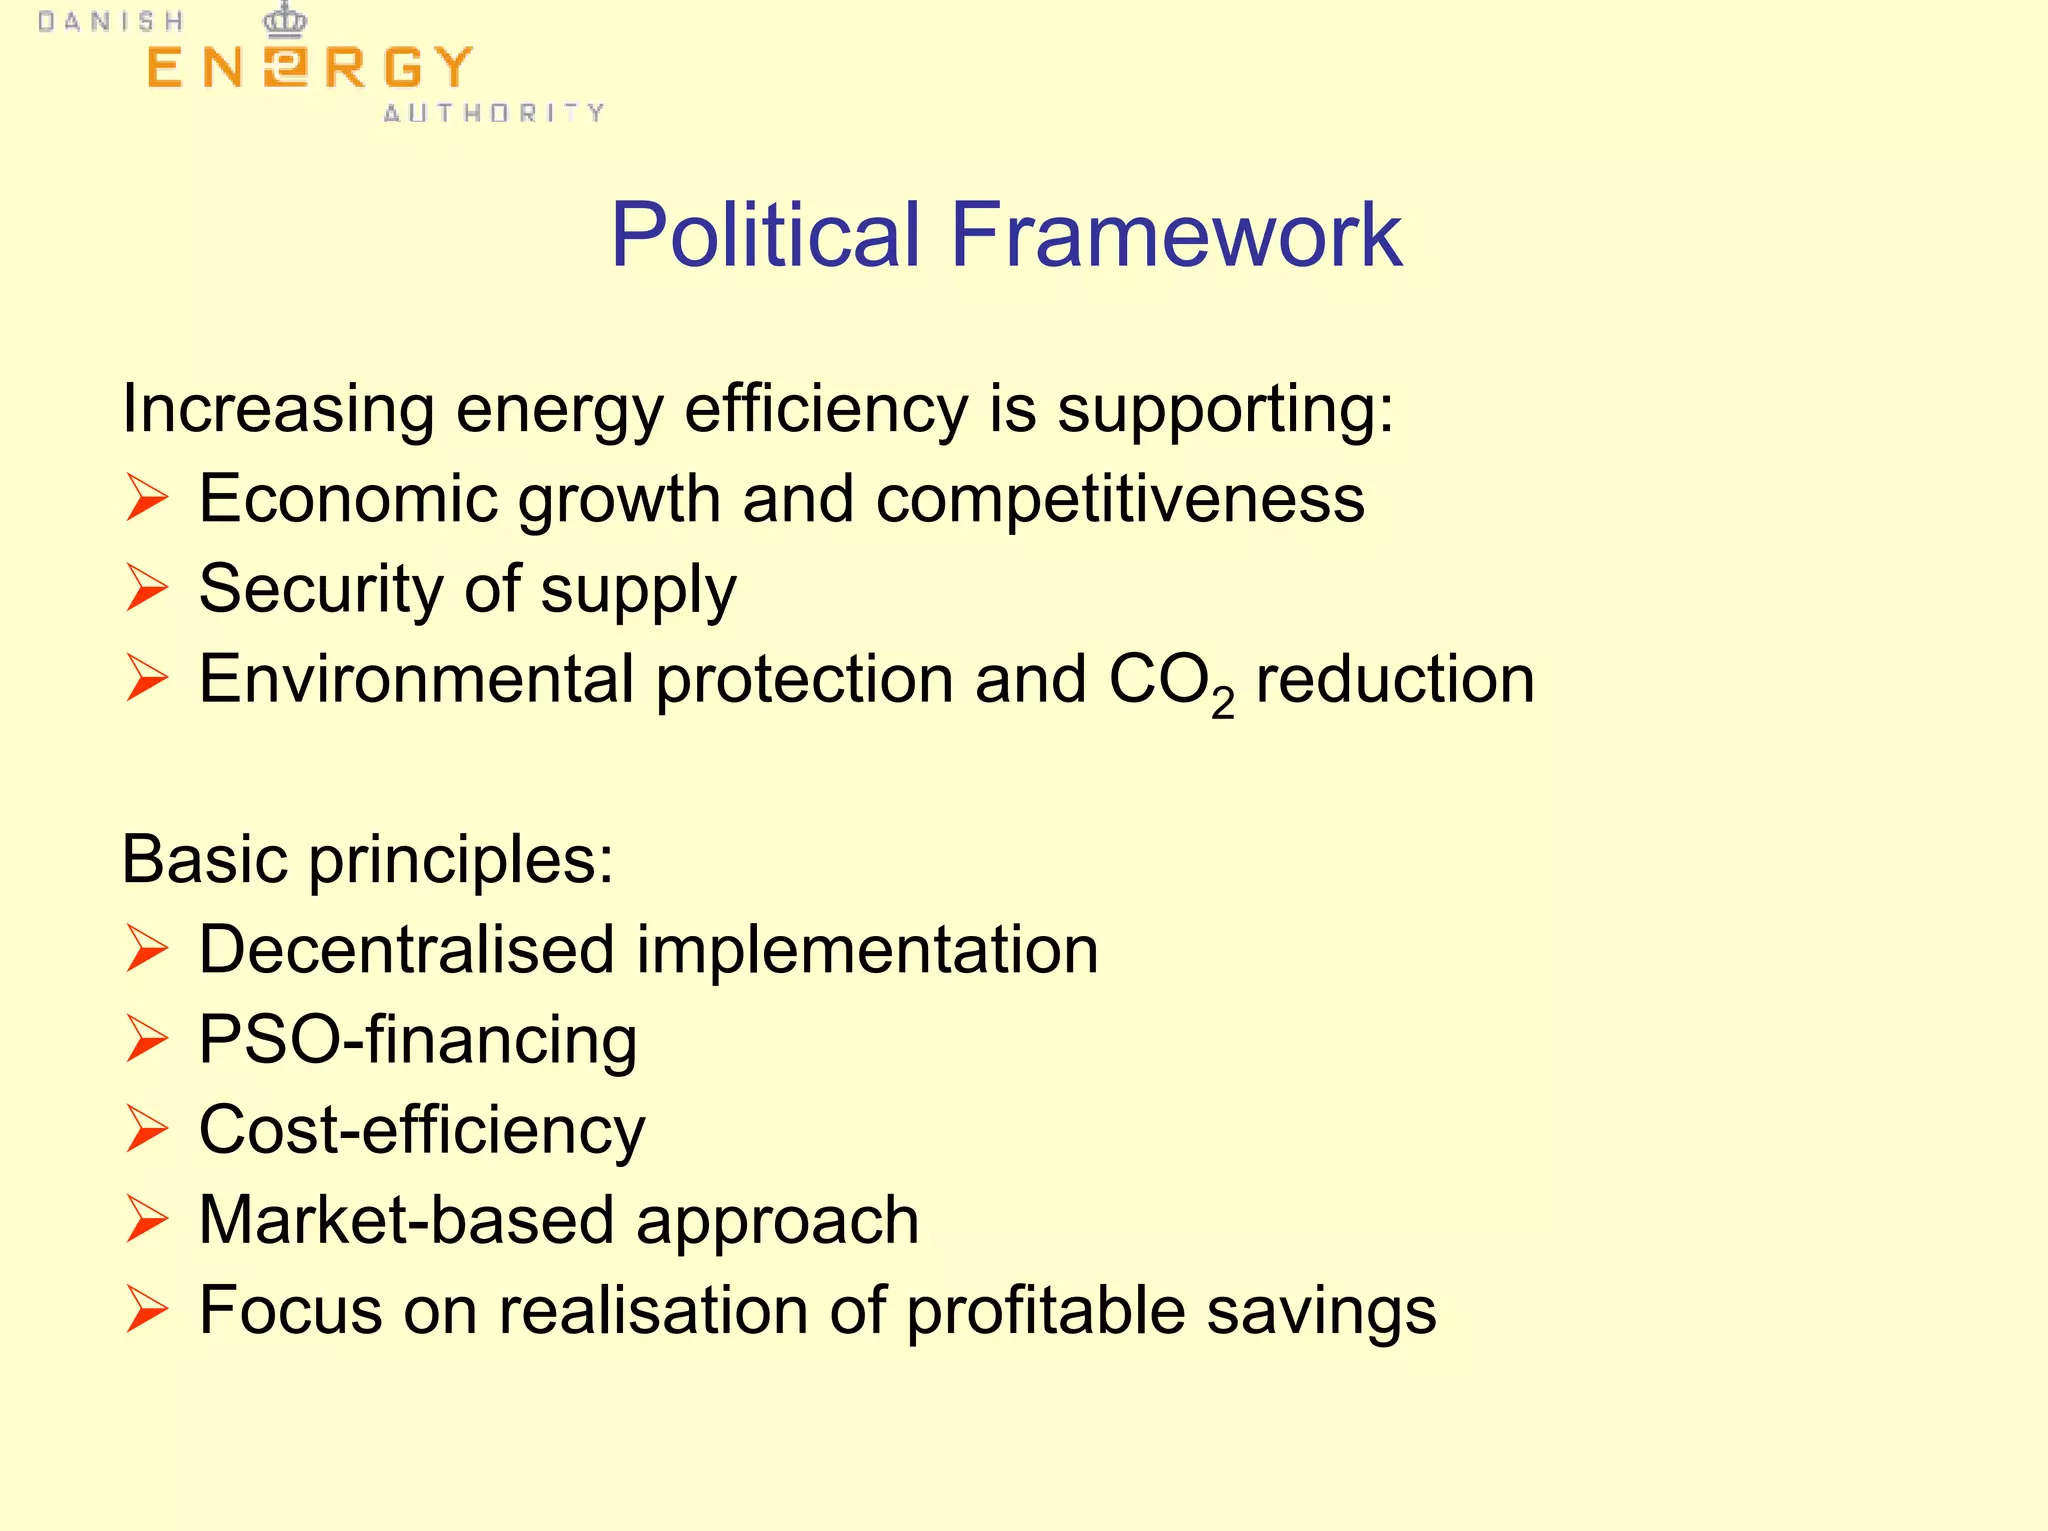
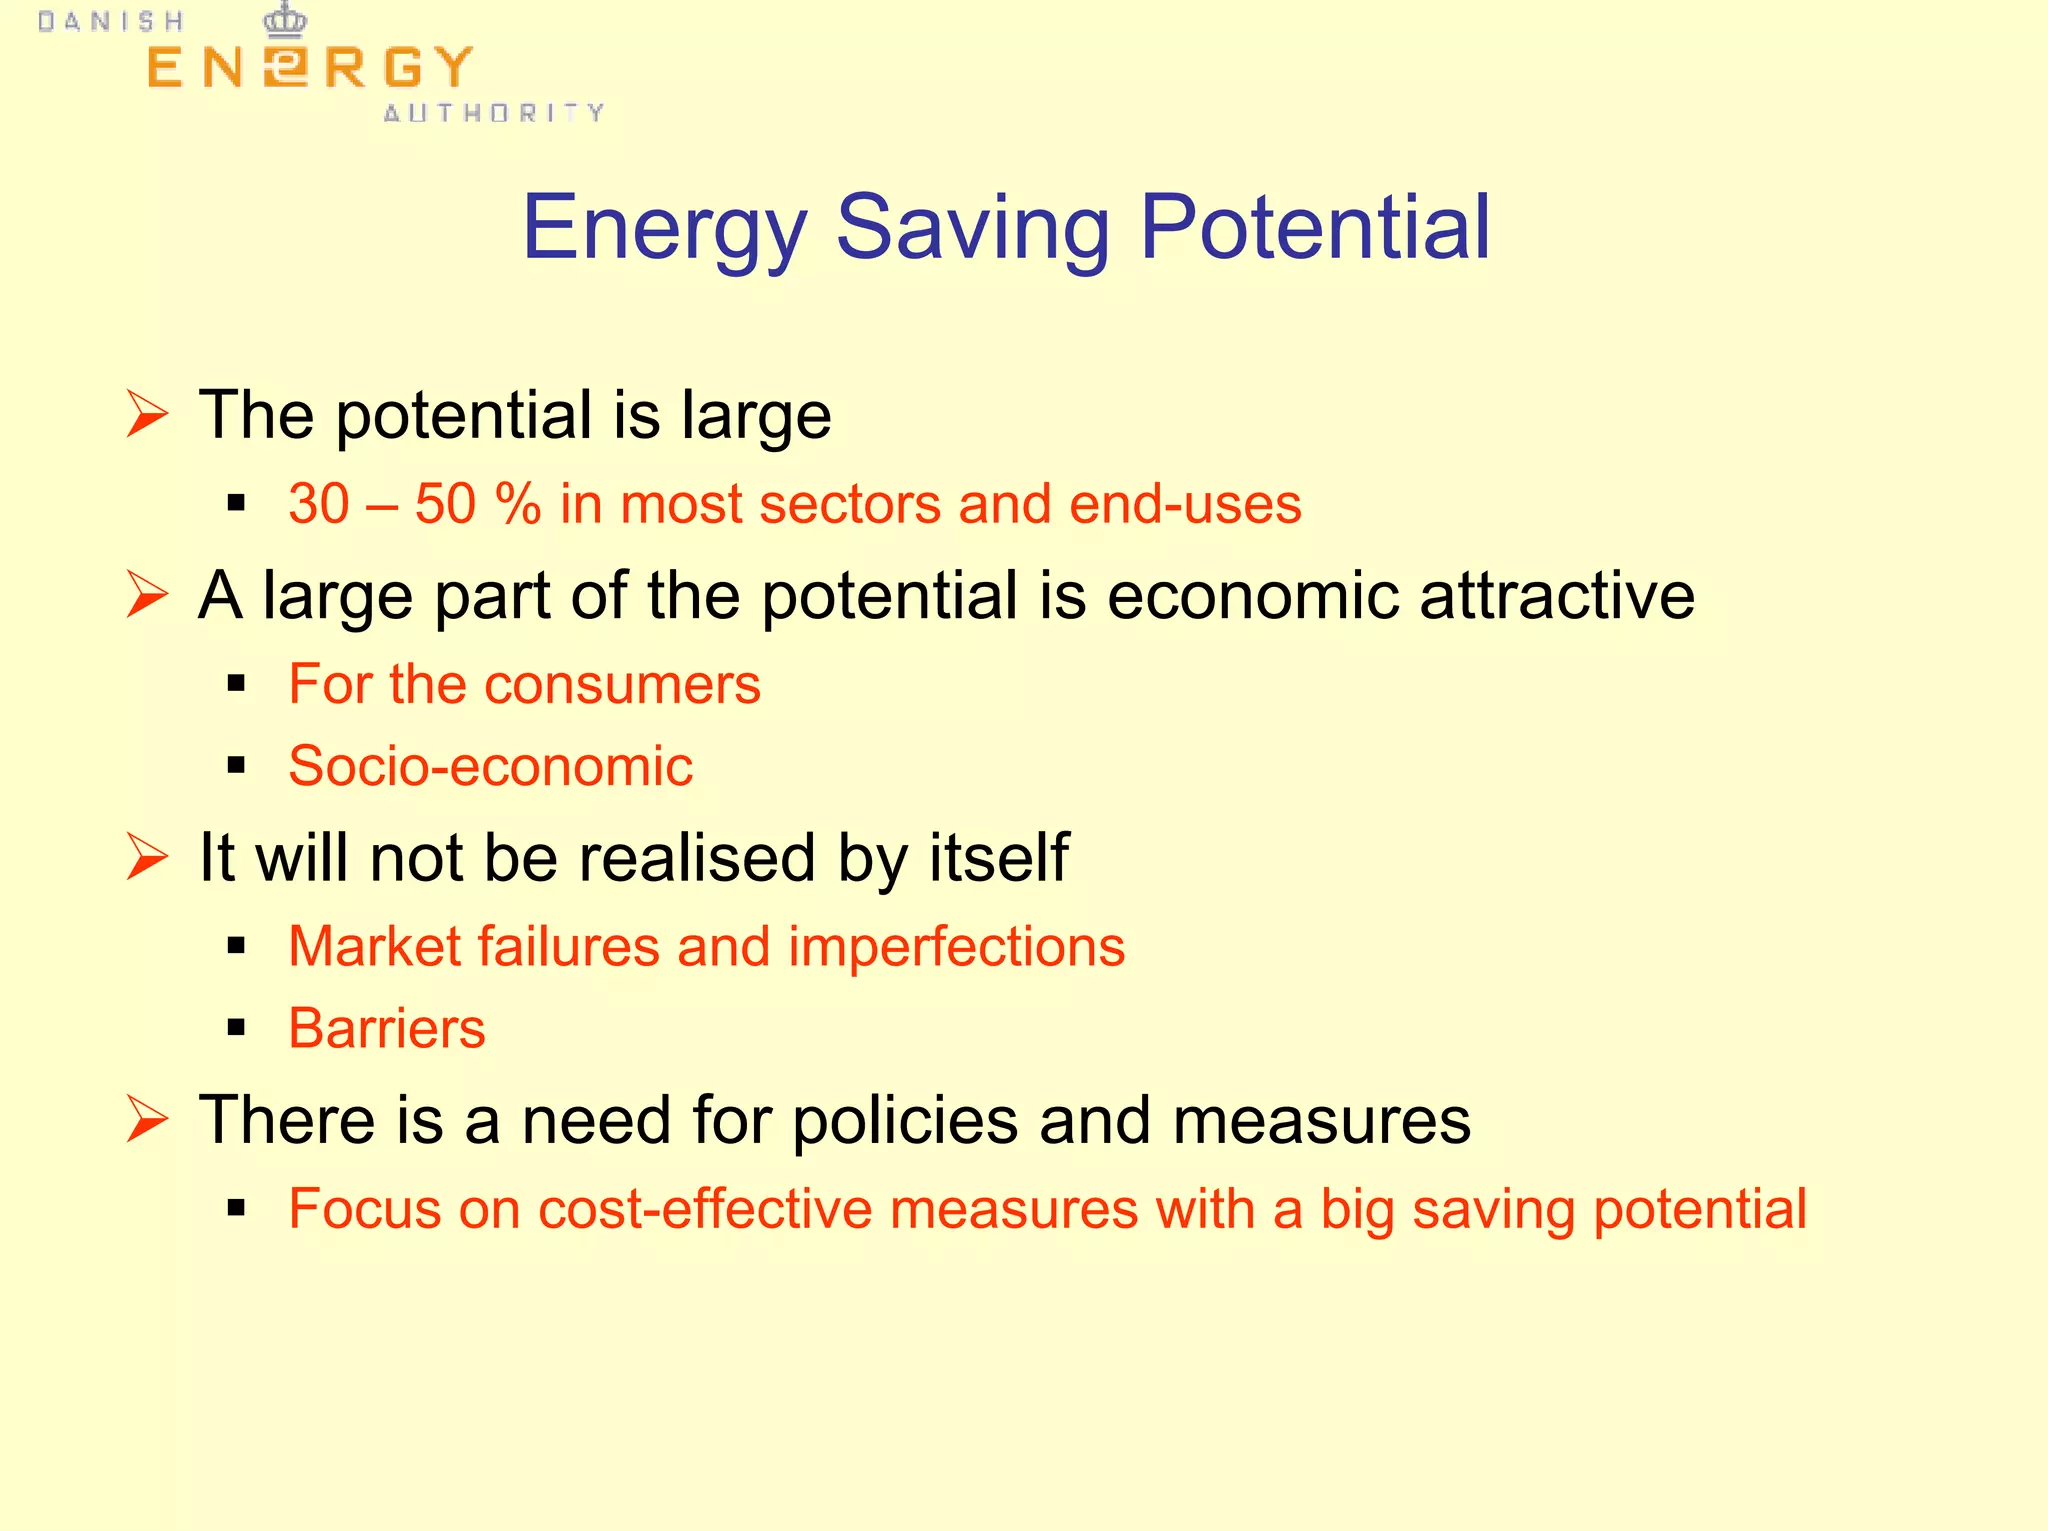
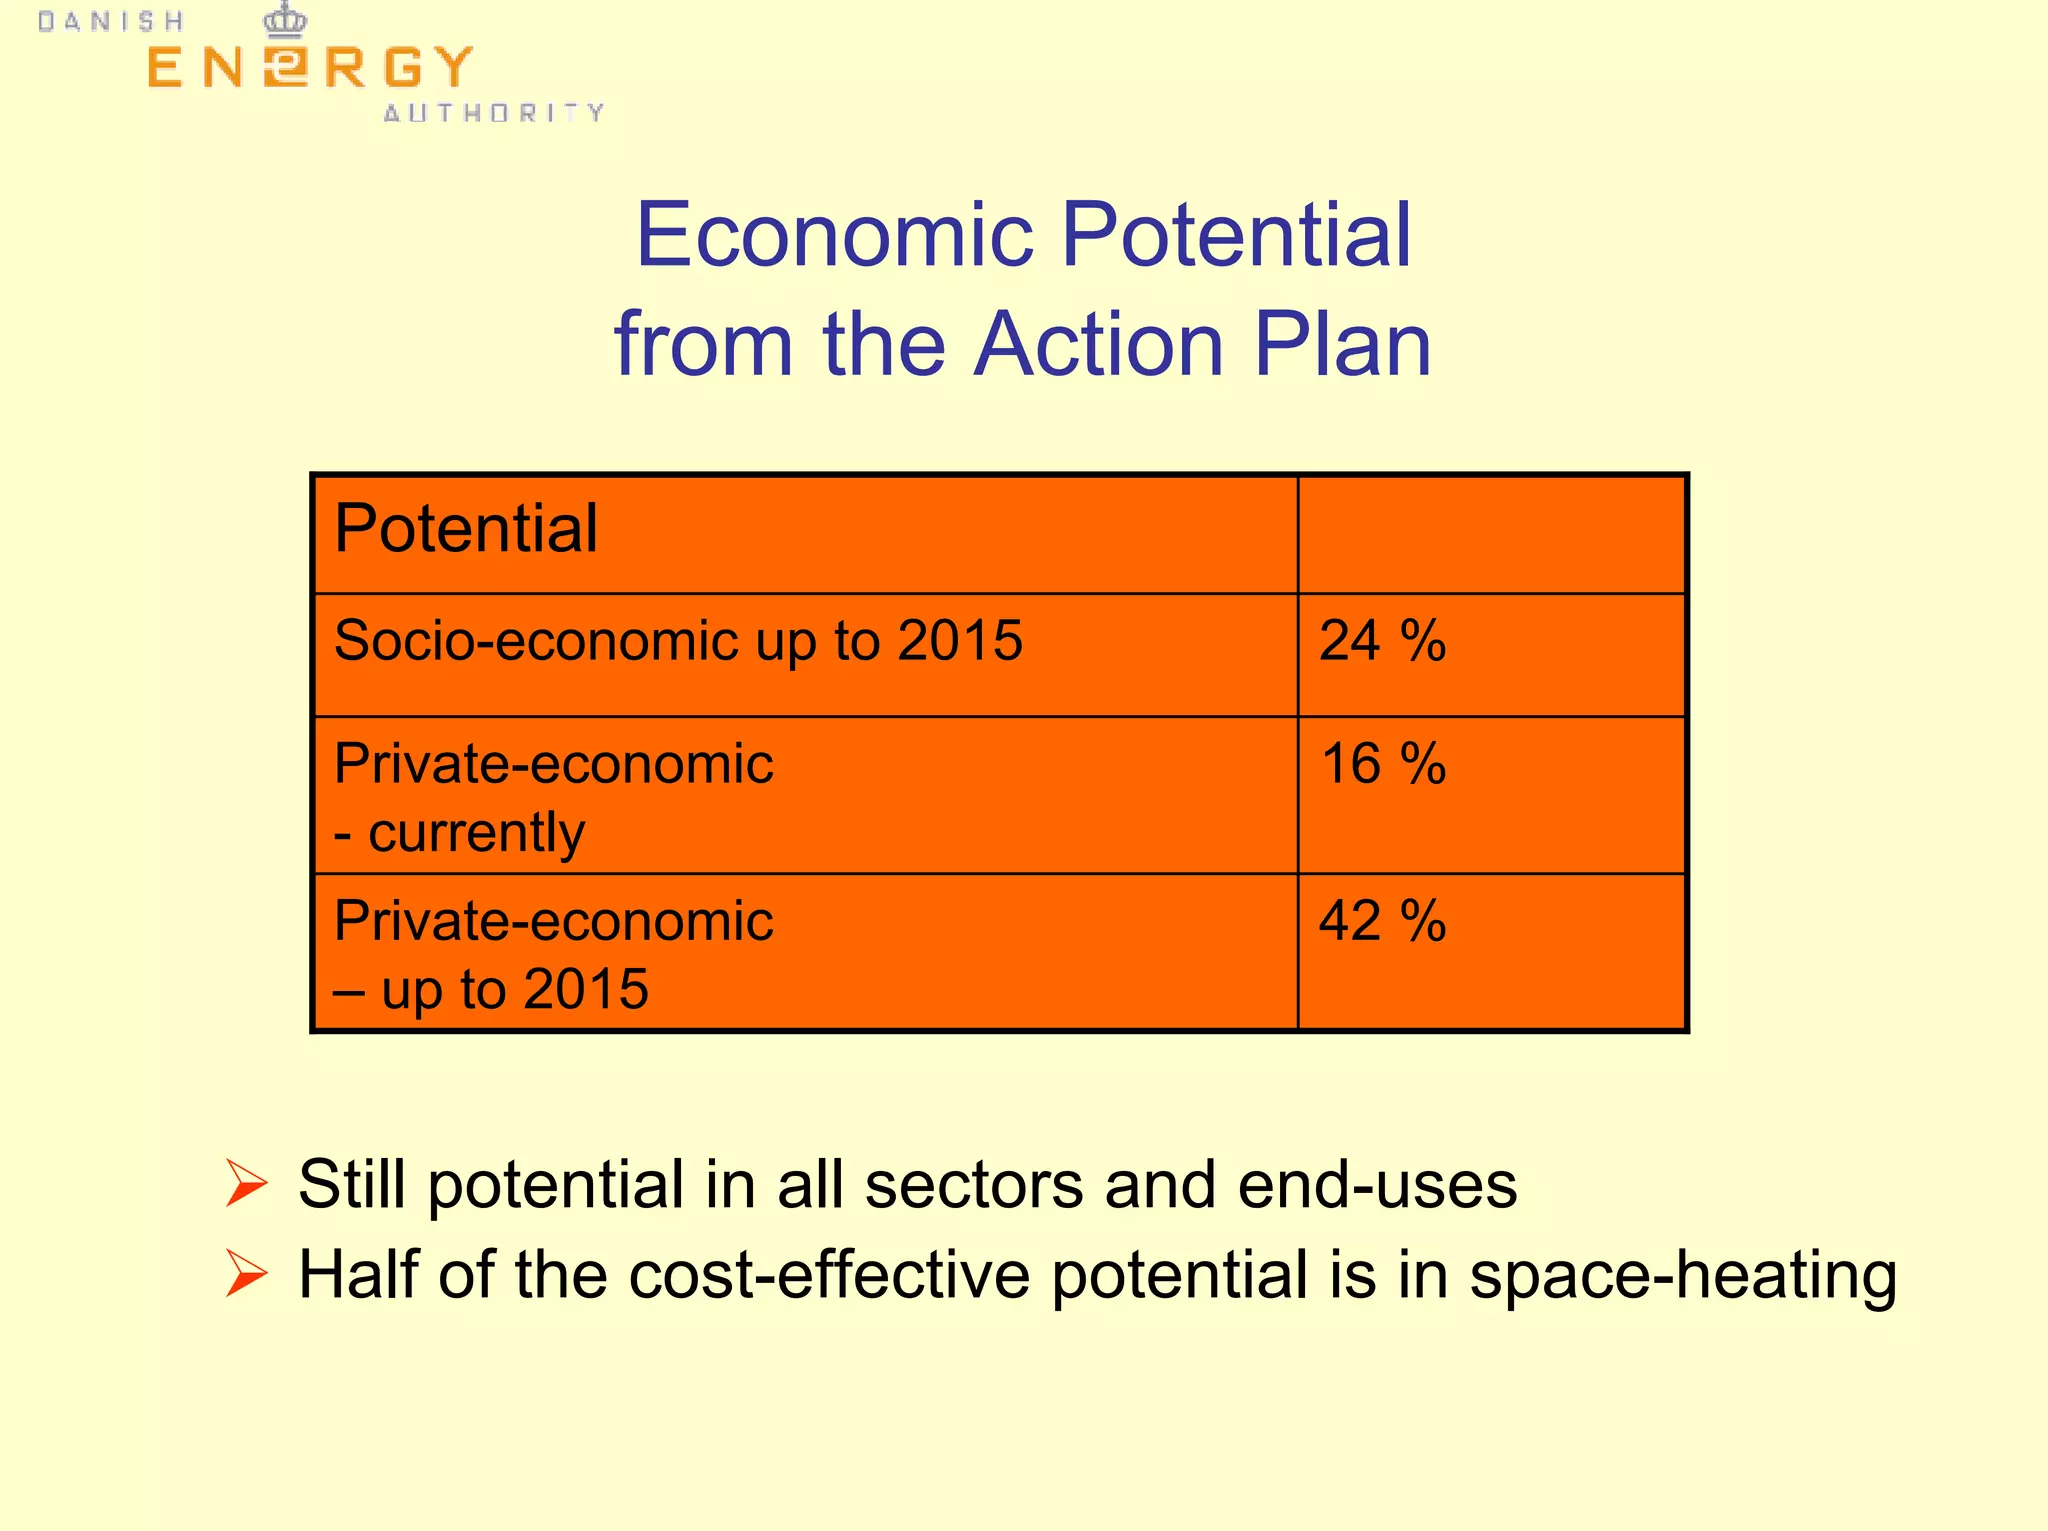
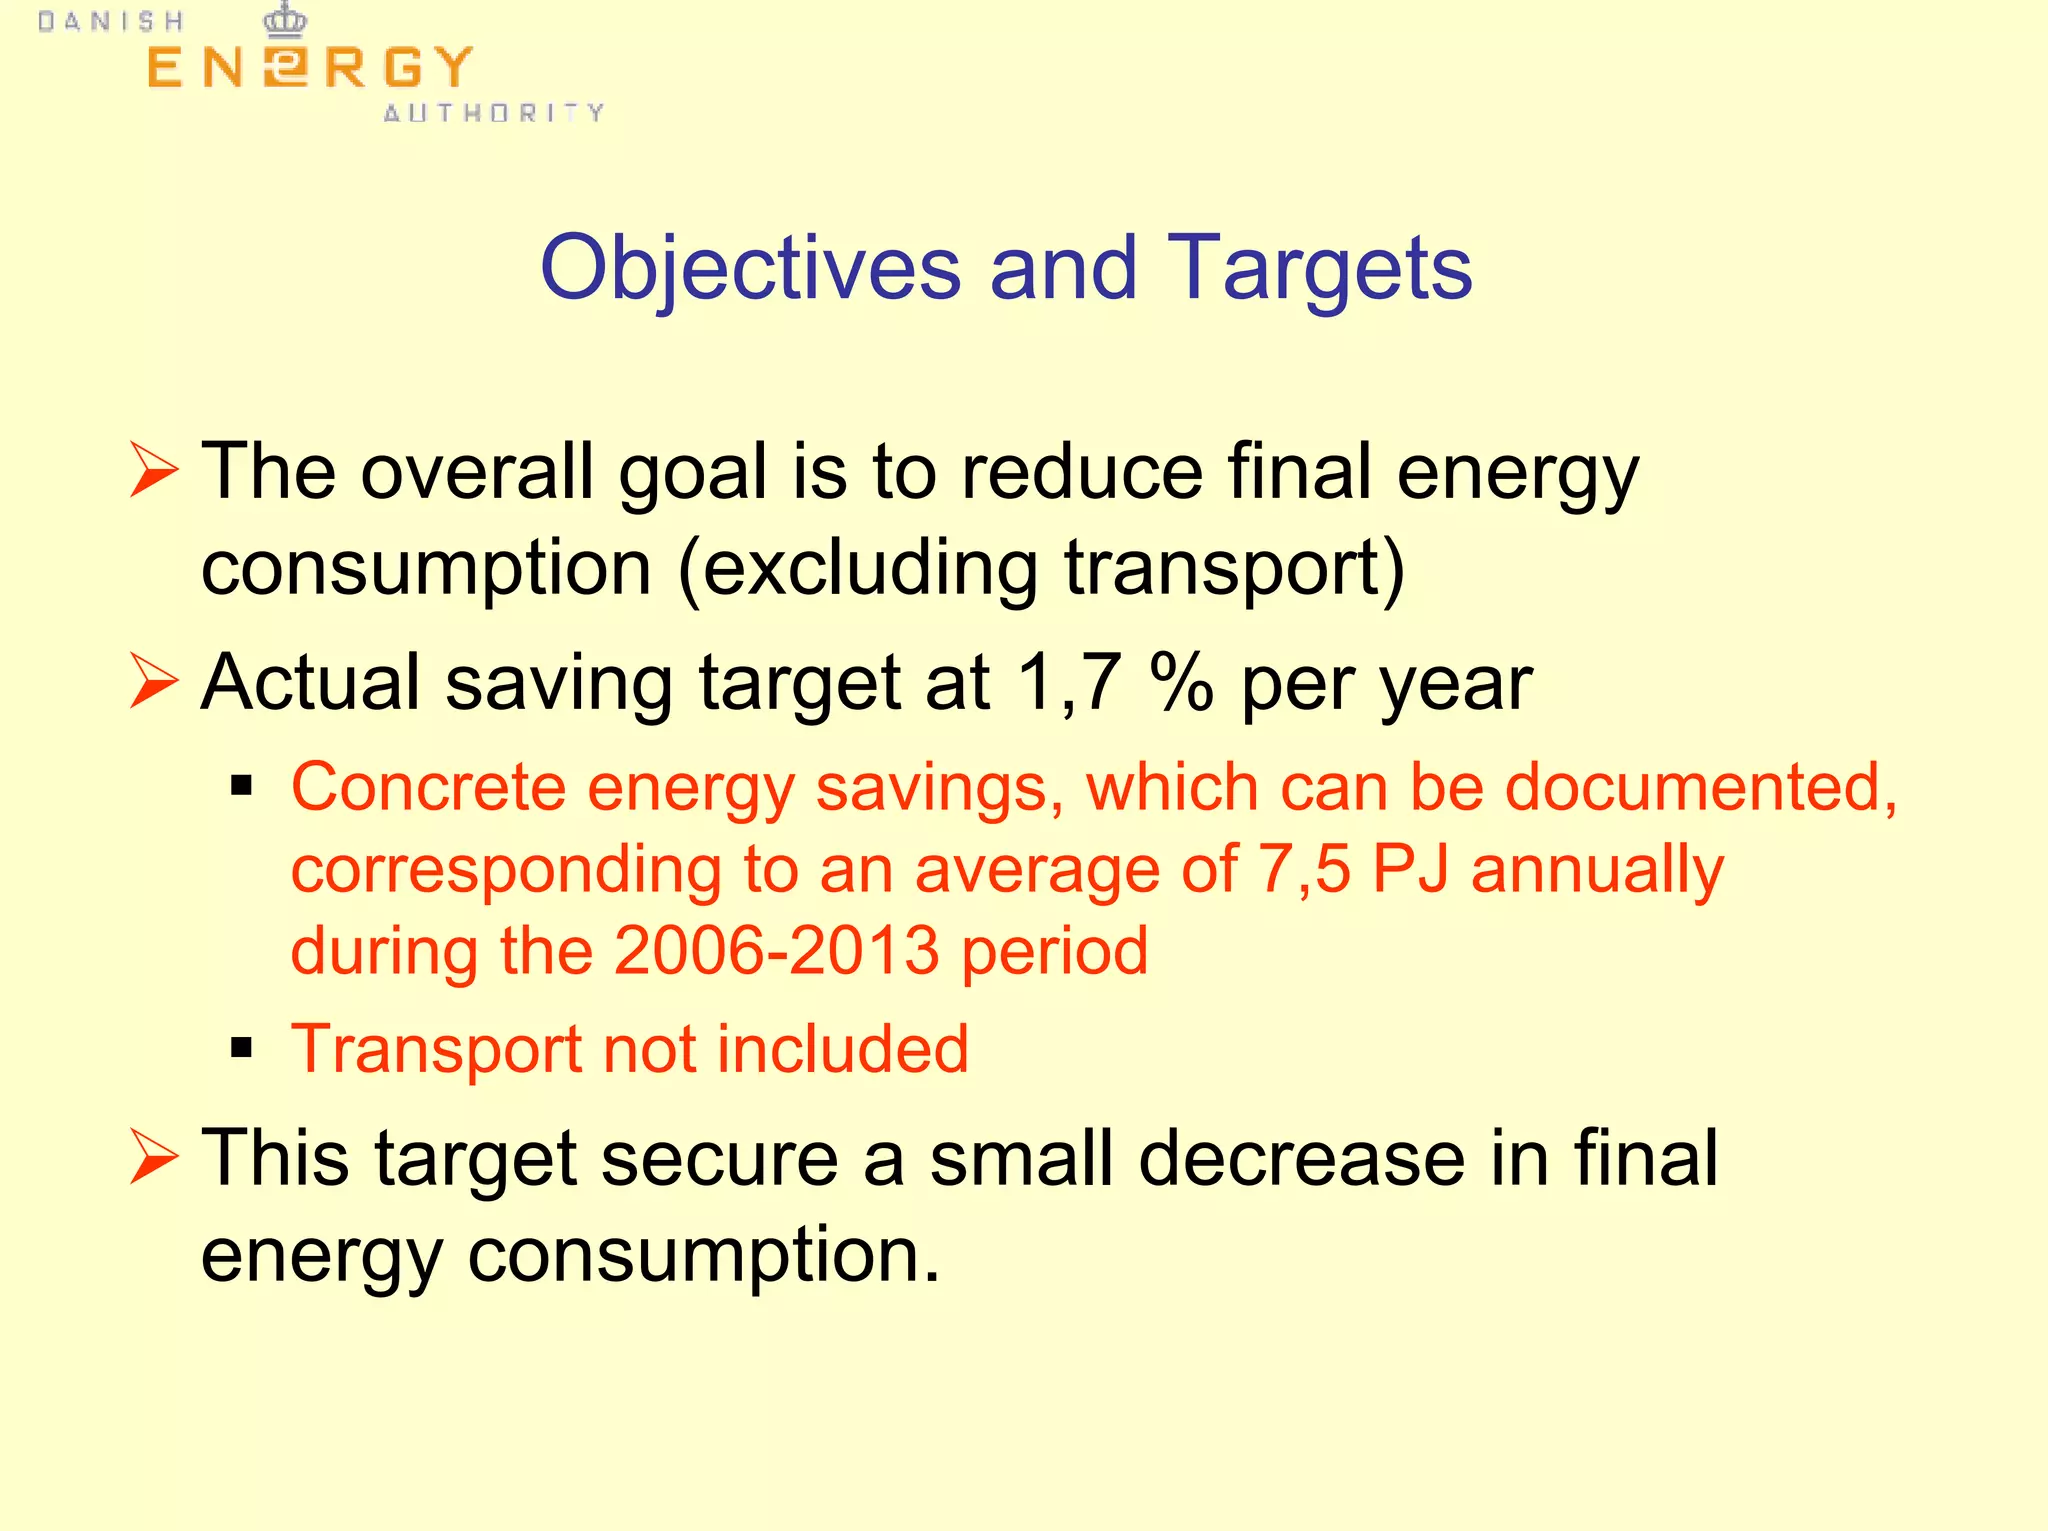
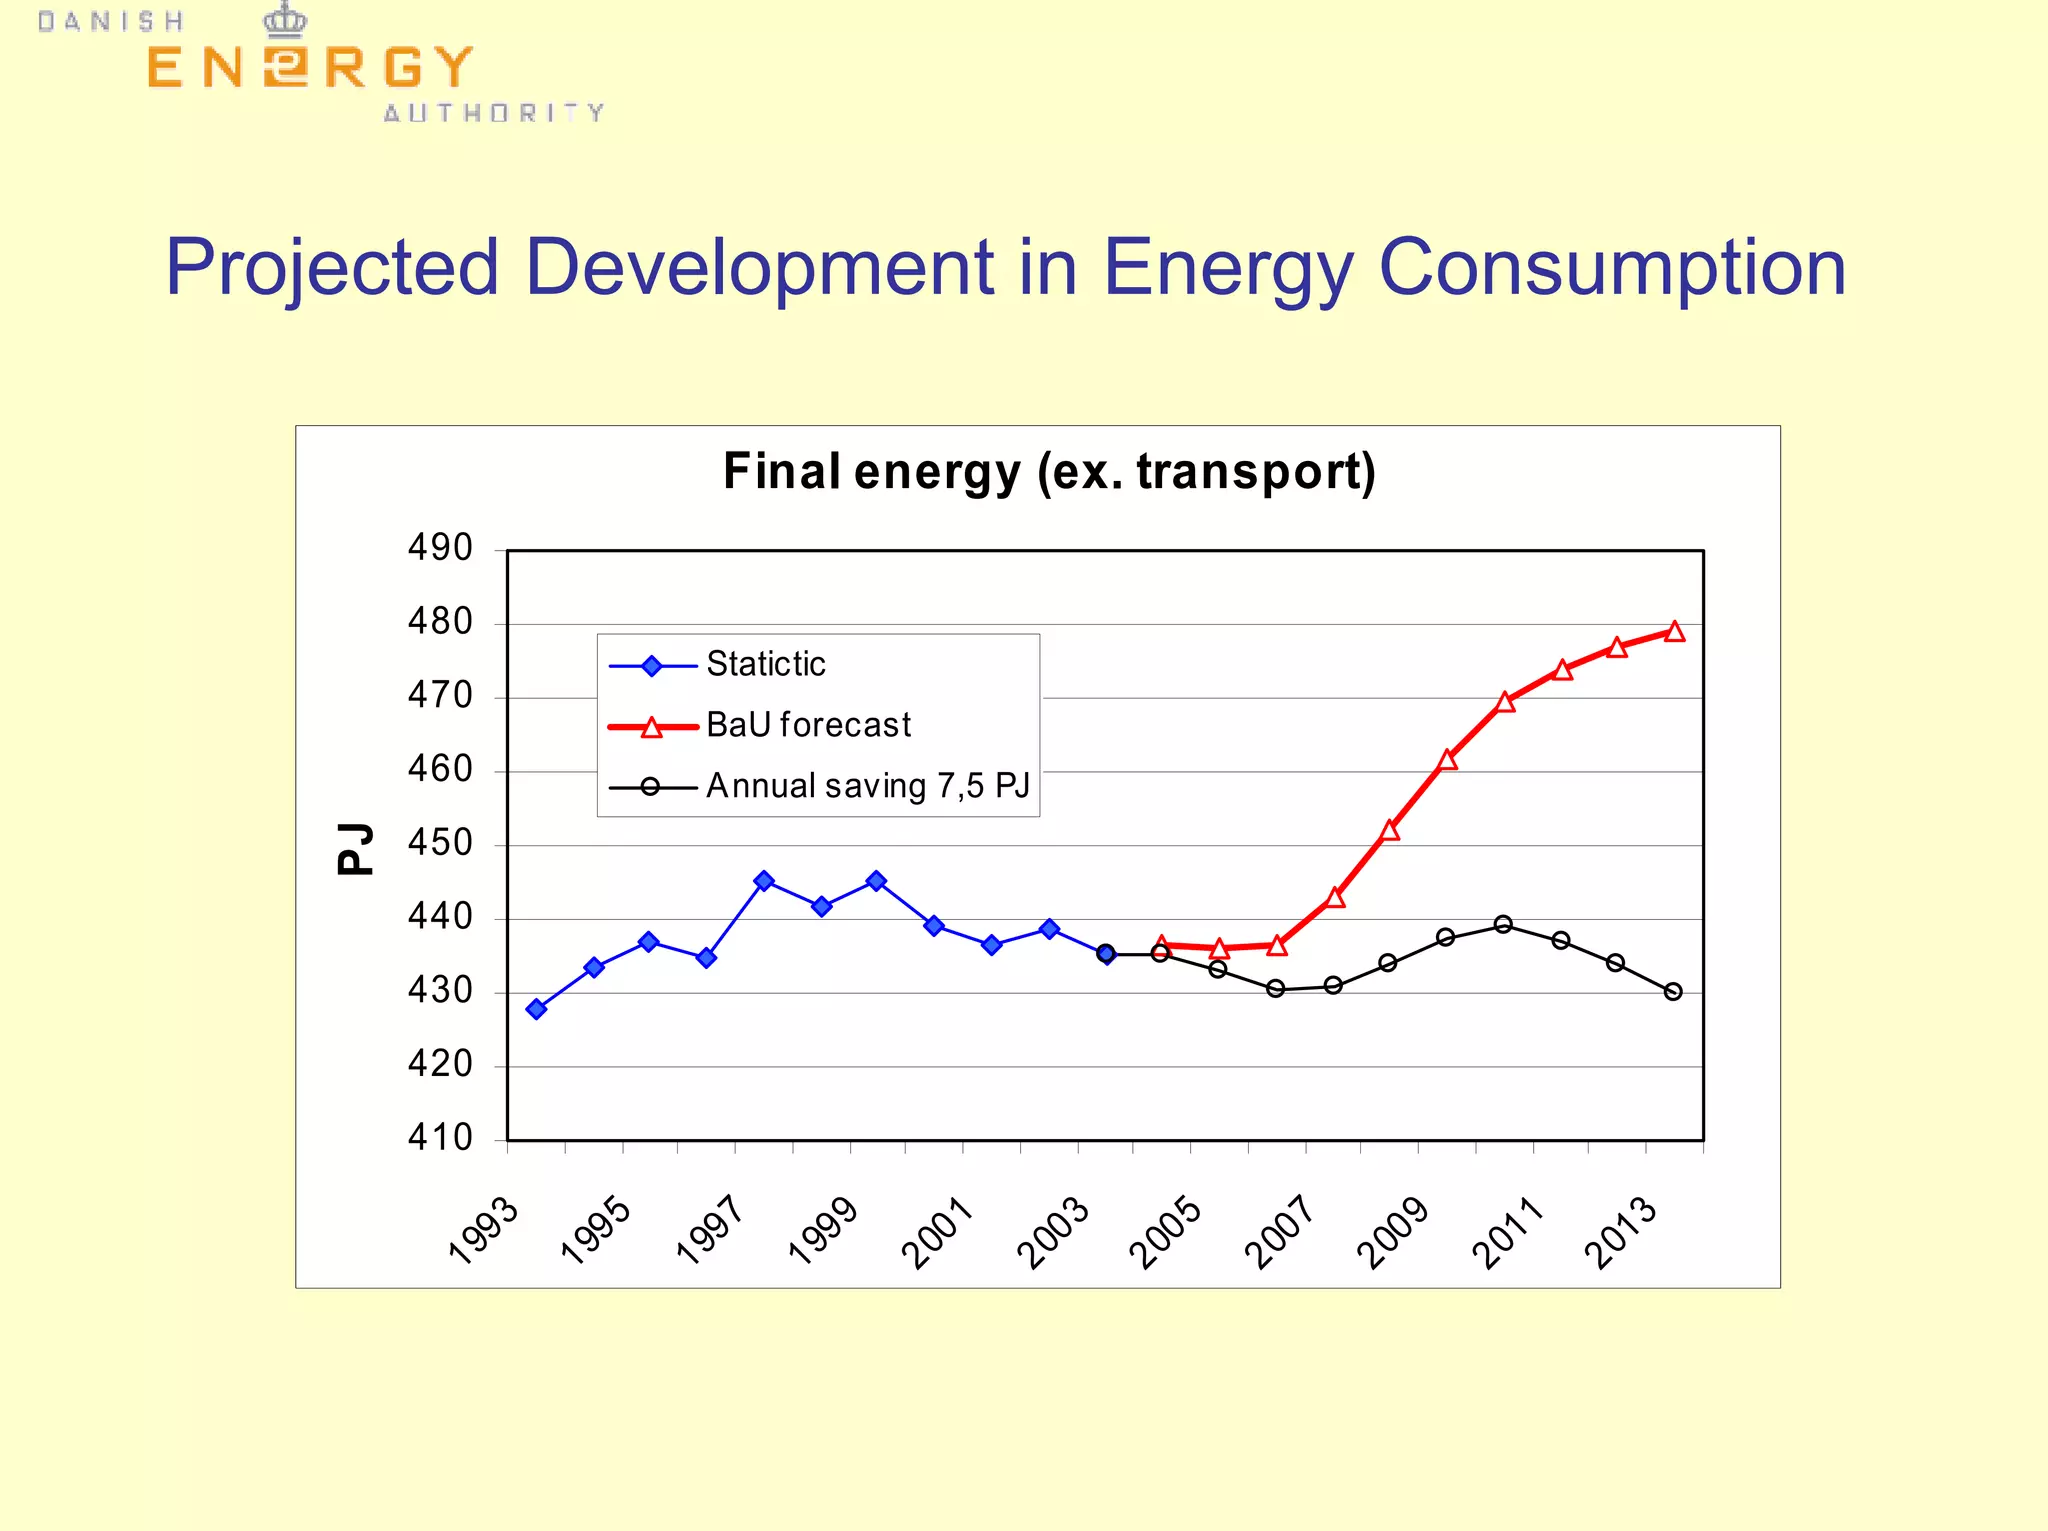
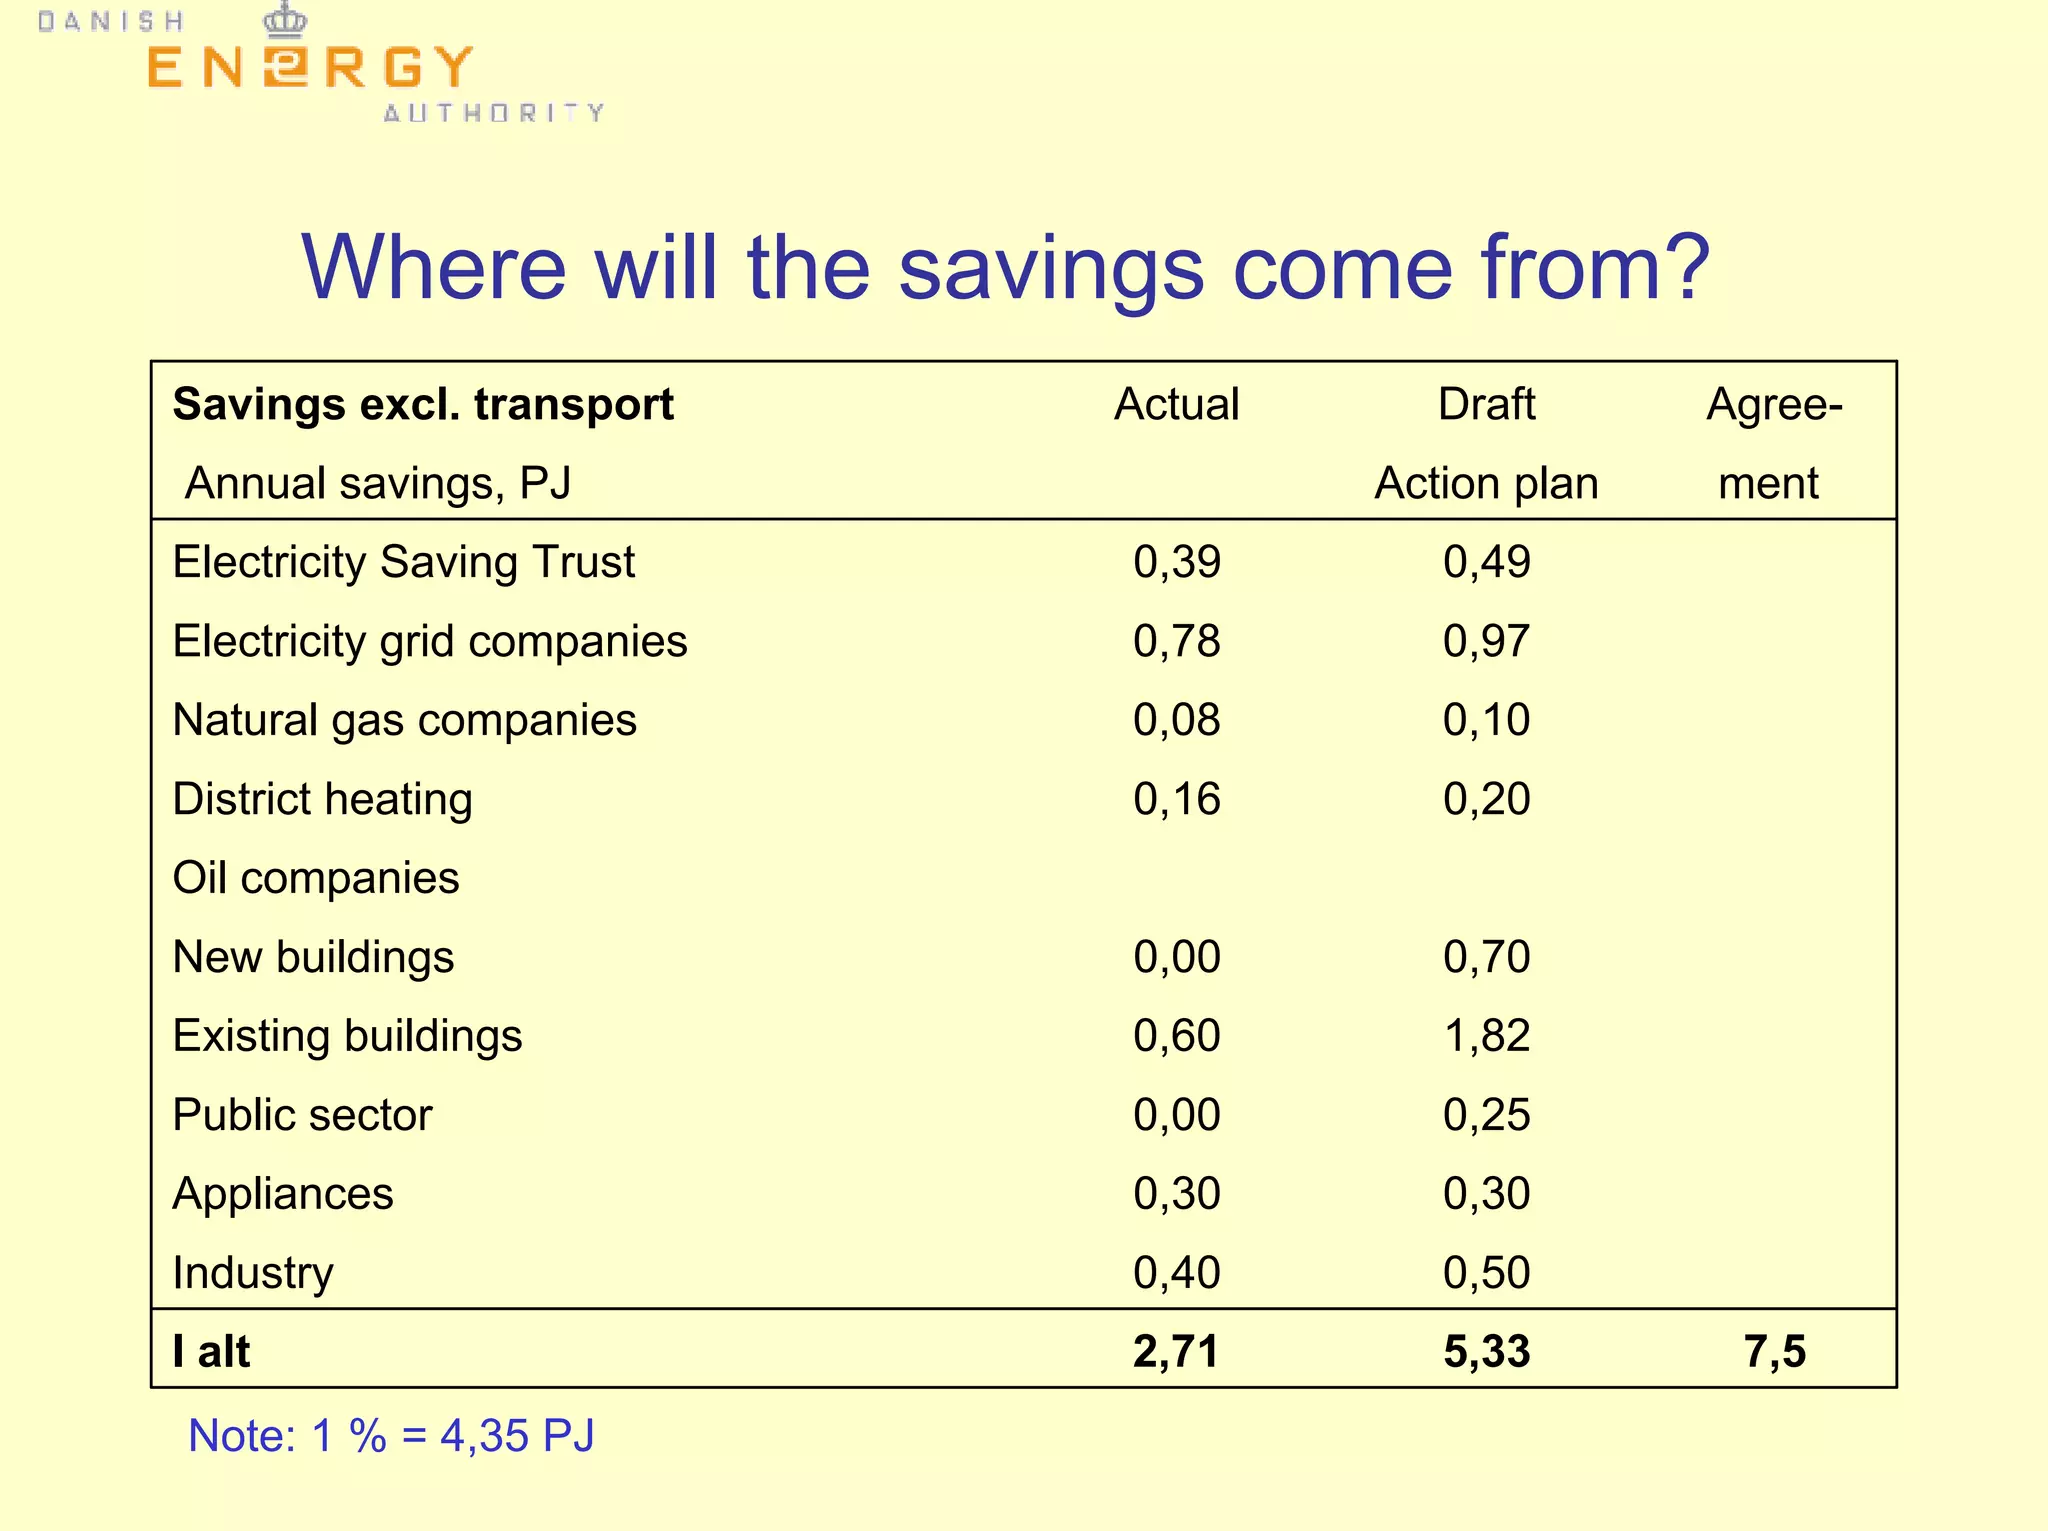

The document outlines Denmark's new structure for end-use energy efficiency activities, focusing on historical measures and political frameworks aimed at reducing final energy consumption. It highlights various efficiency measures implemented, such as energy taxes, building codes, and a broad political agreement on conservation efforts targeting a 1.7% annual reduction in energy consumption. The potential for further energy savings is emphasized, with significant opportunities in space heating and a call for policies to overcome market barriers.


