Download to read offline

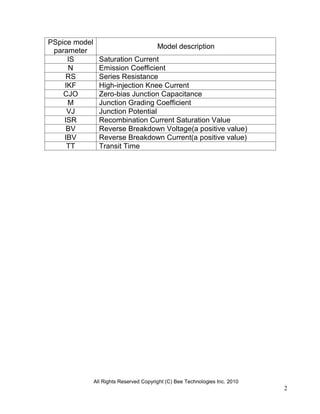
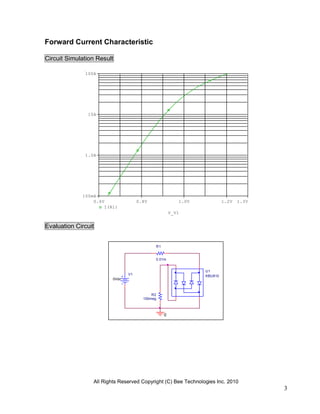
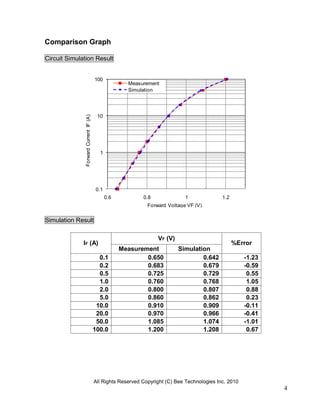
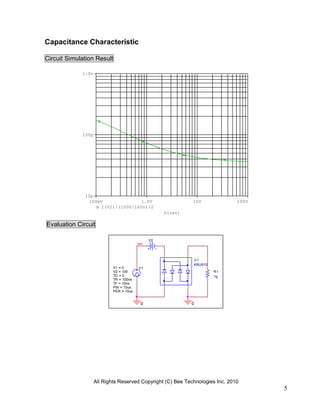
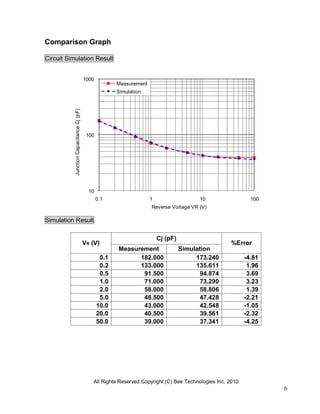
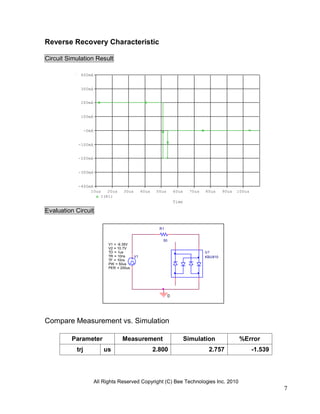
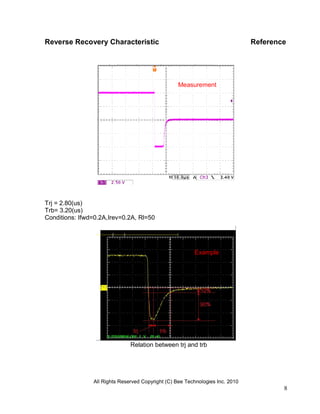

The document provides a device modeling report on the KBU810 diode and bridge rectifier, detailing its parameters, forward current characteristics, capacitance characteristics, and reverse recovery behavior. It includes simulation results compared with measurements, showing % errors for various tests. The report includes circuit simulation data and performance evaluations, with rights reserved by Bee Technologies Inc.


