Download to read offline
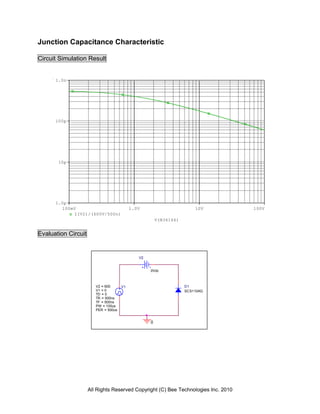
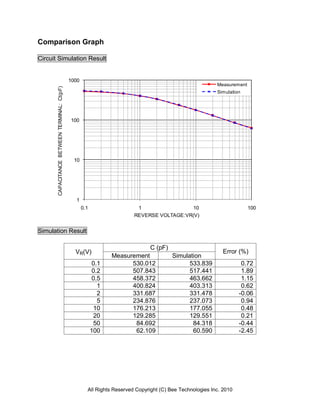
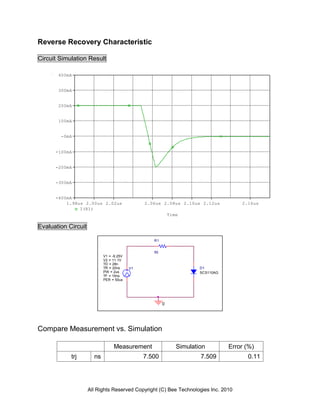
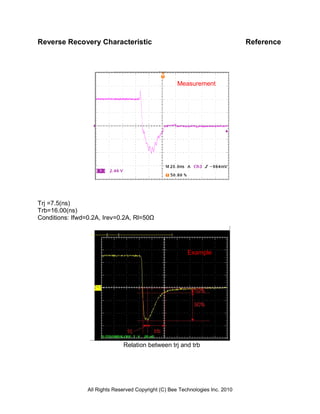

The document is a device modeling report for the silicon carbide Schottky diode SCS110AG manufactured by ROHM, detailing various specifications and performance characteristics. It includes simulation results for forward current, junction capacitance, and reverse recovery characteristics, comparing measured values against simulations. Copyright information indicates all content is protected under Bee Technologies Inc.


![5G Explained! A High Level Overview [Introduction]](https://cdn.slidesharecdn.com/ss_thumbnails/5gexplainedahighleveloverview-260119165306-cc137a3e-thumbnail.jpg?width=640&height=640&fit=bounds)


