K TO 12 TRAINING ON PRACTICAL RESEARCH 2 VERSION 2.03.pptx
1. Finding AnswersThrough DataCollection
Senior High School Teachers’ Training for the K to 12 Basic Education Program, DMMMSU-SLUC, May 28 to June 19, 2016
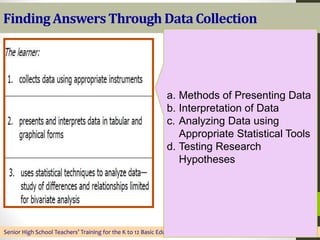
a. Methods of Presenting Data
b. Interpretation of Data
c. Analyzing Data using
Appropriate Statistical Tools
d. Testing Research
Hypotheses
2. Reportingand Sharing Findings
Senior High School Teachers’ Training for the K to 12 Basic Education Program, DMMMSU-SLUC, May 28 to June 19, 2016
a. Guidelines in Drawing
Conclusions from
Research Findings
b. Formulating
Recommendations
c. Writing the List of
References
d. Writing the Research
Report
3. Senior High School Teachers’ Training for the K to 12 Basic Education Program, DMMMSU-SLUC, May 28 to June 19, 2016
4. Senior High School Teachers’ Training for the K to 12 Basic Education Program, DMMMSU-SLUC, May 28 to June 19, 2016
5. Senior High School Teachers’ Training for the K to 12 Basic Education Program, DMMMSU-SLUC, May 28 to June 19, 2016
6. Presentation of Results
•Analyzed and summarized data can
be presented as text, or using
tables, graphs, and other pictorial
forms.
Presented data
must be interpreted!
Senior High School Teachers’ Training for the K to 12 Basic Education Program, DMMMSU-SLUC, May 28 to June 19, 2016
7. Methods of Presenting Data
Textual Method
Tabular Method
Graphical Method
Senior High School Teachers’ Training for the K to 12 Basic Education Program, DMMMSU-SLUC, May 29-June 3, June 12-24, 2017
8. Discussion of Findings
•Discussion of results/findings shall
be guided by the statement of
problems or objectives.
Senior High School Teachers’ Training for the K to 12 Basic Education Program, DMMMSU-SLUC, May 28 to June 19, 2016
9. Discussion of Findings
•There are parts and guidelines that
should be observed when
answering every problem statement
or objective of the study.
Senior High School Teachers’ Training for the K to 12 Basic Education Program, DMMMSU-SLUC, May 28 to June 19, 2016
10. 1. Prefatory Information
•Make a one paragraph introduction
of the problem. Preface the
presentation of results with a
reminder of the research questions
(or hypothesis).
Senior High School Teachers’ Training for the K to 12 Basic Education Program, DMMMSU-SLUC, May 28 to June 19, 2016
11. 2. Introduce table/chart/figure
•Make a one sentence introduction
describing the content of the table,
chart, or figure.
Senior High School Teachers’ Training for the K to 12 Basic Education Program, DMMMSU-SLUC, May 28 to June 19, 2016
12. 1. Prefatory Information
The final grade in Mathematics IV was included in
this study as part of the respondents’ profile. The data
provide information on how the respondents performed
in the said subject during their fourth year high school.
Table 2 summarizes the data in terms of the
performance of the respondents in Mathematics IV.
13.
14. 1. Prefatory Information
Prior to the conduct of the Mathematics
Training Series, the respondents performances
in terms of various parameters were evaluated
by their immediate supervisors using a
questionnaire. After the training, the same
questionnaire was administered to their
immediate supervisors to measure the change
in the performance of the respondents.
Table 2 shows the performance evaluation
of the respondents by their immediate
supervisors before and after the training.
15. 3. Discussion of critical data/
results
•Do not state what is obvious in the
table. Only highlights or important
parts of the data are textually
presented.
Senior High School Teachers’ Training for the K to 12 Basic Education Program, DMMMSU-SLUC, May 28 to June 19, 2016
16. 3. Discussion of critical data/
results
•Extract only the significant findings.
Senior High School Teachers’ Training for the K to 12 Basic Education Program, DMMMSU-SLUC, May 28 to June 19, 2016
17. It can be deduced from the table that most of the
respondents, both in the experimental and control groups,
had obtained a grade of 81 and above. A total of 85% of
the respondents from each group received a grade that
ranges from 81 to 95.
Moreover, only 3 or 15% of the respondents from
each group achieved a grade that ranges from 76-80.
18.
19. The table shows that, before the training,
leadership, responsiveness, and quality of work
are the top three best qualities of the
respondents as determined by their immediate
supervisors’ evaluation based on the computed
average weighted means equivalent to 3.9, 3.8,
and 3.7 respectively, verbally described as
“exceeds expectations”.
Senior High School Teachers’ Training for the K to 12 Basic Education Program, DMMMSU-SLUC, May 28 to June 19, 2016
20. After the training, leadership indicator is
still evident as the top strength of the
respondents which posits an average weighted
mean of 4.1. Likewise, the respondents’
creativity, and knowledge of work were
enhanced after the conduct of the Mathematics
Training Series.
The respondents exceeded the
expectations of their immediate supervisors in
all the indicated parameters after the training.
21. 3. Discussion of critical data/
results
•Descriptive equivalents/ interpretation
should be seamlessly embedded in
the discussion and not presented as
it appears in the table.
Senior High School Teachers’ Training for the K to 12 Basic Education Program, DMMMSU-SLUC, May 28 to June 19, 2016
22. Wrong: The table shows that indicator 1 which
states that “The leader is democratic” has an
average weighted mean of 4.50 which means
“very much evident” as rated by the
respondents.
Correct: The table shows that democratic
process is very much evident in the institution
and practiced by the administrator based on the
computed average weighted mean of 4.50.
Indicator Weighted
Mean
Verbal
Description
1. The leader is democratic. 4.50 Very much evident
2. The leader is autocratic. 3.09 Evident
Senior High School Teachers’ Training for the K to 12 Basic Education Program, DMMMSU-SLUC, May 28 to June 19, 2016
23. 3. Discussion of critical data/
results
•Textual presentation must be
followed by interpretation, inference,
or implication.
• Condition contributing to the result
• Cause that bring about the result
• Effect or impact of the result
• Suggestions related to the result
Senior High School Teachers’ Training for the K to 12 Basic Education Program, DMMMSU-SLUC, May 28 to June 19, 2016
24. Senior High School Teachers’ Training for the K to 12 Basic Education Program, DMMMSU-SLUC, May 28 to June 19, 2016
25. The problem solving activities helped
the respondents in the experimental
group recognize what appropriate
knowledge and skills are necessary in
solving the given problem. These
engaged students in thinking about the
important mathematical concepts and skill
they need to learn or solve the problem
[4]. Thus, they see the connections
between the previously learned
mathematical concepts and the skills
needed to solve the current problem.
Senior High School Teachers’ Training for the K to 12 Basic Education Program, DMMMSU-SLUC, May 28 to June 19, 2016
26. Because the respondents are given
enough time to work on the problem
individually, by pair, or by group, they
gradually develop understanding of the
process involved in problem solving and
they also develop confidence in doing
mathematics. Thus, problem solving
approach aids in the development of the
respondents’ critical thinking and
problem-solving skill as reflected in their
performance in the post-test.
Senior High School Teachers’ Training for the K to 12 Basic Education Program, DMMMSU-SLUC, May 28 to June 19, 2016
27. The problem-solving approach in
teaching mathematics has helped the
experimental group improved their
performance. The approach has provided
them interactive ways to learn the
necessary concepts and skills integrated
in the problem solving activities through
focused-group discussion.
Senior High School Teachers’ Training for the K to 12 Basic Education Program, DMMMSU-SLUC, May 28 to June 19, 2016
28. On the other hand, the numerical
observations in Table 5 with the performance of
the control group in the posttest showed no
remarkable improvement as compared to their
scores in the pre-test. The performance of the
control group in the pre-test and post-test are
almost the same.
This finding might have been due to the
fact that the control group was taught using the
conventional or traditional mode of instructional
delivery which is characterized by chalk and
board, more teacher talk, and less students’
participation or classroom engagement.
Senior High School Teachers’ Training for the K to 12 Basic Education Program, DMMMSU-SLUC, May 28 to June 19, 2016
29. 4. Statement of Hypotheses
•Take note that the findings and claim
come after the statement of
hypotheses.
(and acceptance/rejection of such).
Senior High School Teachers’ Training for the K to 12 Basic Education Program, DMMMSU-SLUC, May 28 to June 19, 2016
31. Wrong: When subjected to t-test analysis,
results revealed no significant difference
in the attitude towards College Algebra of
the control group as indicated by the p-
value of 0.195 which is greater than the
0.05 level of significance. Therefore, the
null hypothesis which states that there is
no significant difference in the attitude of
the control group before and after the
experiment is accepted.
Senior High School Teachers’ Training for the K to 12 Basic Education Program, DMMMSU-SLUC, May 28 to June 19, 2016
32. Correct: When subjected to t-test
analysis, the p-value of 0.000 is lower
than the 0.05 level of significance.
Therefore, the null hypothesis which
states that there is no significant
difference in the attitude towards College
Algebra of the experimental group before
and after the experiment is rejected. This
result reveals that the attitude of the
experimental group before the experiment
is significantly different to their attitude
towards College Algebra after the
experiment.
33. 5. Comparison/ Corroboration
•Compare results with previous
findings/theories to make
generalizations.
Senior High School Teachers’ Training for the K to 12 Basic Education Program, DMMMSU-SLUC, May 28 to June 19, 2016
34. Senior High School Teachers’ Training for the K to 12 Basic Education Program, DMMMSU-SLUC, May 28 to June 19, 2016
35. On the other hand, the numerical
observations in Table 5 with the performance of
the control group in the posttest showed no
remarkable improvement as compared to their
scores in the pre-test. The performance of the
control group in the pre-test and post-test are
almost the same.
This finding might have been due to the
fact that the control group was taught using the
conventional or traditional mode of instructional
delivery which is characterized by chalk and
board, more teacher talk, and less students’
participation or classroom engagement.
Senior High School Teachers’ Training for the K to 12 Basic Education Program, DMMMSU-SLUC, May 28 to June 19, 2016
36. This supports the conclusion of
Alegria [8] that nothing will change in the
performance of students if innovation is
not included in the teaching-learning
competencies, especially by the teachers.
According to her, teachers need to use
varied instructional methods, techniques,
and approaches to enhance students’
active participation and strengthen their
grasp of the important concepts and skills
related to the topic.
Senior High School Teachers’ Training for the K to 12 Basic Education Program, DMMMSU-SLUC, May 28 to June 19, 2016
37. Wrong: The study of De Villa (2010) that .
. . negates the finding of the current study.
Correct: The current study negates the
findings of De Villa (2010) that …
Senior High School Teachers’ Training for the K to 12 Basic Education Program, DMMMSU-SLUC, May 28 to June 19, 2016
38. 6. Conclusion
•Draw conclusion. Make a claim.
Explain the implication of the finding/
conclusion to the field of study or to
concerned/affected groups.
Senior High School Teachers’ Training for the K to 12 Basic Education Program, DMMMSU-SLUC, May 28 to June 19, 2016
39. • Indeed, the problem-solving approach is
effective in enhancing the performance of the
respondents in College Algebra. Thus, it is
recommended that teachers may consider
applying the approach in teaching mathematics
subjects to enhance the conceptual and
computational skills of students.
40. TESTOFDIFFERENCEINTHEATTITUDE(BEFORE
ANDAFTER)OFTHERESPONDENTSTOWARDS
COLLEGEALGEBRA
Group t-value p-value Decision
Control Group 1.343 0.195 Not Significant
Experimental
Group
7.410 0.000 Significant
• It can be concluded that the problem-solving
approach can help students strengthen their
favorable attitude towards College Algebra in
particular, and towards any fields in
Mathematics, in general.
Senior High School Teachers’ Training for the K to 12 Basic Education Program, DMMMSU-SLUC, May 28 to June 19, 2016
41. Discussion of findings/results
•Prefatory Information
•Textual presentation (highlight of the
tabular presentation of data/results)
•Interpretation
•Implication
•Corroboration
•Conclusion/Recommendation
Senior High School Teachers’ Training for the K to 12 Basic Education Program, DMMMSU-SLUC, May 28 to June 19, 2016
42. Respondents’ Profile as to Learning Styles
A questionnaire on learning style preference was
administered to the respondents to identify how they best
learn. Items which convey the same learning category
were separated from one learning style to another for the
scoring system as shown in appendix H. The learning
style which has the highest point determines how the
respondents best learn.
The table above summarizes the data on the
learning styles of the respondents.
43. Respondents’ Profile as to Learning Styles
It can be gleaned from the table that both the
experimental and control groups are composed of
learners with varying learning styles. However, it can be
noted that the two groups of respondents are dominated
by auditory learners.
Senior High School Teachers’ Training for the K to 12 Basic Education Program, DMMMSU-SLUC, May 28 to June 19, 2016
44. Respondents’ Profile as to Learning Styles
Such findings imply that most respondents of the
groups learn best through verbal lectures, discussions,
oral explanations, talking things through and listening to
what others have to say. Most of the respondents also
read any instructional materials in a loud manner, enough
to be heard by their ears.
Senior High School Teachers’ Training for the K to 12 Basic Education Program, DMMMSU-SLUC, May 28 to June 19, 2016
45. Respondents’ Profile as to Learning Styles
The current study supports the findings of Doctolero
(2011) that the group of second year high school students
which served as her respondents is composed of learners
with different styles in learning. However, the majority of
which are students who learn best through the use of their
sense of hearing.
Senior High School Teachers’ Training for the K to 12 Basic Education Program, DMMMSU-SLUC, May 28 to June 19, 2016
46. Respondents’ Profile as to Learning Styles
Because individuals have the tendency to both
perceive and process information differently, this implies
that how much individuals learn has to do with whether
the educational experience is geared toward their
particular style of learning. Thus, educators are
encouraged to place emphasis on intuition, feeling,
sensing, and imagination, in addition to the traditional
skills of analysis, reasoning and sequential problem
solving.
47. Prior to the implementation of the study, the two
groups of respondents were given an attitudinal
questionnaire that gauges their feelings towards College
Algebra. The same questionnaire was administered to
them at the end of the duration of the study. The weighted
means of their responses were compared to determine
whether or not there is an improvement in their attitude
towards the subject. The results of the comparative
analyses of the respondents attitude using paired sample
t-test through the SPSS software were reflected in table 8.
48. The table reveals that the experimental group
exhibited a significant change in their attitude towards
College Algebra. This is indicated in the t-value between
the means of their responses equivalent to -7.410 with
corresponding p-value of 0.000.
Senior High School Teachers’ Training for the K to 12 Basic Education Program, DMMMSU-SLUC, May 28 to June 19, 2016
49. Initially, the experimental group’s attitude towards
the subject falls halfway between negative and positive
acceptance. Their feeling towards College Algebra is a
balanced mix of positive and negative attitude. However
after the study, the weighted mean of the responses of the
experimental group was categorized as favorable.
Therefore, it can be noted that their attitude towards the
subject significantly improved.
Senior High School Teachers’ Training for the K to 12 Basic Education Program, DMMMSU-SLUC, May 28 to June 19, 2016
50. This result of the analysis may be attributed to the
interactive and collaborative learning environment that
was enabled by the problem solving approach in teaching
College Algebra. The experimental group was provided
with opportunities to discuss important previously learned
mathematical concepts integrated in the problem solving
activities and to brainstorm on the steps to be carried out
to arrive at the correct solutions.
Senior High School Teachers’ Training for the K to 12 Basic Education Program, DMMMSU-SLUC, May 28 to June 19, 2016
51. The approach had helped them gain mathematical
power and confidence in performing problems solving
tasks that led to the enhancement and development of a
more positive attitude towards College Algebra.
Senior High School Teachers’ Training for the K to 12 Basic Education Program, DMMMSU-SLUC, May 28 to June 19, 2016
52. On the other hand, the table further shows that the
attitude towards College Algebra of the control group did
not significantly change. It can be noted that the
computed t-value of their responses’ weighted mean
equivalent to 1.343 corresponds to p-value of 0.195 which
is higher than the level of significance of this study. This
statistics indicates that there was no significant
improvement in the attitude of the control group towards
College Algebra.
Senior High School Teachers’ Training for the K to 12 Basic Education Program, DMMMSU-SLUC, May 28 to June 19, 2016
53. Such result may have been caused by the lack of
relevant teaching intervention introduced to the group.
The control group was taught using the conventional
method of teaching mathematics where the students
serve as receiver of information. Primarily, the teacher
discusses the lesson and then provides a set of activities
to the respondents at the end of the discussion. The
group was not given opportunities for exploration,
interaction, and collaboration. Their learning environment
was dominated by the teacher.
54. On the other hand, the table further shows that the
attitude towards College Algebra of the control group did
not significantly change. It can be noted that the
computed t-value of their responses’ weighted mean
equivalent to 1.343 corresponds to p-value of 0.195 which
is higher than the level of significance of this study. This
statistics indicates that there was no significant
improvement in the attitude of the control group towards
College Algebra.
Senior High School Teachers’ Training for the K to 12 Basic Education Program, DMMMSU-SLUC, May 28 to June 19, 2016
55. The findings of the current study coincides with the
results that Farro (2014) found out in his study that
students develop a more favorable attitude towards
mathematics when they are given the opportunities to
work on a given exercise or activity with their peers.
Indeed, the problem-solving approach is effective in
enhancing and strengthening the positive attitude of the
respondents towards the subject College Algebra.
Senior High School Teachers’ Training for the K to 12 Basic Education Program, DMMMSU-SLUC, May 28 to June 19, 2016
56. Findings/Conclusions/
Recommendations
The findings of a research study should
be presented in the order of the research
questions.
The conclusions summarize the idea of
the findings. They state what the findings
imply.
The recommendations propose actions
which can be taken further as
consequences of the conclusions.
Senior High School Teachers’ Training for the K to 12 Basic Education Program, DMMMSU-SLUC, May 29-June 3, June 12-24, 2017
57. Findings/Conclusions/
Recommendations
The experimental group and the control group both have a
neutral attitude towards College Algebra before the conduct of
the study. After the conduct of the study, the experimental group
gained a favorable attitude towards the subject while the control
group retained its neutral attitude.
The experimental group gained a favorable attitude towards
College Algebra after the conduct of the study. The control
group, however, remained neutral towards the subject.
Since developing a positive attitude towards mathematics
among the students is critical for mathematics teachers, it is
necessary for teachers to have a repertoire of best teaching
practices that can be used to provide quality mathematics
instruction and to enable students to be actively engaged in the
learning process.
58. Findings/Conclusions/
Recommendations
Significant difference was posted between the attitude of the
experimental group towards College Algebra before and after
the conduct of the study. However, no significant difference was
posted between the attitudes towards College Algebra of the
control group.
The experimental group gained a more positive attitude towards
College Algebra than the control group.
The problem solving approach is a potential tool in helping
students overcome their anxiety towards mathematics subjects.
Thus, teachers may consider attending to seminars or review
educational materials that focus on the nature and procedures
in the effective implementation of the said teaching approach.
This will enable them to effectively employ the said approach in
the delivery of mathematics instruction in the classroom setting.
59. Findings/Conclusions/
Recommendations
As to the final grade in Mathematics IV, 85% of the
experimental group obtained a grade of 81 and above,
while only 5% had a grade of 76-80.
The experimental group and the control group have
passed their secondary mathematics subject and
obtained a grade point average that is higher than the
minimum passing grade.
Mathematics teachers may consider historical data
regarding the performances of their students in their
previous mathematics subjects to serve as input that will
enable them to devise a learning plan that suit best to
their learning characteristics.
Senior High School Teachers’ Training for the K to 12 Basic Education Program, DMMMSU-SLUC, May 29-June 3, June 12-24, 2017
60. Findings/Conclusions/
Recommendations
The experimental group showed that 35% of the
respondents were auditory learners, while 20% were
kinesthetic learners. Of the 30 indicators of the attitudinal
questionnaire, 80% of the items indicated a favorable
attitude of the respondents. In general, the group showed
a favorable attitude towards Geometry with their
responses’ general weighted mean of 3.65. Their final
grade in Mathematics II showed that 65% belong to 75-
79 GPA range and 35% pegged a GPA of 80 and above.
Moreover, 40% had a grade of 75 to 79; 20%, 80-84;
10%, 85-89; 5%, 90-94; and, 25% of the respondents
failed in Geometry during the second grading period.
Senior High School Teachers’ Training for the K to 12 Basic Education Program, DMMMSU-SLUC, May 29-June 3, June 12-24, 2017
61. Findings/Conclusions/
Recommendations
The experimental group had varied learning styles, yet
they are dominated by auditory learners. The group had
a favorable attitude towards Geometry. Most of the
respondents performed low in Mathematics II and in
Geometry during the second grading period.
Teachers concerned are encouraged to design their
instruction methods to consider the learning styles of the
students with their experiences, reflections,
conceptualizations and experimentations. High school
teachers may introduce a wide array of experiential
learning in the classroom teaching-learning process.
Senior High School Teachers’ Training for the K to 12 Basic Education Program, DMMMSU-SLUC, May 29-June 3, June 12-24, 2017
64. PERFORMANCE IN COLLEGE
ALGEBRA (Pretest and Posttest)
SCORE
EXPERIMENTAL GROUP CONTROL GROUP
PRETEST POSTTEST PRETEST POSTTEST
f % f % f % f %
0-10 0 0% 0 0% 1 5% 1 5%
11-20 5 25% 1 5% 15 75% 14 70%
21-30 12 60% 7 35% 3 15% 3 15%
31-40 3 15% 11 55% 1 5% 1 5%
41-50 0 0% 1 5% 0 0% 1 5%
20 100% 20 100% 20 100% 20 100%
Mean Gain Score = 7.70 Mean Gain Score = 2.75
RESPONDENTS’ PERFORMANCE IN
THE PRETEST AND POSTTEST
65. VARIABLE t-VALUE p-VALUE DECISION
Posttest 4.794 0.000 Significant
Mean Gain
Score
2.660 0.011 Significant
TEST OF DIFFERENCE IN THE
POSTTEST AND MEAN GAIN
SCORES OF THE RESPONDENTS
66. GROUP BEFORE AFTER
Control Group 3.19 Neutral 3.38 Neutral
Experimental
Group
2.83 Neutral 3.63 Favorable
ATTITUDE OF THE RESPONDENTS
TOWARDS COLLEGE ALGEBRA
67. GROUP t-VALUE p-VALUE DECISION
Control Group 1.343 0.195 Not Significant
Experimental
Group
7.410 0.000 Significant
TEST OF DIFFERENCE IN THE
ATTITUDE OF THE RESPONDENTS
TOWARDS COLLEGE ALGEBRA
71. Situations
1. Miss Phoebe teaches Mathematic to Language
students. She observed that her students are very
passive, not participative, and are seemingly not
interested with the subject. Help Miss Phoebe
solve her problem so that she will not encounter
the same concerns in the future.
2. Propose any research study that is related to the
implementation of the K to 12 Basic Education
program which provides baseline information for
curriculum developers in enhancing the current
basic education program.
Senior High School Teachers’ Training for the K to 12 Basic Education Program, DMMMSU-SLUC, May 29-June 3, June 12-24, 2017
72. Situations
3. Mr. Matt believes that social media and
technologies are relevant in the 21st century
teaching and learning process. Prove his
assumption by proposing a research study.
4. As a Senior High School teacher, you are
considered a generalist hence you will teach
subjects aside from your expertise. Propose a
study that assesses the effectiveness of this
measure in achieving the prescribed learning
competencies among the students in every SHS
subject.
Senior High School Teachers’ Training for the K to 12 Basic Education Program, DMMMSU-SLUC, May 29-June 3, June 12-24, 2017
73. Proposed Research Study
Research Title
Statement of the Problems
Hypotheses
Research Design
Population and Sample
Scope and Delimitation
Data-Gathering Instruments
Senior High School Teachers’ Training for the K to 12 Basic Education Program, DMMMSU-SLUC, May 29-June 3, June 12-24, 2017