Every clinical trial is a source of multidimensional data, analyzed to answer questions on safety, efficacy and others. Invalid or incomplete data may lead to invalid conclusions and wrong decision. KCR’s Biostatistician, Adrian Olszewski, highlights the importance of cooperation between data management and biostatistics to improve data quality by introducing both statistical knowledge and the ability to create specialized, programmatic tools and advanced queries giving a good foundation for deeper and faster data investigations. Read more in the article published in the October Issue of Journal for Clinical Studies (p. 42-46).
As per EU MDR, Post Marketing Clinical Follow-up (PMCF) is a continuous process where device manufacturers need to proactively collect and evaluate clinical data of the device when it is used as per the intended purpose. EU MDR gives more emphasize on PMCF data to confirm the safety and performance of the device throughout its expected lifetime, ensure continued acceptability of identified risks and detect emerging risks based on factual evidence.
clinical data management in clinical research, helpful for pharmacy, nursing, medical, health care providers, clinical research organization, PharmD, CROs, Clinical trial industry, human biomedical research.
Clinical research and clinical data management - Ikya Globalikya global
Data management functions in clinical trials—extensive data cleaning, full query management, protocol deviation management, batch processing, as examples—have traditionally been served by stand-alone clinical data management systems (CDMS), whose input is from paper forms or from separate electronic data capture systems. Distinct electronic data capture and data management systems require data integration, with resulting timing and reconciliation issues.
The impact of electronic data capture on clinical data managementClin Plus
electronic data capture (EDC)-based clinical trials offer operational and cost-effective approaches for ongoing data entry via the Internet for clinical sites; medical monitoring; monitoring by clinical research associates including initial review. Pharmaceutical, biotechnology, and medical device industry, as well as academia and the government, have all begun to adopt EDC as a new data management tool.
A presentation given at the Duke Margollis Health Policy meeting in 2015 and providing insights into the current challenges related to EHR data quality. Proposes a new approach - OneSource.
Hirshberg promise of digital technology astra_zenecaThe Promise of Digital Te...Levi Shapiro
Presentation by Boaz Hirshberg, VP, Clinical Development, Cardiovascular, Renal, Metabolic Disease at AstraZeneca
- The Promise of Digital Technology in Drug Development Clinical Trials. Includes the following:
- The vision for patient-centric medical care delivery
- End-to-end patient experience enhanced by digital technologies
- Digital technologies have a potential to transform clinical trial & medical care delivery
- Example: transforming our understanding of Type 2 diabetes with remote patient monitoring
- Frequent sampling demonstrates glucose lowering very soon after first dose, which might be unappreciated in typical trial design
- Multiple data points reduce uncertainty about the glucose outcome and enable future machine learning of unanticipated relationships
- Lessons learned from CGM pilot: data storage, transfer, and analysis
- Defining the clinical science questions to be answered
- Operational considerations for incorporating digital data into clinical development
- Addressing challenges of digital technologies’ disruption
Will I see you in Philadelphia next week? In case you don’t already know, I’ve been invited to speak at CBI’s Risk-Based Trial Management and Monitoring Conference.
I’m going to be sharing real world, pragmatic guidance that you can implement immediately to effectively influence your clinical trial performance.
My presentation, Practical Usage of KRIs and QTLs in Clinical Trials, will take place next Thursday, November 14th at 9:45am. I’m going to share with you:
• How to identify and close the gaps between risks and KRIs
• What the difference is between KRIs and QTLs, and how to use them effectively
• Useful examples of Centralized Monitoring findings from open data
• How to detect, combat and prevent fraud and sloppiness at an early stage
• How AI and ML advance risk-based approaches
So I can’t wait to see you at this informative and fun-filled industry expert forum,
– Artem Andrianov, CEO Cyntegrity
TRI was founded as a subsidiary of Triumph Consultancy Services in 2013, following 12 years of consulting to the clinical trial industry. TRI has been evaluating the specific challenges facing the industry when implementing a risk-based monitoring strategy and the various approaches and products being utilized by organizations as they move into the RBM arena. This paper aims to summarize our findings and provide guidance as to how the main challenges can be overcome.
A white paper on fraud detection methods implemented in MyRBQM Portal's ecosystem. In clinical research a large amount of clinical data is being captured. During data acquisition human errors happen and negatively impact the quality of clinical data. Unintentional (sloppiness) or intentional (fraud) misconduct introduces patient safety risks and non-compliance.
Machine learning, health data & the limits of knowledgePaul Agapow
Lecture for Imperial College London's MSc in Health Data Analytics, critiquing a recent paper on COVID diagnosis and moving out to talk about good practices (& limits) in ML and model building
Dale W. Usner, Ph.D., President of SDC, co-authored the article "The Clinical Data Management Process," which was published in the November/December 2014 issue of Retina Today.
The article reviews the clinical data management (CDM) process in its entirety - from protocol review and CRF design through database lock. Describing the roles of various CDM team members and tips for efficient data management practices, "The Clinical Data Management Process" provides a comprehensive yet concise summary of this essential function in clinical trial research, specifically with respect to retina trials.
Presentation on how past medical records can be used to provide appropriate and timely treatment for patients using Genetic Algorithm and Feature Selection
Using Investigative Analytics to Speed New Drugs to MarketCognizant
Investigative analytics - covering exploratory data analysis (EDA) and inferential statistics - is a powerful, data-driven methodology for uncovering discrepancies in reports from clinical trials, and thus can help streamline and improve the trial process and accelerate the transition from molecule to medicine.
Who needs fast data? - Journal for Clinical Studies KCR
How “no news” during the life of a trial is bad news, and what data management (among other things) can do to help when ensuring access to fast data? Get to know this and more about smart e-solutions in the newest article of Kaia Koppel, Associate Director, Biometrics & Clinical Trial Data Execution Systems at KCR, in the recent issue of Journal for Clinical Studies (p.40-21).
An efficient feature selection algorithm for health care data analysisjournalBEEI
Diabete is a silent killer, which will slowly kill the person if it goes undetected. The existing system which uses F-score method and K-means clustering of checking whether a person has diabetes or not are 100% accurate, and anything which isn't a 100% is not acceptable in the medical field, as it could cost the lives of many people. Our proposed system aims at using some of the best features of the existing algorithms to predict diabetes, and combine these and based on these features; This research work turns them into a novel algorithm, which will be 100% accurate in its prediction. With the surge in technological advancements, we can use data mining to predict when a person would be diagnosed with diabetes. Specifically, we analyze the best features of chi-square algorithm and advanced clustering algorithm (ACA). This research work is done using the Pima Indian Diabetes dataset provided by National Institutes of Diabetes and Digestive and Kidney Diseases. Using classification theorems and methods we can consider different factors like age, BMI, blood pressure and the importance given to these attributes overall, and singles these attributes out, and use them for the prediction of diabetes.
MULTI MODEL DATA MINING APPROACH FOR HEART FAILURE PREDICTIONIJDKP
Developing predictive modelling solutions for risk estimation is extremely challenging in health-care
informatics. Risk estimation involves integration of heterogeneous clinical sources having different
representation from different health-care provider making the task increasingly complex. Such sources are
typically voluminous, diverse, and significantly change over the time. Therefore, distributed and parallel
computing tools collectively termed big data tools are in need which can synthesize and assist the physician
to make right clinical decisions. In this work we propose multi-model predictive architecture, a novel
approach for combining the predictive ability of multiple models for better prediction accuracy. We
demonstrate the effectiveness and efficiency of the proposed work on data from Framingham Heart study.
Results show that the proposed multi-model predictive architecture is able to provide better accuracy than
best model approach. By modelling the error of predictive models we are able to choose sub set of models
which yields accurate results. More information was modelled into system by multi-level mining which has
resulted in enhanced predictive accuracy.
Automatic missing value imputation for cleaning phase of diabetic’s readmissi...IJECEIAES
Recently, the industry of healthcare started generating a large volume of datasets. If hospitals can employ the data, they could easily predict the outcomes and provide better treatments at early stages with low cost. Here, data analytics (DA) was used to make correct decisions through proper analysis and prediction. However, inappropriate data may lead to flawed analysis and thus yield unacceptable conclusions. Hence, transforming the improper data from the entire data set into useful data is essential. Machine learning (ML) technique was used to overcome the issues due to incomplete data. A new architecture, automatic missing value imputation (AMVI) was developed to predict missing values in the dataset, including data sampling and feature selection. Four prediction models (i.e., logistic regression, support vector machine (SVM), AdaBoost, and random forest algorithms) were selected from the well-known classification. The complete AMVI architecture performance was evaluated using a structured data set obtained from the UCI repository. Accuracy of around 90% was achieved. It was also confirmed from cross-validation that the trained ML model is suitable and not over-fitted. This trained model is developed based on the dataset, which is not dependent on a specific environment. It will train and obtain the outperformed model depending on the data available.
Classification Scoring for Cleaning Inconsistent Survey DataCSCJournals
Data engineers are often asked to detect and resolve inconsistencies within data sets. For some data sources with problems, there is no option to ask for corrections or updates, and the processing steps must do their best with the values in hand. Such circumstances arise in processing survey data, in constructing knowledge bases or data warehouses [1] and in using some public or open data sets.
The goal of data cleaning, sometimes called data editing or integrity checking, is to improve the accuracy of each data record and by extension the quality of the data set as a whole. Generally, this is accomplished through deterministic processes that recode specific data points according to static rules based entirely on data from within the individual record. This traditional method works well for many purposes. However, when high levels of inconsistency exist within an individual respondent's data, classification scoring may provide better results.
Classification scoring is a two-stage process that makes use of information from more than the individual data record. In the first stage, population data is used to define a model, and in the second stage the model is applied to the individual record. The author and colleagues turned to a classification scoring method to resolve inconsistencies in a key value from a recent health survey. Drawing records from a pool of about 11,000 survey respondents for use in training, we defined a model and used it to classify the vital status of the survey subject, since in the case of proxy surveys, the subject of the study may be a different person from the respondent. The scoring model was tested on the next several months' receipts and then applied on a flow basis during the remainder of data collection to the scanned and interpreted forms for a total of 18,841 unique survey subjects. Classification results were confirmed through external means to further validate the approach. This paper provides methodology and algorithmic details and suggests when this type of cleaning process may be useful.
The process of data cleaning involves the process of transformation of data from a raw format to a format that is compatible with your and use case.
Read More: https://expressanalytics.com/blog/growing-importance-of-data-cleaning/
MedTech clinical data collection problems have been found throughout our ten years of work with over 250 medical device studies from across the globe. We keep running across these seven hazards while working in the MedTech business and clinical operations.
Streamlining Data Accuracy for Precision in R&D.pptxMocDoc
Discover how to streamline data accuracy in your R&D process using lab software for enhanced precision. Learn effective strategies to improve data integrity, reduce errors, and optimize research outcomes with the help of advanced lab software solutions. Maximize the potential of your research and development efforts with data-driven insights and seamless integration of lab software.
Data Management and Analysis in Clinical Trialsijtsrd
Data management and analysis play a critical role in the successful conduct of clinical trials. Proper collection, validation, and handling of data are essential for ensuring the reliability and integrity of study findings. Data management involves the design and implementation of data capture tools, such as electronic case report forms eCRFs, to efficiently collect and store clinical data. Additionally, data analysis is a crucial step that involves applying statistical methods to extract meaningful insights from the collected data. This paper provides an overview of the key components of data management and analysis in clinical trials, highlighting the importance of adherence to data standards, ensuring data quality, and maintaining data security. Effective data management and analysis not only lead to robust study outcomes but also contribute to the overall advancement of medical knowledge and patient care. S. Reddemma | Chetana Menda | Manoj Kumar "Data Management and Analysis in Clinical Trials" Published in International Journal of Trend in Scientific Research and Development (ijtsrd), ISSN: 2456-6470, Volume-7 | Issue-4, August 2023, URL: https://www.ijtsrd.com/papers/ijtsrd59667.pdf Paper Url:https://www.ijtsrd.com/pharmacy/pharmacology-/59667/data-management-and-analysis-in-clinical-trials/s-reddemma
Journal for Clinical Studies: The Changing Organisation and Data Management R...KCR
The wide range of data collection and management tasks has changed to better align with advancements in technology. Read KCR’s Joette Keen, Head of BMX, article on resource data management (DM) roles revisited for new optimisation, published in June issue of the Journal for Clinical Studies (p.44-45).
International Pharmaceutical Industry: Innovations in the PASS ConceptKCR
Read Magdalena Matusiak, KCR’s Pharmacovigilance Team Lead, review about the present regulatory and scientific approach to PAS studies. The article on innovations in the PASS concept has been published in the summer edition of International Pharmaceutical Industry magazine (p.28-31).
Journal for Clinical Studies: Examination of Roles in Data Management in Clin...KCR
With the development, implementation and gradual evolution of IT systems, the clinical research industry had undergone years of ever-narrowing specialization. Kaia Koppel, Senior Clinical Data Manager at KCR and Martin Noor, Clinical Data Manager at KCR, propose a piece discussing how changes in the digital environment also meant changes in classical ‘clinical data management’ activities, as they became more and more prevalent across all operational levels within the industry. Part 2 of the article on resource organization as a key to achieve efficiency was published in August issue of the Journal for Clinical Studies. (p.18-20)
European Pharmaceutical Review: Trials and Errors in NeuroscienceKCR
With many shifts in legislature, and advances in science and technology affecting clinical development in neurology and its clinical studies, it has never been more important to stay up to date with the latest regulations and trends
European Pharmaceutical Contractor: SAS and R Team in Clinical ResearchKCR
Statistical analysis constitutes an essential part of every serious scientific research. Without data and a formal process of searching for evidences supporting or disproving stated hypotheses, there is nothing but mere opinion. Evidence-based medicine is no exception
International Pharmaceutical Industry: Feasibility Is Not (Anymore) A Plain S...KCR
Investigational Sites
The sole term ‘feasibility’ has multiple definitions in a clinical environment, leading to certain bias with all stakeholders involved, including pharma companies (sponsors) and all types of contract research organizations (CROs). The most common perception is related to a never-ending argument between pharma outsourcing departments and CRO commercial groups, with sponsors expecting CROs to run a (non-defined) feasibility study prior to proposal submission and CROs undertaking a series of schematic actions to create an impression of fulfilled expectation.
KCR features in the newest Pharma Voice, June 2017, top industry publication. Andrzej Piotrowski, MD, Ph.D., Medical Monitor at KCR, commented on malaria treatment and research.
KCR’s Piotr Piotrowski, Magdalena Czarnecka and Anna Baran talk about placebos, a key component of many clinical trials, and the ethics behind, in the European Pharmaceutical Contractor (EPC) magazine, Autumn 2017.
IPI - Developing Global Solutions for Product SafetyKCR
In the International Pharmaceutical Industry magazine, Autumn 2017, KCR’s Magdalena Matusiak, Quality Assurance & Compliance, describes recent changes in EU requirements and talks about new directions in PV globalization.
KCR: Post-Authorisation Safety Studies (PASS) - Is the Ongoing Surveillance a...KCR
Post-Authorisation Safety Studies (PASS)
Is the Ongoing Surveillance a Blessing Or a Curse?
28th DIA EuroMeeting
7 April 2016, Hamburg, Germany
Magdalena Matusiak, MPharm
Manager, Clinical Development
Pharmacovigilance Team Lead, KCR
As an expert provider of a wide spectrum of clinical development support services, KCR has developed
a supreme Data Management (DM) solution geared towards full data transparency as well as
delivering the highest level of quality within the defined timelines and in adherence to study budgets,
all the while ensuring the meeting of all Good Clinical Practice (GCP) and ICH requirements. Read our DM brochure and learn more about KCR DM capabilities.
KCR: Recent Evolution of Regulatory Framework in EuropeKCR
Recent Evolution of Regulatory Framework in Europe
Clinical trials of medicinal products in Ukraine Conference
19 November 2015, Kiev, Ukraine
Magdalena Matusiak, MPharm
Manager, Clinical Development
Pharmacovigilance Team Lead, KCR
Prostate Cancer - Current Approach and Future Perspective in Castration-Resis...KCR
Prostate carcinoma is one of the most commonly diagnosed solid tumours in males worldwide. Selection of the treatment method is strictly dependent upon disease stage and the patient’s age. Availability of diagnostic tests is constantly increasing in clinical practice, allowing early diagnosis and better chances for complete and permanent recovery. In the case of locally advanced prostate carcinoma, radical surgery or radiotherapy is considered as the most effective therapeutic approach, whereas in metastatic prostate carcinoma, hormone therapy or androgen deprivation therapy (ADT) is the primary therapeutic option. Moreover, increased use of chemotherapy with docetaxel and cabazitaxel in clinical practice has resulted in better prognosis for patients in this advanced stage of the disease.
The biggest challenge for doctors and patients remains the treatment of hormone-resistant carcinoma (which very often is also metastatic). Concerns of today’s medicine regarding effective therapies for this type of disease have recently led to a significant increase in the number of papers/studies on new-generation biological treatments.
Safety Monitoring and Reporting in Clinical Trials DIA Poster 2015KCR
How to get the plausible and precise safety data, maintaining the highest ethical standards
during clinical development?
KCR’s article presents critical points in safety monitoring and reporting at different stages of the clinical trial, as well the main difficulties faced by medical personnel and clinical team during their everyday practice.
Is your clinical trial in jeopardy? KCR's comprehensive rescue support will expeditiously steer it back on track. Taking over each rescue study on a case-by-case basis, our team of experts quickly analyze its status and provide accurate solutions to bring it back on track in a timely manner maintaining its safety,efficacy, and validity.
Report Back from SGO 2024: What’s the Latest in Cervical Cancer?bkling
Are you curious about what’s new in cervical cancer research or unsure what the findings mean? Join Dr. Emily Ko, a gynecologic oncologist at Penn Medicine, to learn about the latest updates from the Society of Gynecologic Oncology (SGO) 2024 Annual Meeting on Women’s Cancer. Dr. Ko will discuss what the research presented at the conference means for you and answer your questions about the new developments.
These lecture slides, by Dr Sidra Arshad, offer a quick overview of physiological basis of a normal electrocardiogram.
Learning objectives:
1. Define an electrocardiogram (ECG) and electrocardiography
2. Describe how dipoles generated by the heart produce the waveforms of the ECG
3. Describe the components of a normal electrocardiogram of a typical bipolar leads (limb II)
4. Differentiate between intervals and segments
5. Enlist some common indications for obtaining an ECG
Study Resources:
1. Chapter 11, Guyton and Hall Textbook of Medical Physiology, 14th edition
2. Chapter 9, Human Physiology - From Cells to Systems, Lauralee Sherwood, 9th edition
3. Chapter 29, Ganong’s Review of Medical Physiology, 26th edition
4. Electrocardiogram, StatPearls - https://www.ncbi.nlm.nih.gov/books/NBK549803/
5. ECG in Medical Practice by ABM Abdullah, 4th edition
6. ECG Basics, http://www.nataliescasebook.com/tag/e-c-g-basics
Lung Cancer: Artificial Intelligence, Synergetics, Complex System Analysis, S...Oleg Kshivets
RESULTS: Overall life span (LS) was 2252.1±1742.5 days and cumulative 5-year survival (5YS) reached 73.2%, 10 years – 64.8%, 20 years – 42.5%. 513 LCP lived more than 5 years (LS=3124.6±1525.6 days), 148 LCP – more than 10 years (LS=5054.4±1504.1 days).199 LCP died because of LC (LS=562.7±374.5 days). 5YS of LCP after bi/lobectomies was significantly superior in comparison with LCP after pneumonectomies (78.1% vs.63.7%, P=0.00001 by log-rank test). AT significantly improved 5YS (66.3% vs. 34.8%) (P=0.00000 by log-rank test) only for LCP with N1-2. Cox modeling displayed that 5YS of LCP significantly depended on: phase transition (PT) early-invasive LC in terms of synergetics, PT N0—N12, cell ratio factors (ratio between cancer cells- CC and blood cells subpopulations), G1-3, histology, glucose, AT, blood cell circuit, prothrombin index, heparin tolerance, recalcification time (P=0.000-0.038). Neural networks, genetic algorithm selection and bootstrap simulation revealed relationships between 5YS and PT early-invasive LC (rank=1), PT N0—N12 (rank=2), thrombocytes/CC (3), erythrocytes/CC (4), eosinophils/CC (5), healthy cells/CC (6), lymphocytes/CC (7), segmented neutrophils/CC (8), stick neutrophils/CC (9), monocytes/CC (10); leucocytes/CC (11). Correct prediction of 5YS was 100% by neural networks computing (area under ROC curve=1.0; error=0.0).
CONCLUSIONS: 5YS of LCP after radical procedures significantly depended on: 1) PT early-invasive cancer; 2) PT N0--N12; 3) cell ratio factors; 4) blood cell circuit; 5) biochemical factors; 6) hemostasis system; 7) AT; 8) LC characteristics; 9) LC cell dynamics; 10) surgery type: lobectomy/pneumonectomy; 11) anthropometric data. Optimal diagnosis and treatment strategies for LC are: 1) screening and early detection of LC; 2) availability of experienced thoracic surgeons because of complexity of radical procedures; 3) aggressive en block surgery and adequate lymph node dissection for completeness; 4) precise prediction; 5) adjuvant chemoimmunoradiotherapy for LCP with unfavorable prognosis.
Factory Supply Best Quality Pmk Oil CAS 28578–16–7 PMK Powder in Stockrebeccabio
Factory Supply Best Quality Pmk Oil CAS 28578–16–7 PMK Powder in Stock
Telegram: bmksupplier
signal: +85264872720
threema: TUD4A6YC
You can contact me on Telegram or Threema
Communicate promptly and reply
Free of customs clearance, Double Clearance 100% pass delivery to USA, Canada, Spain, Germany, Netherland, Poland, Italy, Sweden, UK, Czech Republic, Australia, Mexico, Russia, Ukraine, Kazakhstan.Door to door service
Hot Selling Organic intermediates
Explore natural remedies for syphilis treatment in Singapore. Discover alternative therapies, herbal remedies, and lifestyle changes that may complement conventional treatments. Learn about holistic approaches to managing syphilis symptoms and supporting overall health.
Pulmonary Thromboembolism - etilogy, types, medical- Surgical and nursing man...VarunMahajani
Disruption of blood supply to lung alveoli due to blockage of one or more pulmonary blood vessels is called as Pulmonary thromboembolism. In this presentation we will discuss its causes, types and its management in depth.
Title: Sense of Smell
Presenter: Dr. Faiza, Assistant Professor of Physiology
Qualifications:
MBBS (Best Graduate, AIMC Lahore)
FCPS Physiology
ICMT, CHPE, DHPE (STMU)
MPH (GC University, Faisalabad)
MBA (Virtual University of Pakistan)
Learning Objectives:
Describe the primary categories of smells and the concept of odor blindness.
Explain the structure and location of the olfactory membrane and mucosa, including the types and roles of cells involved in olfaction.
Describe the pathway and mechanisms of olfactory signal transmission from the olfactory receptors to the brain.
Illustrate the biochemical cascade triggered by odorant binding to olfactory receptors, including the role of G-proteins and second messengers in generating an action potential.
Identify different types of olfactory disorders such as anosmia, hyposmia, hyperosmia, and dysosmia, including their potential causes.
Key Topics:
Olfactory Genes:
3% of the human genome accounts for olfactory genes.
400 genes for odorant receptors.
Olfactory Membrane:
Located in the superior part of the nasal cavity.
Medially: Folds downward along the superior septum.
Laterally: Folds over the superior turbinate and upper surface of the middle turbinate.
Total surface area: 5-10 square centimeters.
Olfactory Mucosa:
Olfactory Cells: Bipolar nerve cells derived from the CNS (100 million), with 4-25 olfactory cilia per cell.
Sustentacular Cells: Produce mucus and maintain ionic and molecular environment.
Basal Cells: Replace worn-out olfactory cells with an average lifespan of 1-2 months.
Bowman’s Gland: Secretes mucus.
Stimulation of Olfactory Cells:
Odorant dissolves in mucus and attaches to receptors on olfactory cilia.
Involves a cascade effect through G-proteins and second messengers, leading to depolarization and action potential generation in the olfactory nerve.
Quality of a Good Odorant:
Small (3-20 Carbon atoms), volatile, water-soluble, and lipid-soluble.
Facilitated by odorant-binding proteins in mucus.
Membrane Potential and Action Potential:
Resting membrane potential: -55mV.
Action potential frequency in the olfactory nerve increases with odorant strength.
Adaptation Towards the Sense of Smell:
Rapid adaptation within the first second, with further slow adaptation.
Psychological adaptation greater than receptor adaptation, involving feedback inhibition from the central nervous system.
Primary Sensations of Smell:
Camphoraceous, Musky, Floral, Pepperminty, Ethereal, Pungent, Putrid.
Odor Detection Threshold:
Examples: Hydrogen sulfide (0.0005 ppm), Methyl-mercaptan (0.002 ppm).
Some toxic substances are odorless at lethal concentrations.
Characteristics of Smell:
Odor blindness for single substances due to lack of appropriate receptor protein.
Behavioral and emotional influences of smell.
Transmission of Olfactory Signals:
From olfactory cells to glomeruli in the olfactory bulb, involving lateral inhibition.
Primitive, less old, and new olfactory systems with different path
Prix Galien International 2024 Forum ProgramLevi Shapiro
June 20, 2024, Prix Galien International and Jerusalem Ethics Forum in ROME. Detailed agenda including panels:
- ADVANCES IN CARDIOLOGY: A NEW PARADIGM IS COMING
- WOMEN’S HEALTH: FERTILITY PRESERVATION
- WHAT’S NEW IN THE TREATMENT OF INFECTIOUS,
ONCOLOGICAL AND INFLAMMATORY SKIN DISEASES?
- ARTIFICIAL INTELLIGENCE AND ETHICS
- GENE THERAPY
- BEYOND BORDERS: GLOBAL INITIATIVES FOR DEMOCRATIZING LIFE SCIENCE TECHNOLOGIES AND PROMOTING ACCESS TO HEALTHCARE
- ETHICAL CHALLENGES IN LIFE SCIENCES
- Prix Galien International Awards Ceremony
Title: Sense of Taste
Presenter: Dr. Faiza, Assistant Professor of Physiology
Qualifications:
MBBS (Best Graduate, AIMC Lahore)
FCPS Physiology
ICMT, CHPE, DHPE (STMU)
MPH (GC University, Faisalabad)
MBA (Virtual University of Pakistan)
Learning Objectives:
Describe the structure and function of taste buds.
Describe the relationship between the taste threshold and taste index of common substances.
Explain the chemical basis and signal transduction of taste perception for each type of primary taste sensation.
Recognize different abnormalities of taste perception and their causes.
Key Topics:
Significance of Taste Sensation:
Differentiation between pleasant and harmful food
Influence on behavior
Selection of food based on metabolic needs
Receptors of Taste:
Taste buds on the tongue
Influence of sense of smell, texture of food, and pain stimulation (e.g., by pepper)
Primary and Secondary Taste Sensations:
Primary taste sensations: Sweet, Sour, Salty, Bitter, Umami
Chemical basis and signal transduction mechanisms for each taste
Taste Threshold and Index:
Taste threshold values for Sweet (sucrose), Salty (NaCl), Sour (HCl), and Bitter (Quinine)
Taste index relationship: Inversely proportional to taste threshold
Taste Blindness:
Inability to taste certain substances, particularly thiourea compounds
Example: Phenylthiocarbamide
Structure and Function of Taste Buds:
Composition: Epithelial cells, Sustentacular/Supporting cells, Taste cells, Basal cells
Features: Taste pores, Taste hairs/microvilli, and Taste nerve fibers
Location of Taste Buds:
Found in papillae of the tongue (Fungiform, Circumvallate, Foliate)
Also present on the palate, tonsillar pillars, epiglottis, and proximal esophagus
Mechanism of Taste Stimulation:
Interaction of taste substances with receptors on microvilli
Signal transduction pathways for Umami, Sweet, Bitter, Sour, and Salty tastes
Taste Sensitivity and Adaptation:
Decrease in sensitivity with age
Rapid adaptation of taste sensation
Role of Saliva in Taste:
Dissolution of tastants to reach receptors
Washing away the stimulus
Taste Preferences and Aversions:
Mechanisms behind taste preference and aversion
Influence of receptors and neural pathways
Impact of Sensory Nerve Damage:
Degeneration of taste buds if the sensory nerve fiber is cut
Abnormalities of Taste Detection:
Conditions: Ageusia, Hypogeusia, Dysgeusia (parageusia)
Causes: Nerve damage, neurological disorders, infections, poor oral hygiene, adverse drug effects, deficiencies, aging, tobacco use, altered neurotransmitter levels
Neurotransmitters and Taste Threshold:
Effects of serotonin (5-HT) and norepinephrine (NE) on taste sensitivity
Supertasters:
25% of the population with heightened sensitivity to taste, especially bitterness
Increased number of fungiform papillae
Anti ulcer drugs and their Advance pharmacology ||
Anti-ulcer drugs are medications used to prevent and treat ulcers in the stomach and upper part of the small intestine (duodenal ulcers). These ulcers are often caused by an imbalance between stomach acid and the mucosal lining, which protects the stomach lining.
||Scope: Overview of various classes of anti-ulcer drugs, their mechanisms of action, indications, side effects, and clinical considerations.
ARTIFICIAL INTELLIGENCE IN HEALTHCARE.pdfAnujkumaranit
Artificial intelligence (AI) refers to the simulation of human intelligence processes by machines, especially computer systems. It encompasses tasks such as learning, reasoning, problem-solving, perception, and language understanding. AI technologies are revolutionizing various fields, from healthcare to finance, by enabling machines to perform tasks that typically require human intelligence.
Journal for Clinical Studies: Close Cooperation Between Data Management and Biostatistics Benefits Data Quality
1. Volume 8 Issue 542 Journal for Clinical Studies
Technology
Introduction
Every clinical trial is a source of multidimensional data,
analysed in order to answer questions presented in
hypotheses on safety, efficacy and other topics. For the
analysis to be reliable and successful, the recorded data
must be of sufficient quality, i.e. complete, correct and
integral. Keeping invalid or incomplete data in a database
may cause incorrect calculation results, leading to invalid
conclusions and wrong decisions. It is not only a matter
of potential consequences for the sponsor but also
ethics. As there are living humans behind the numbers
generated, this issue must not be taken lightly.
Thus, the process of data validation becomes a key
aspect of every trial. Although the process of checking
and cleaning data is usually performed by the data
management team, a close cooperation with biostatistics
may significantly improve the results by introducing both
statistical knowledge and the ability to create specialised,
programmatic tools and advanced queries giving a good
foundation for deeper and faster data investigations.
Reasons and Types of Invalid Data
Invalid data is usually caused by a human mistake.
EDC forms containing fields insufficiently protected by
edit checks increase the chance for errors. Obviously, it
is always better to prevent than being sorry, and EDC
forms should always be made resistant to errors. Reality,
however, often involves compromises. Text fields allowing
free text to be entered are a good example of that.
Sometimes one has to deal with already poorly-designed
forms. Things get even worse if the EDC software does not
prevent the entry of incorrect values, but rather displays
alerts to the user. This is not uncommon.
Invalid Results
Results of laboratory examinations present a good
example for what can go wrong. Typos, invalid decimal
separators, textual results mixed with numerical ones,
results mixed with both manual comments or messages
generated by the system/machine (“sample hemolysis”,
“bellow assay range”), units entered in many forms,
incorrectly assigned units (e.g. “G/L” confused with
“g/L”), missing lower or upper limits of reference ranges,
switched lower and upper limits of reference ranges,
incorrect assignments between reference ranges and
gender or age, incorrectly assigned flags (high, low,
abnormal), dates and times entered in a wrong format,
just to name a few possible issues. Even automatically
transferred data from a laboratory into an EDC software
through transfer files and programmatic API can be
invalid due to technical issues.
Multiple units make results incomparable and without
the process of unification, they cannot simply be included
in the analysis. Simple group-by analysis enumerates all
the entered units and helps to prepare a list of conversion
factors. It is generally a good idea to make all units SI
compliant.
Missing Observations
While the bad impact of invalid data is obvious, probably
not everyone realises that missing data may affect
statistical computations in no less degree. Things get
worse, if the missingness is not at random, but rather
follows a pattern. Lower sample size may increase
dispersion in data affecting values of descriptive statistics
and estimation of errors. Statistical tests lose their power.
Bias in parameter estimation may be introduced as well.
Design of a trial may become unbalanced, which often
leads to confounding data. Missing observations may
distort distribution shapes. Assumptions of statistical
methods may be violated, which makes statistical
inference unreliable. Missing classes of observations may
make the analysis impossible to perform or interpret.
Advanced imputation techniques are commonly in
use, however they are still only an attempt to fight the
fire. One should not forget that they introduce artificial
data, even if a statistical model says they are possible.
Moreover, things may get really bad when it comes to
misguided data imputation, which may completely distort
the picture of a situation.
Suspicious Observations
Suspicious observations make the next category of issues
which significantly lower the quality of data. Observation
can be considered suspicious for many reasons. Its value
may be too high or too low, acting as an outlier and
significantly affecting results of an analysis or causing
the analysis to fail entirely. Such values may be expected
as typical for a specific disease (ESR, AlAT) or indicate a
human mistake, thus it should be investigated carefully.
But also values looking pretty normal, lying inside a
normal range, may reveal worrying patterns, indicating
a potentially artificial nature of the entered data and
probably fraud. Investigations entailed by this class of
problems are particularly challenging and subtle.
It is not easy to cope with these problems in a
transparent and formalised world of clinical trials when
they happen. Suspicious observations, rich in outliers,
can really damage calculations, distort results and lead
to wrong conclusions. Even if a solution in the form of a
robust statistical method exists, it is challenging to apply,
due to the fact that hypotheses are usually stated a priori
along with a corresponding and closed set of statistical
methods that will be used.
Close Cooperation Between Data Management and
Biostatistics Benefits Data Quality
50_JCS_September2016.indd 42 29/09/2016 16:00:42
2. Journal for Clinical Studies 43www.jforcs.com
Fraud and Misconduct
Fraud and misconduct, caused intentionally or by
insufficient training, can result in damages which are
often impossible to fix and are very expensive in the end.
One would say that it is far better to have missing rather
than incorrect data. Inappropriate IMP management,
handling or administration procedures, including
accidental switching of drug, placebo or comparator as
well as incorrect examination techniques applied can
damage the data in an unrecoverable manner. This is
because what is done cannot be undone. The sooner it
is detected and eliminated, the better, all the more for
the fact that it often requires long-lasting and difficult
investigation in order to collect all the evidence.
Solutions
After a statistical analysis plan and protocol is prepared
and signed, one does not simply alter things, especially the
set of statistical methods and proceedings, without being
charged with being manipulative. This clearly shows how
extremely important it is to ensure data completeness
and correctness long before the database is finally locked
and the analysis starts. As the process of data validation
and correction is not completed immediately, it involves
a lot of additional communication, consumes time and
resources, and postponing it to a moment shortly before
the lock is very risky.
At KCR we maximise efforts to minimise the risk of
further dealing with invalid and incomplete data, as well as
allowing poorly-trained staff to perform. For this purpose
we have introduced a close cooperation between data
management and biostatistics. While data management
personnel are typically responsible for preparing well-
designed, CDISC-compliant EDC forms and performing
periodic data reviews, the biostatistics department
provides both statistical support and programmatic tools
for advanced data checking and transformation.
The following kinds of support are currently applied
at KCR: preparation-stage analysis; assisted data
validation; creating tools for unassisted data validation;
writing screening programs for unsolicited, ad-hoc data
review; providing solutions for automated scour analysis;
programming solutions for data exchange between
information systems, and last but not least – training and
mentoring.
Preparation-stage Analysis
Every trial starts with a set of common preliminary steps
that have a critical impact on the data quality. One of
the most important prerequisites is to properly design the
EDC forms. The key thing is to ensure its compliance with
CDISC CDASH specification. The second step is to secure
input fields with appropriate edit checks to prevent the
user from entering nonsense data. In addition, text inputs
should be encoded with dictionaries whenever possible.
This refers not only to fields intended to be medically
encoded (MedDRA, LOINC, ICD, etc.) but to any field
of which the content can be organised in a dictionary
to avoid multiple names for a single thing. For encoded
fields, the option allowing the user to enter his own text
should be avoided if possible, as it is contrary to the idea.
All these actions are mostly performed by data
management; however, the programming
skills offered by biostatistics make an
excellent opportunity to improve the process
by preparing scripts querying the database
in search of missing rules, checks and
violations of certain naming conventions.
Assisted Data Validation
This kind of support covers analyses done on
request and usually together with personnel
from other departments, like clinicians,
administrators and managers. It is mainly
used for deeper investigations which cover
various aspects of a trial and involve much
more advanced methods than usual.
Various statistical methods are in use, for
example:
• an extended set of descriptive
statistics, including robust, both
classic and positional measures
• graphical analyses using various
combinations of scatterplots,
boxplots, mosaic plots, histograms
and various types of density plots,
as well as custom plots revealing
specific patterns in data
Technology
Missing Ref. Range end both lower upper
RefRange lower upper
clunit
%
10^3
10^9/L
1000/uL
G/L
x10^3/ul
x10^6/uL
Result index
0 25 50 75 100
LOGResult[x10^9/L]
1X10
+2
1X10
+1
1X10
+0
1X10
-1
1X10
-2
1X10
-3
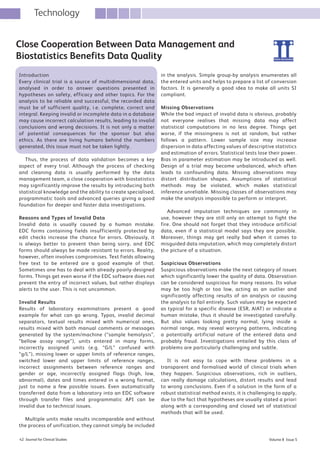
Chart 1: An exemplary diagram revealing typical issues found in laboratory data:
missing values, incomplete and missing reference ranges, incorrect units assigned
50_JCS_September2016.indd 43 29/09/2016 16:00:42
3. Volume 8 Issue 544 Journal for Clinical Studies
• analysis of possible outliers done both graphically
and mathematically
• analysis of suspicious data by looking for patterns
in coexisting values in view of surrounding
circumstances, involving graphical and mathematical
methods, like decision trees
• analysis of randomness in data samples
• analysis of patterns in missing data by using
specialised graphs
We have found that graphical methods are especially
useful in communication with clinicians and managers.
Well-designed graphics immediately reveal patterns
and make the user able to grasp a lot of information. It
works perfectly while searching for patterns in missing
data, investigating possible frauds and investigating
laboratory data.
A good example of such activity is a process of
reviewing results of laboratory tests expressed in various
units. By applying a set of conversion factors between
units, it is possible to unify all values and show them on
a common chart along with reference ranges and other
information. This shows immediately which units were
chosen and if they are valid, whether observations have
incorrect values or if a corresponding reference range
(or one of its ends) is missing. This message is easy to
understand and reduces the need to get through long
tables of numbers.
Assisted Data Validation – Fraud and Misconduct
The detection of potential fraud and misconduct involves
both graphical and statistical methods. At the first stage,
the biostatistics team tries to picture the situation with
simple plots, which are then discussed in a team of
clinicians, managers and other specialists. All doubtful
patterns are examined by statisticians using various simple
and advanced, multidimensional methods. In the end,
the statisticians present findings and recommendations
for decision-making. Such investigation can reveal
intentional, harmful activity as well as showing certain
weaknesses of procedures and deficits in training.
Abnormally low or high dispersion in data,
relationships between means and dispersions, highly
skewed distributions (when not expected), departures
from shapes of distribution characterised in a protocol,
unexpected patterns in data like “steps” and “clusters”,
strange relationships between variables, unexpected
patterns in missing data, periodicity in occurrences of
specific issues and many other things can be detected
by well-trained biostatisticians and revealed before
clinicians and managers.
Creations of Tools for Unassisted, Repeatable Data
Validation
The key to success is to perform the data checking as
often as possible. Daily checking is not unusual. On
the other hand, it may become a very time-consuming
process and frequently involving the biostatistics team
in running required analyses does not seem to be the
best option. The fact that many valuable analyses do not
require any statistical advisory has helped us to develop a
reporting tool that can be used by the data management
staff alone.
The first step is to create a list of required analyses,
where items are prioritised and grouped by predefined
categories. For each report, a set of parameters and
their default values are determined as well. The next
step refers to technical matters, like the selection of the
technology to be used, choice of a method of accessing
the database, description of a user authorisation process,
shape of a graphical user interface, selection of the
desired output formats, etc. Since long-lasting analyses
slow down the database, its content should be replicated
to another instance or exported to an intermediate
file (XML, CSV, etc.) before the analysis. In order to
save money, the chosen technology should allow the
utilisation of already existing resources, i.e. hardware,
software, statistical programmers and administrators. In
this case, if R programmers are already on board, the R
package should be considered as the default development
platform first rather than other technologies (.NET, Java,
PHP, etc.) which would require the hiring of additional
programmers.
We decided to create the tool as a self-contained,
windows-based application hosted entirely by the R
package. GNU R is a well-known, powerful, acclaimed
and free statistical package, as well as a high-level
programming language. It is a strong SAS competitor,
used worldwide by millions of users , huge corporations
and organisations, including FDA. R is an open-source
project, developed by the R Core Team, and supported
by the R Consortium which consists of companies like
Microsoft, Oracle, IBM and Google.
The contents of the R library address practically every
topic in biostatistics , including clinical research. R is
capable of reading data and producing output in various
formats, including SAS datasets, Microsoft Office and
PDF documents. Extensive support for querying numerous
kinds of data sources (also via SQL), implementation of the
reproducible research paradigm, three advanced charting
systems, the ability to host embedded user interfaces and
web applications, full portability understood as an ability
to run without the installation on almost every operating
system and a huge, dynamic society of users, make R a
good candidate for a reliable programmatic environment.
The created tool is capable of running a wide range of
a laboratory data reconciliation as well as trial-specific
analyses. The implemented set of analyses allows for
detection of: missing visits, empty mandatory fields,
inconsistencies in certain data domains, various kinds
of misconduct, discrepancies between the database and
specification in units, normal ranges and flags, missing
Technology
50_JCS_September2016.indd 44 29/09/2016 16:00:42
4. Journal for Clinical Studies 45www.jforcs.com
Technology
laboratory examinations, departures from a schedule
described in the protocol and invalid results, to name
only a few. It has proven its usefulness in everyday
practice. Now it takes only a few minutes for the full set of
analyses and just a few seconds for a single report, when
previously it took long hours to create a corresponding
Excel report manually. By using the tool we were able to
detect serious issues and take certain remedies before
the situation got serious.
Screening Ad Hoc Analyses
The process of writing programs for the final statistical
report is a perfect moment for assessing the quality of
collected data long before analysing them. We call them
“screening programs” and use them to check if the data
is clean enough to perform a certain part of the analysis.
Screening analyses are valuable due to the nature
of their creation: while writing the statistical analysis
program, the statistician plays a lot with the data by
writing a number of queries and checking the content
of a database in many ways. This often results in useful
queries, which normally might have never been requested.
By the use of the reproducible research paradigm
implementation available in R, it is possible to embed
these analyses directly into the main statistical analysis
program.
Automated Scour Analysis
This is an automated enhancement of the screening data
validation, working in the background, and has more of an
“alerting” nature. A program scours the database content
periodically in search of specific issues and reports findings
via email or stores them in an HTML log. The fact that the
amount of time required to complete such an analysis is
of low importance, there is no direct, intended interaction
between ordinary users and the system, and that R is not
resource-consuming and can be deployed in a machine
with any architecture, makes it possible to implement
the tool on simplified minicomputers like Raspberry Pi.
This eliminates the need to buy a new machine or install
new software on an existing, stable server. An additional
small (3.7”) breadboard with LCD touchscreen will enable
a limited interaction with the script.
Simple data
inspector
Dictionaries
User interface
TemplatesQueries
Direct access
Access
via export
Scripts
EDC
Software
SQL
</>
CSV
<CSS>
&
<html>
<html>
<XML>
Access via database
interfaces: OBDC/JDBC
PDF
Site ID
1
1
1
1
2
SubjID
3
3
4
5
5
Lab Test
RBC
WBC
ESR
Hb
B-HCG
Screening
OK
OK
OK
OK
N/A
Day 1
OK
MISSING
MISSING
OK
OK
Day 2
OK
N/A
MISSING
N/A
MISSING
Scheme 1: An overall architecture of a typical reporting system
50_JCS_September2016.indd 45 29/09/2016 16:00:42
5. Journal for Clinical Studies 46www.jforcs.com
Data Converters
A data converter is a kind of program which transforms
data from one form to another. Its sole task is to
eliminate the human factor during the process of data
transformation as much as possible.
Transferring results of clinical examinations from an
external laboratory into an EDC database, followed by
additional data integrity checks, makes a good example
of such a process. At KCR we constitute data converters
every time the adjustment of received data format
is required. As previously, the R statistical package is
used for that purpose, which significantly facilitates
complicated operations on data spread over multiple,
differentiated sources. Advanced querying capabilities
together with the availability of interfaces to numerous
database engines make the process of transferring data
extremely simple in comparison to traditional, high-level
programming languages, and can be done in a very few
lines of code.
Training and Mentoring
Sharing knowledge about possible issues that can happen
to data as well as emphasising their impact on the
analysis results is no less important than the analytical
support itself. If people understand why certain matters
are so important, they are more cooperative and follow
the rules more willingly. In order to raise a better, more
general awareness in these matters, we decided to
organise a series of courses for non-statisticians. The
audience has demonstrated high interest, which confirms
that our efforts and direction were right.
Summary
Data validation is a process of great importance, having
significant implications for the reliability of the final
data analysis. There are many possible sources of issues,
which makes it really difficult to identify them all and
react quickly enough. From the early stages of a trial to
its very end, at every turn, this is where the programmatic
and statistical support provided by the biostatistics team
comes to the rescue. At KCR, both departments closely
cooperate with each other and have been organised in a
common biometrics unit in order to facilitate the flow of
information.
References
1. Oracle Corporation, “Scaling R to the Enterprise. Using
R for Enterprise-level Performance, Scalability, Ease
of Production Deployment, and Security”, An Oracle
White Paper, July 2016, http://www.oracle.com/
technetwork/database/options/advanced-analytics/
r-enterprise/bringing-r-to-the-enterprise-1956618.
pdf
2. Olszewski Adrian, “Is R suitable enough for
biostatisticians involved in clinical research and
evidence-based medicine?”, June 15th 2015, http://r-
clinical-research.com
3. Smith David, Microsoft Corporation (formerly
Revolution Analytics), “FDA: R OK for drug trials”,
June 21st 2012, http://blog.revolutionanalytics.
com/2012/06/fda-r-ok.html
4. Smith David, Microsoft Corporation (formerly
Revolution Analytics), “Companies using R in 2014”,
May 23rd 2014, http://blog.revolutionanalytics.
com/2014/05/companies-using-r-in-2014.html
Technology
Adrian Olszewski is Biostatistician in the
Biometrics & Clinical Trial Data Execution
Systems Department at KCR, a contract
research organisation (CRO). Adrian is
involved in delivering informatics and
analytical solutions for medicine, pharmacy
and clinical laboratory diagnostics. He has a
profound knowledge in statistics in the field of evidence-
based medicine, especially in clinical research. Adrian is
responsible for providing comprehensive support for trials
from the early design considerations through the data
analysis – including interim evaluations – to the final
report. Adrian is also involved in various external projects
on widely understood data analysis and applications of
the R statistical package. Mr Olszewski holds a Master of
Science (MSc) degree in Computer Science.
Email: info@kcrcro.com
50_JCS_September2016.indd 46 29/09/2016 16:00:42