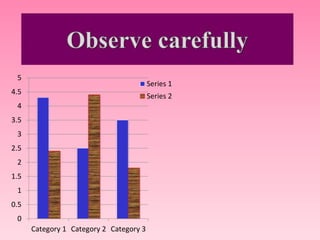
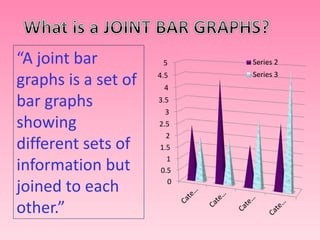
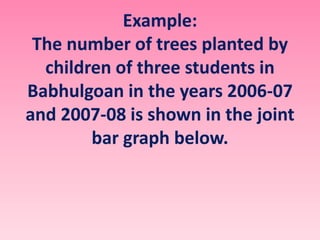
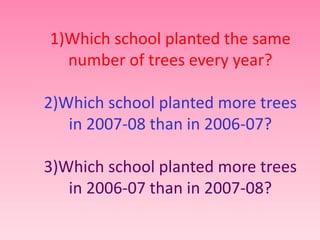
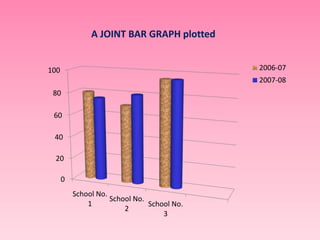
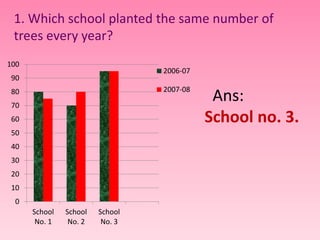
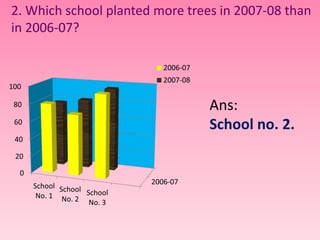
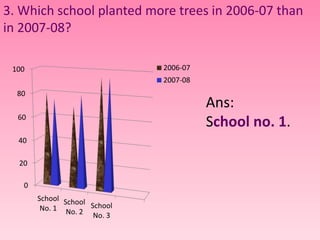
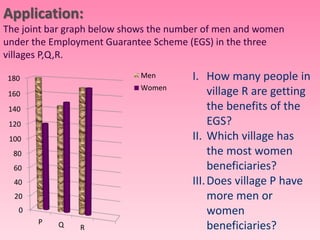
5 
4.5 
4 
3.5 
3 
2.5 
2 
1.5 
1 
0.5 
0 
Category 1 Category 2 Category 3 
Series 1 
Series 2
“A joint bar 
graphs is a set of 
bar graphs 
showing 
different sets of 
information but 
joined to each 
other.” 
5 Series 2 
4.5 
4 
3.5 
3 
2.5 
2 
1.5 
1 
0.5 
0 
Series 3
Example: 
The number of trees planted by 
children of three students in 
Babhulgoan in the years 2006-07 
and 2007-08 is shown in the joint 
bar graph below.
1)Which school planted the same 
number of trees every year? 
2)Which school planted more trees 
in 2007-08 than in 2006-07? 
3)Which school planted more trees 
in 2006-07 than in 2007-08?
A JOINT BAR GRAPH plotted 
80 
60 
40 
20 
0 
100 
School No. 
1 
School No. 
2 
School No. 
3 
2006-07 
2007-08
1. Which school planted the same number of 
trees every year? 
100 
90 
80 
70 
60 
50 
40 
30 
20 
10 
0 
School 
No. 1 
School 
No. 2 
School 
No. 3 
2006-07 
2007-08 
Ans: 
School no. 3.
2. Which school planted more trees in 2007-08 than 
in 2006-07? 
2006-07 
100 
80 
60 
40 
20 
0 
School 
No. 1 
School 
No. 2 
School 
No. 3 
2006-07 
2007-08 
Ans: 
School no. 2.
3. Which school planted more trees in 2006-07 than 
in 2007-08? 
100 
80 
60 
40 
20 
0 
School 
No. 1 
School 
No. 2 
School 
No. 3 
2006-07 
2007-08 
Ans: 
School no. 1.
Evaluation: 
What is a graph? 
What is a joint bar graph? 
How is the joint bar graphs drawn?
Application: 
The joint bar graph below shows the number of men and women 
under the Employment Guarantee Scheme (EGS) in the three 
villages P,Q,R. 
180 
160 
140 
120 
100 
80 
60 
40 
20 
0 
P Q R 
Men 
Women 
I. How many people in 
village R are getting 
the benefits of the 
EGS? 
II. Which village has 
the most women 
beneficiaries? 
III. Does village P have 
more men or 
women 
beneficiaries?
Home Work: 
 Solve Exercise 83 
from the text book 
page no. 149.
Joint bar graphs interpret&concept

Joint bar graphs interpret&concept

  • 2.
    5 4.5 4 3.5 3 2.5 2 1.5 1 0.5 0 Category 1 Category 2 Category 3 Series 1 Series 2
  • 3.
    “A joint bar graphs is a set of bar graphs showing different sets of information but joined to each other.” 5 Series 2 4.5 4 3.5 3 2.5 2 1.5 1 0.5 0 Series 3
  • 4.
    Example: The numberof trees planted by children of three students in Babhulgoan in the years 2006-07 and 2007-08 is shown in the joint bar graph below.
  • 5.
    1)Which school plantedthe same number of trees every year? 2)Which school planted more trees in 2007-08 than in 2006-07? 3)Which school planted more trees in 2006-07 than in 2007-08?
  • 6.
    A JOINT BARGRAPH plotted 80 60 40 20 0 100 School No. 1 School No. 2 School No. 3 2006-07 2007-08
  • 7.
    1. Which schoolplanted the same number of trees every year? 100 90 80 70 60 50 40 30 20 10 0 School No. 1 School No. 2 School No. 3 2006-07 2007-08 Ans: School no. 3.
  • 8.
    2. Which schoolplanted more trees in 2007-08 than in 2006-07? 2006-07 100 80 60 40 20 0 School No. 1 School No. 2 School No. 3 2006-07 2007-08 Ans: School no. 2.
  • 9.
    3. Which schoolplanted more trees in 2006-07 than in 2007-08? 100 80 60 40 20 0 School No. 1 School No. 2 School No. 3 2006-07 2007-08 Ans: School no. 1.
  • 10.
    Evaluation: What isa graph? What is a joint bar graph? How is the joint bar graphs drawn?
  • 11.
    Application: The jointbar graph below shows the number of men and women under the Employment Guarantee Scheme (EGS) in the three villages P,Q,R. 180 160 140 120 100 80 60 40 20 0 P Q R Men Women I. How many people in village R are getting the benefits of the EGS? II. Which village has the most women beneficiaries? III. Does village P have more men or women beneficiaries?
  • 12.
    Home Work: Solve Exercise 83 from the text book page no. 149.