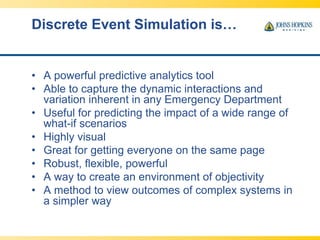
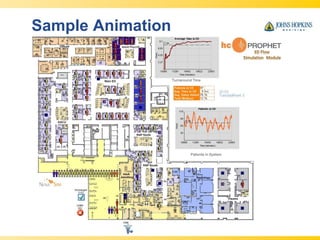
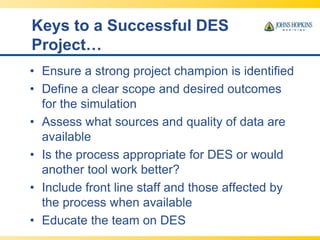
SIMUL8 Corporation | SIMUL8.com | info@SIMUL8.com
1 800 547 6024 | +44 141 552 6888
SIMUL8 Corporation | SIMUL8.com | info@SIMUL8.com
1 800 547 6024 | +44 141 552 6888
•
•
•
Eric Hamrock, MBA, PMP- Sr. Project Administrator,
Johns Hopkins Health System
Kerrie Paige, PhD- President, NovaSim, LLC
DES for Decision Making in
the Emergency Department
4/11/2013
Roadmap
• What is discrete event simulation and why
do we use it?
• Setting up a project for success
• Gathering the right information
• Model validation
• Case Studies: Using simulation to support
decisions at JHHS
WHAT IS DES AND WHY USE
IT FOR DECISION MAKING IN
THE EMERGENCY
DEPARTMENT?
Discrete Event Simulation is…
• A powerful predictive analytics tool
• Able to capture the dynamic interactions and
variation inherent in any Emergency Department
• Useful for predicting the impact of a wide range of
what-if scenarios
• Highly visual
• Great for getting everyone on the same page
• Robust, flexible, powerful
• A way to create an environment of objectivity
• A method to view outcomes of complex systems in
a simpler way
Sample Animation
What if We…
• Add capacity (i.e. space, staff)?
• Change a practice pattern?
• Receive more or fewer patients?
• Get a different mix of patients?
• Reduce boarding time?
• Adopt a new model of care (fast track, short
stay, etc.)?
• Want to evaluate proposed lean initiatives?
• Reconfigure or add additional care areas?
SETTING UP A PROJECT FOR
SUCCESS…
Keys to a Successful DES
Project…
• Ensure a strong project champion is identified
• Define a clear scope and desired outcomes
for the simulation
• Assess what sources and quality of data are
available
• Is the process appropriate for DES or would
another tool work better?
• Include front line staff and those affected by
the process when available
• Educate the team on DES
Key Roles
Project
Manager
Decision
Maker
Technical
Expert/
Developer
Front
Line
Staff
DES Pitfalls
• Scope creep
• Did not define the question clearly up
front?
• Lack of project champion buy-in
• Lack of front-line staff buy-in
• Quality/accuracy of data
• DES not the right tool
Phases of a Simulation Study
Process Analysis
• Historical data
• Flow charts
• Interviews
• Time studies
Modeling
• Configure model
• Validate
Scenarios
• Create
• Compare & evaluate
Reporting
• Communicate
• Knowledge transfer
Process Mapping
Simulation Brings the
Process Map Alive
VALIDATING THE MODEL
Start by Gathering the Right Information
and Checking it Carefully
• Carefully mine any transactional data available for
arrivals, LOS, pathways, D/C
• Supplement with manual time studies as needed
• Check patient flow and critical process elements
through clinic visits and interviews with critical staff
• Verify the model by following simulated patients
through the system
• Validate the model - did the baseline model predict
the same performance we observed in the real
system?
How Do We Know When to Trust
the Model?
• When it looks and ‘feels’ like the real system
– Do we have the right number of arrivals of each patient type
into each part of the system?
– Does the hourly census pattern in each area of the ED
match reality?
– Are patients waiting where they should be and for the right
period of time?
– Is overall time in system about right?
– Bottom line: Does the clinical staff believe it?
• It is very common that the initial model does NOT validate
very well
– Tracking down the problem is often enlightening in itself
– It is also proof that validation is a critical part of the process
Sample Validation Reports
USING DES FOR ED DECISION
MAKING
All ED models help us
evaluate
• Overall ED Performance – now and in the future
– LWBS
– Bed utilization
– Expected patient wait times
– ED census levels
• Potential trouble spots
– Are there any areas with unsustainable bed occupancy
levels? Are we on the edge of the cliff?
– Which parts of the process are particularly sensitive to
volume, patient mix or dwell time changes?
• Business cases, providing evidentiary support for
proposed change
Case Study:
Howard County General Hospital
From a Basic Model, Many
Issues were Analyzed
• Addition of a psych pod
• Impact of reduced wait times for diagnostic
imaging and labs
• Change in capacity/schedule in fast track
• Reduced wait for an inpatient bed
• Change in nursing bed assignment patterns
• Revised allocation of ED beds
• Reduced housekeeping (bed turnover) times?
• Increased patient volumes
Case Study: Johns Hopkins Bayview
Medical Center
• 380 bed area-wide trauma center
• Several throughput improvement
projects over the years
• Most recent: detailed model to support
capacity calculations for new ED
• Ground breaking for new ED
department, Spring 2013
Facility Size
Demand Analysis
9/4/2013
Emergency Department Operations
Review
28
Volume 59,275 63,000 75,000
Current Needed
Minor Care 8 8 8 9
Emergency 21 36 38 45
Specialty 4 7 7 7
Total 33 51 53 61
Ultimate recommendation:
55 beds for the near term, 60-62 for the longer term
Facility Size
Simulation: 65,000 Patients
9/4/2013
Emergency Department Operations
Review
29
Emergent
Beds
43 40 37 36 35
Bed
Utilization
66.8% 71.0% 75.4% 78.5% 80.0%
90th %ile
wait time
Level 3
0 mins 4.6 mins 23.5 mins 32.7 mins 48.4 mins
LWBS <1.0% <1.0% <1.0% <1.0% <1.0%
Total
Beds
58 55 52 51 50
Total includes specialty beds and 8 minor care
Add chairs for Psychiatric Evaluation Patients (6)
Case Study:
The Johns Hopkins Hospital
• How can we best manage throughput?
– Adding or reallocating capacity?
– Changing practice patterns?
– Reducing dwell times?
– Reducing boarding time?
– Adjusting unit operating hours?
Patient Service
Area Utilization
0%
20%
40%
60%
80%
100%
120%
0:30
1:00
1:30
2:00
2:30
3:00
3:30
4:00
4:30
5:00
5:30
6:00
6:30
7:00
7:30
8:00
8:30
9:00
9:30
10:00
10:30
11:00
11:30
12:00
12:30
13:00
13:30
14:00
14:30
15:00
15:30
16:00
16:30
17:00
17:30
18:00
18:30
19:00
19:30
20:00
20:30
21:00
21:30
22:00
22:30
23:00
23:30
0:00
PSA Utilization
Triage % Main ED % Psych % Trauma % EACU % ICU % RAP % Super Track %
Many Interventions
Considered
• Capacity reallocation/addition
• Dwell time reductions (via process
improvements)
• Practice changes
• Shifting demand elsewhere
• Interdepartmental process changes
Ultimate goal: work toward a ‘zero-wait’ ED
Time to First Beds
(Additional Beds)
0.0 min
20.0 min
40.0 min
60.0 min
80.0 min
100.0 min
120.0 min
140.0 min
Base 1 Bed 2 Beds 3 Beds 4 Beds 5 Beds 6 Beds 7 Beds 8 Beds 9 Beds 10 Beds
Additional Beds
Main ED EACU ICU RAP SuperTrack
Time to First Bed (Dwell Time
Reduction)
0.0 min
20.0 min
40.0 min
60.0 min
80.0 min
100.0 min
120.0 min
140.0 min
Base -5% -10% -15% -20% -25% -30%
Dwell Time Reduction
Main ED EACU ICU RAP SuperTrack
Dwell Time vs Total Beds
80
85
90
95
100
105
110
115
60% 65% 70% 75% 80% 85% 90% 95%
Total
Beds
Dwell Time Factor
Combination of factors necessary to get 95% of patients to first bed within 30 minutes
Bed Utilization vs. Service Level
(% of patients who wait less than 5 Min)
100% 100% 100% 100% 99%
98%
96%
92%
86%
76%
61%
41%
16%
0%0%
10%
20%
30%
40%
50%
60%
70%
80%
90%
100%
39% 44% 49% 54% 59% 63% 68% 73% 78% 83% 88% 93% 98% 100%
Bed Utilization
Reduced Boarding Time
Lessons Learned
• Start simple, build from there
• If you have multiple EDs in your system or you are going to be running
models often over the years, take some time to build a robust, easy-to-
use interface
• Model building process can provide value just by getting the team to
think through all aspects of the patient flow process
• Extremely useful for presenting ideas/ selling concepts to senior
management
• It’s ok to start with less than perfect data, but validate end results
closely before using for decisions
• Sometimes results are non-intuitive, that doesn’t make them wrong
• Look beyond the immediate symptoms – issues may be originating in
another department
• Models often point out issues that had been previously unrecognized
• Invaluable for testing ideas before implementation
• Great for ED sizing/bed allocation questions
Special Thanks
• James Scheulen
• Scott Levin
• Jaret Hauge
SIMUL8 Corporation | SIMUL8.com | info@SIMUL8.com
1 800 547 6024 | +44 141 552 6888
SIMUL8 Corporation | SIMUL8.com | info@SIMUL8.com
1 800 547 6024 | +44 141 552 6888
•
•
•
•
SIMUL8 Corporation | SIMUL8.com | info@SIMUL8.com
1 800 547 6024 | +44 141 552 6888
SIMUL8 Corporation | SIMUL8.com | info@SIMUL8.com
1 800 547 6024 | +44 141 552 6888
–
–
–
SIMUL8 Corporation | SIMUL8.com | info@SIMUL8.com
1 800 547 6024 | +44 141 552 6888
•
•

Emergency Department Throughput: Using DES as an effective tool for decision making with SIMUL8 simulation software

  • 2.
    SIMUL8 Corporation |SIMUL8.com | info@SIMUL8.com 1 800 547 6024 | +44 141 552 6888
  • 3.
    SIMUL8 Corporation |SIMUL8.com | info@SIMUL8.com 1 800 547 6024 | +44 141 552 6888 • • •
  • 4.
    Eric Hamrock, MBA,PMP- Sr. Project Administrator, Johns Hopkins Health System Kerrie Paige, PhD- President, NovaSim, LLC DES for Decision Making in the Emergency Department 4/11/2013
  • 5.
    Roadmap • What isdiscrete event simulation and why do we use it? • Setting up a project for success • Gathering the right information • Model validation • Case Studies: Using simulation to support decisions at JHHS
  • 6.
    WHAT IS DESAND WHY USE IT FOR DECISION MAKING IN THE EMERGENCY DEPARTMENT?
  • 7.
    Discrete Event Simulationis… • A powerful predictive analytics tool • Able to capture the dynamic interactions and variation inherent in any Emergency Department • Useful for predicting the impact of a wide range of what-if scenarios • Highly visual • Great for getting everyone on the same page • Robust, flexible, powerful • A way to create an environment of objectivity • A method to view outcomes of complex systems in a simpler way
  • 8.
  • 9.
    What if We… •Add capacity (i.e. space, staff)? • Change a practice pattern? • Receive more or fewer patients? • Get a different mix of patients? • Reduce boarding time? • Adopt a new model of care (fast track, short stay, etc.)? • Want to evaluate proposed lean initiatives? • Reconfigure or add additional care areas?
  • 10.
    SETTING UP APROJECT FOR SUCCESS…
  • 11.
    Keys to aSuccessful DES Project… • Ensure a strong project champion is identified • Define a clear scope and desired outcomes for the simulation • Assess what sources and quality of data are available • Is the process appropriate for DES or would another tool work better? • Include front line staff and those affected by the process when available • Educate the team on DES
  • 12.
  • 14.
    DES Pitfalls • Scopecreep • Did not define the question clearly up front? • Lack of project champion buy-in • Lack of front-line staff buy-in • Quality/accuracy of data • DES not the right tool
  • 15.
    Phases of aSimulation Study Process Analysis • Historical data • Flow charts • Interviews • Time studies Modeling • Configure model • Validate Scenarios • Create • Compare & evaluate Reporting • Communicate • Knowledge transfer
  • 16.
  • 17.
  • 18.
  • 19.
    Start by Gatheringthe Right Information and Checking it Carefully • Carefully mine any transactional data available for arrivals, LOS, pathways, D/C • Supplement with manual time studies as needed • Check patient flow and critical process elements through clinic visits and interviews with critical staff • Verify the model by following simulated patients through the system • Validate the model - did the baseline model predict the same performance we observed in the real system?
  • 20.
    How Do WeKnow When to Trust the Model? • When it looks and ‘feels’ like the real system – Do we have the right number of arrivals of each patient type into each part of the system? – Does the hourly census pattern in each area of the ED match reality? – Are patients waiting where they should be and for the right period of time? – Is overall time in system about right? – Bottom line: Does the clinical staff believe it? • It is very common that the initial model does NOT validate very well – Tracking down the problem is often enlightening in itself – It is also proof that validation is a critical part of the process
  • 21.
  • 22.
    USING DES FORED DECISION MAKING
  • 23.
    All ED modelshelp us evaluate • Overall ED Performance – now and in the future – LWBS – Bed utilization – Expected patient wait times – ED census levels • Potential trouble spots – Are there any areas with unsustainable bed occupancy levels? Are we on the edge of the cliff? – Which parts of the process are particularly sensitive to volume, patient mix or dwell time changes? • Business cases, providing evidentiary support for proposed change
  • 24.
    Case Study: Howard CountyGeneral Hospital
  • 25.
    From a BasicModel, Many Issues were Analyzed • Addition of a psych pod • Impact of reduced wait times for diagnostic imaging and labs • Change in capacity/schedule in fast track • Reduced wait for an inpatient bed • Change in nursing bed assignment patterns • Revised allocation of ED beds • Reduced housekeeping (bed turnover) times? • Increased patient volumes
  • 26.
    Case Study: JohnsHopkins Bayview Medical Center • 380 bed area-wide trauma center • Several throughput improvement projects over the years • Most recent: detailed model to support capacity calculations for new ED • Ground breaking for new ED department, Spring 2013
  • 27.
    Facility Size Demand Analysis 9/4/2013 EmergencyDepartment Operations Review 28 Volume 59,275 63,000 75,000 Current Needed Minor Care 8 8 8 9 Emergency 21 36 38 45 Specialty 4 7 7 7 Total 33 51 53 61 Ultimate recommendation: 55 beds for the near term, 60-62 for the longer term
  • 28.
    Facility Size Simulation: 65,000Patients 9/4/2013 Emergency Department Operations Review 29 Emergent Beds 43 40 37 36 35 Bed Utilization 66.8% 71.0% 75.4% 78.5% 80.0% 90th %ile wait time Level 3 0 mins 4.6 mins 23.5 mins 32.7 mins 48.4 mins LWBS <1.0% <1.0% <1.0% <1.0% <1.0% Total Beds 58 55 52 51 50 Total includes specialty beds and 8 minor care Add chairs for Psychiatric Evaluation Patients (6)
  • 29.
    Case Study: The JohnsHopkins Hospital • How can we best manage throughput? – Adding or reallocating capacity? – Changing practice patterns? – Reducing dwell times? – Reducing boarding time? – Adjusting unit operating hours?
  • 30.
  • 31.
    Many Interventions Considered • Capacityreallocation/addition • Dwell time reductions (via process improvements) • Practice changes • Shifting demand elsewhere • Interdepartmental process changes Ultimate goal: work toward a ‘zero-wait’ ED
  • 32.
    Time to FirstBeds (Additional Beds) 0.0 min 20.0 min 40.0 min 60.0 min 80.0 min 100.0 min 120.0 min 140.0 min Base 1 Bed 2 Beds 3 Beds 4 Beds 5 Beds 6 Beds 7 Beds 8 Beds 9 Beds 10 Beds Additional Beds Main ED EACU ICU RAP SuperTrack
  • 33.
    Time to FirstBed (Dwell Time Reduction) 0.0 min 20.0 min 40.0 min 60.0 min 80.0 min 100.0 min 120.0 min 140.0 min Base -5% -10% -15% -20% -25% -30% Dwell Time Reduction Main ED EACU ICU RAP SuperTrack
  • 34.
    Dwell Time vsTotal Beds 80 85 90 95 100 105 110 115 60% 65% 70% 75% 80% 85% 90% 95% Total Beds Dwell Time Factor Combination of factors necessary to get 95% of patients to first bed within 30 minutes
  • 35.
    Bed Utilization vs.Service Level (% of patients who wait less than 5 Min) 100% 100% 100% 100% 99% 98% 96% 92% 86% 76% 61% 41% 16% 0%0% 10% 20% 30% 40% 50% 60% 70% 80% 90% 100% 39% 44% 49% 54% 59% 63% 68% 73% 78% 83% 88% 93% 98% 100% Bed Utilization
  • 36.
  • 37.
    Lessons Learned • Startsimple, build from there • If you have multiple EDs in your system or you are going to be running models often over the years, take some time to build a robust, easy-to- use interface • Model building process can provide value just by getting the team to think through all aspects of the patient flow process • Extremely useful for presenting ideas/ selling concepts to senior management • It’s ok to start with less than perfect data, but validate end results closely before using for decisions • Sometimes results are non-intuitive, that doesn’t make them wrong • Look beyond the immediate symptoms – issues may be originating in another department • Models often point out issues that had been previously unrecognized • Invaluable for testing ideas before implementation • Great for ED sizing/bed allocation questions
  • 38.
    Special Thanks • JamesScheulen • Scott Levin • Jaret Hauge
  • 39.
    SIMUL8 Corporation |SIMUL8.com | info@SIMUL8.com 1 800 547 6024 | +44 141 552 6888
  • 40.
    SIMUL8 Corporation |SIMUL8.com | info@SIMUL8.com 1 800 547 6024 | +44 141 552 6888 • • • •
  • 41.
    SIMUL8 Corporation |SIMUL8.com | info@SIMUL8.com 1 800 547 6024 | +44 141 552 6888
  • 42.
    SIMUL8 Corporation |SIMUL8.com | info@SIMUL8.com 1 800 547 6024 | +44 141 552 6888 – – –
  • 43.
    SIMUL8 Corporation |SIMUL8.com | info@SIMUL8.com 1 800 547 6024 | +44 141 552 6888 • •