Download to read offline


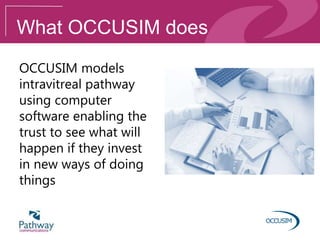
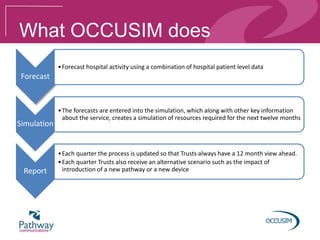
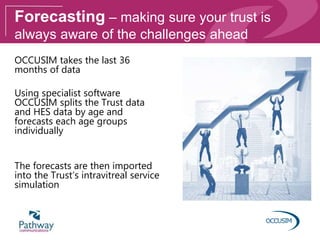
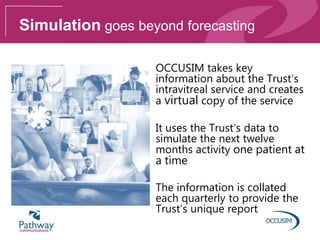
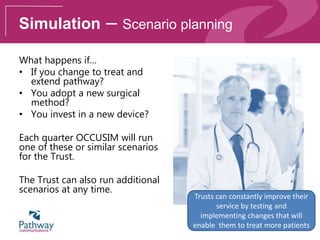
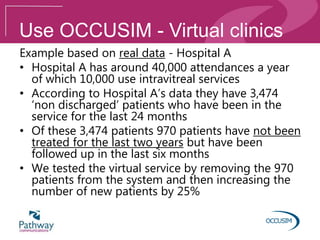
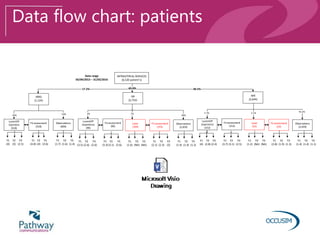
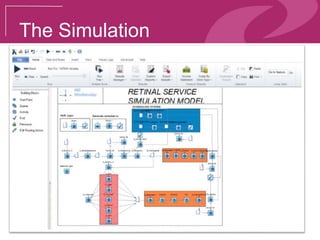
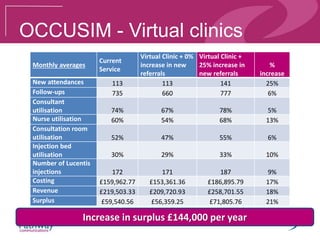
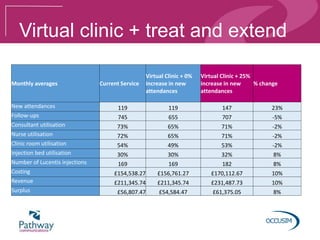


Occusim, developed by Pathway Communications, uses computer simulations to forecast hospital activity and improve eye care services by modeling intravitreal pathways. It provides hospitals with quarterly updates and scenarios to enhance patient treatment capacity and streamline operations. The platform allows trusts to test various service changes, with a focus on optimizing patient management and resource utilization.