Download to read offline

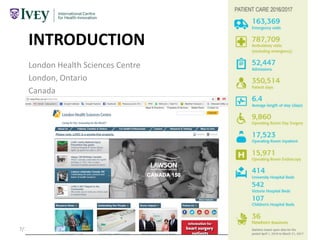
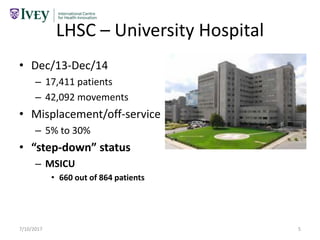
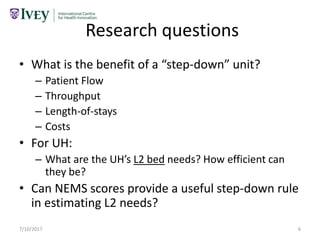
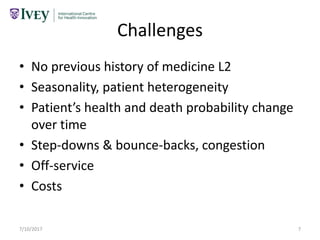
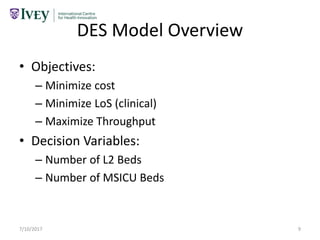
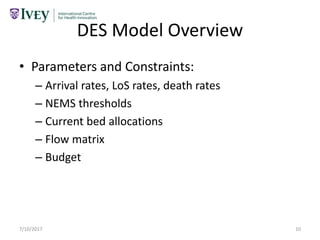
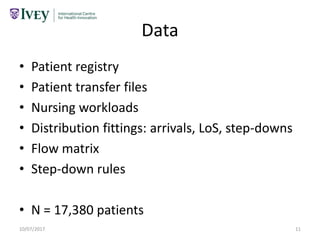
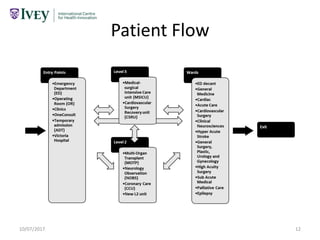

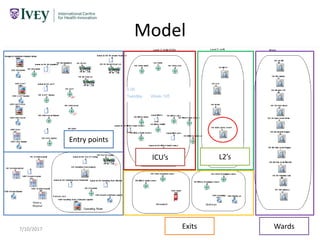
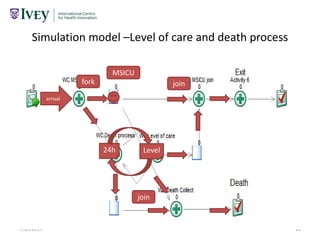
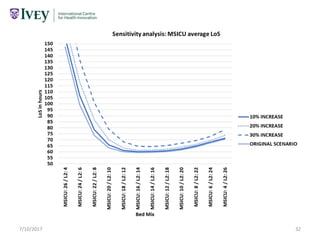
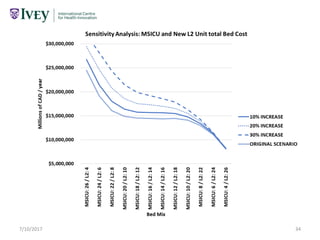
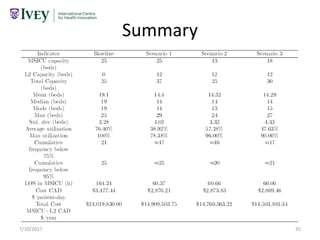


The document presents a discrete event simulation model designed to assess the 'step-down' bed needs at London Health Sciences Centre, focusing on patient flow and resource allocation for intensive care units. It identifies research questions related to patient throughput, length of stays, and efficiency of bed utilization, while outlining the model's objectives, decision variables, and constraints. Challenges such as patient health variability and historical data limitations are discussed in the context of improving the healthcare system's operational efficiency.


![overcrowding in ED 27012023_dr m [Auto-saved] (1).pdf](https://cdn.slidesharecdn.com/ss_thumbnails/overcrowdingined27012023drmauto-saved1-230206000509-921c3810-thumbnail.jpg?width=640&height=640&fit=bounds)