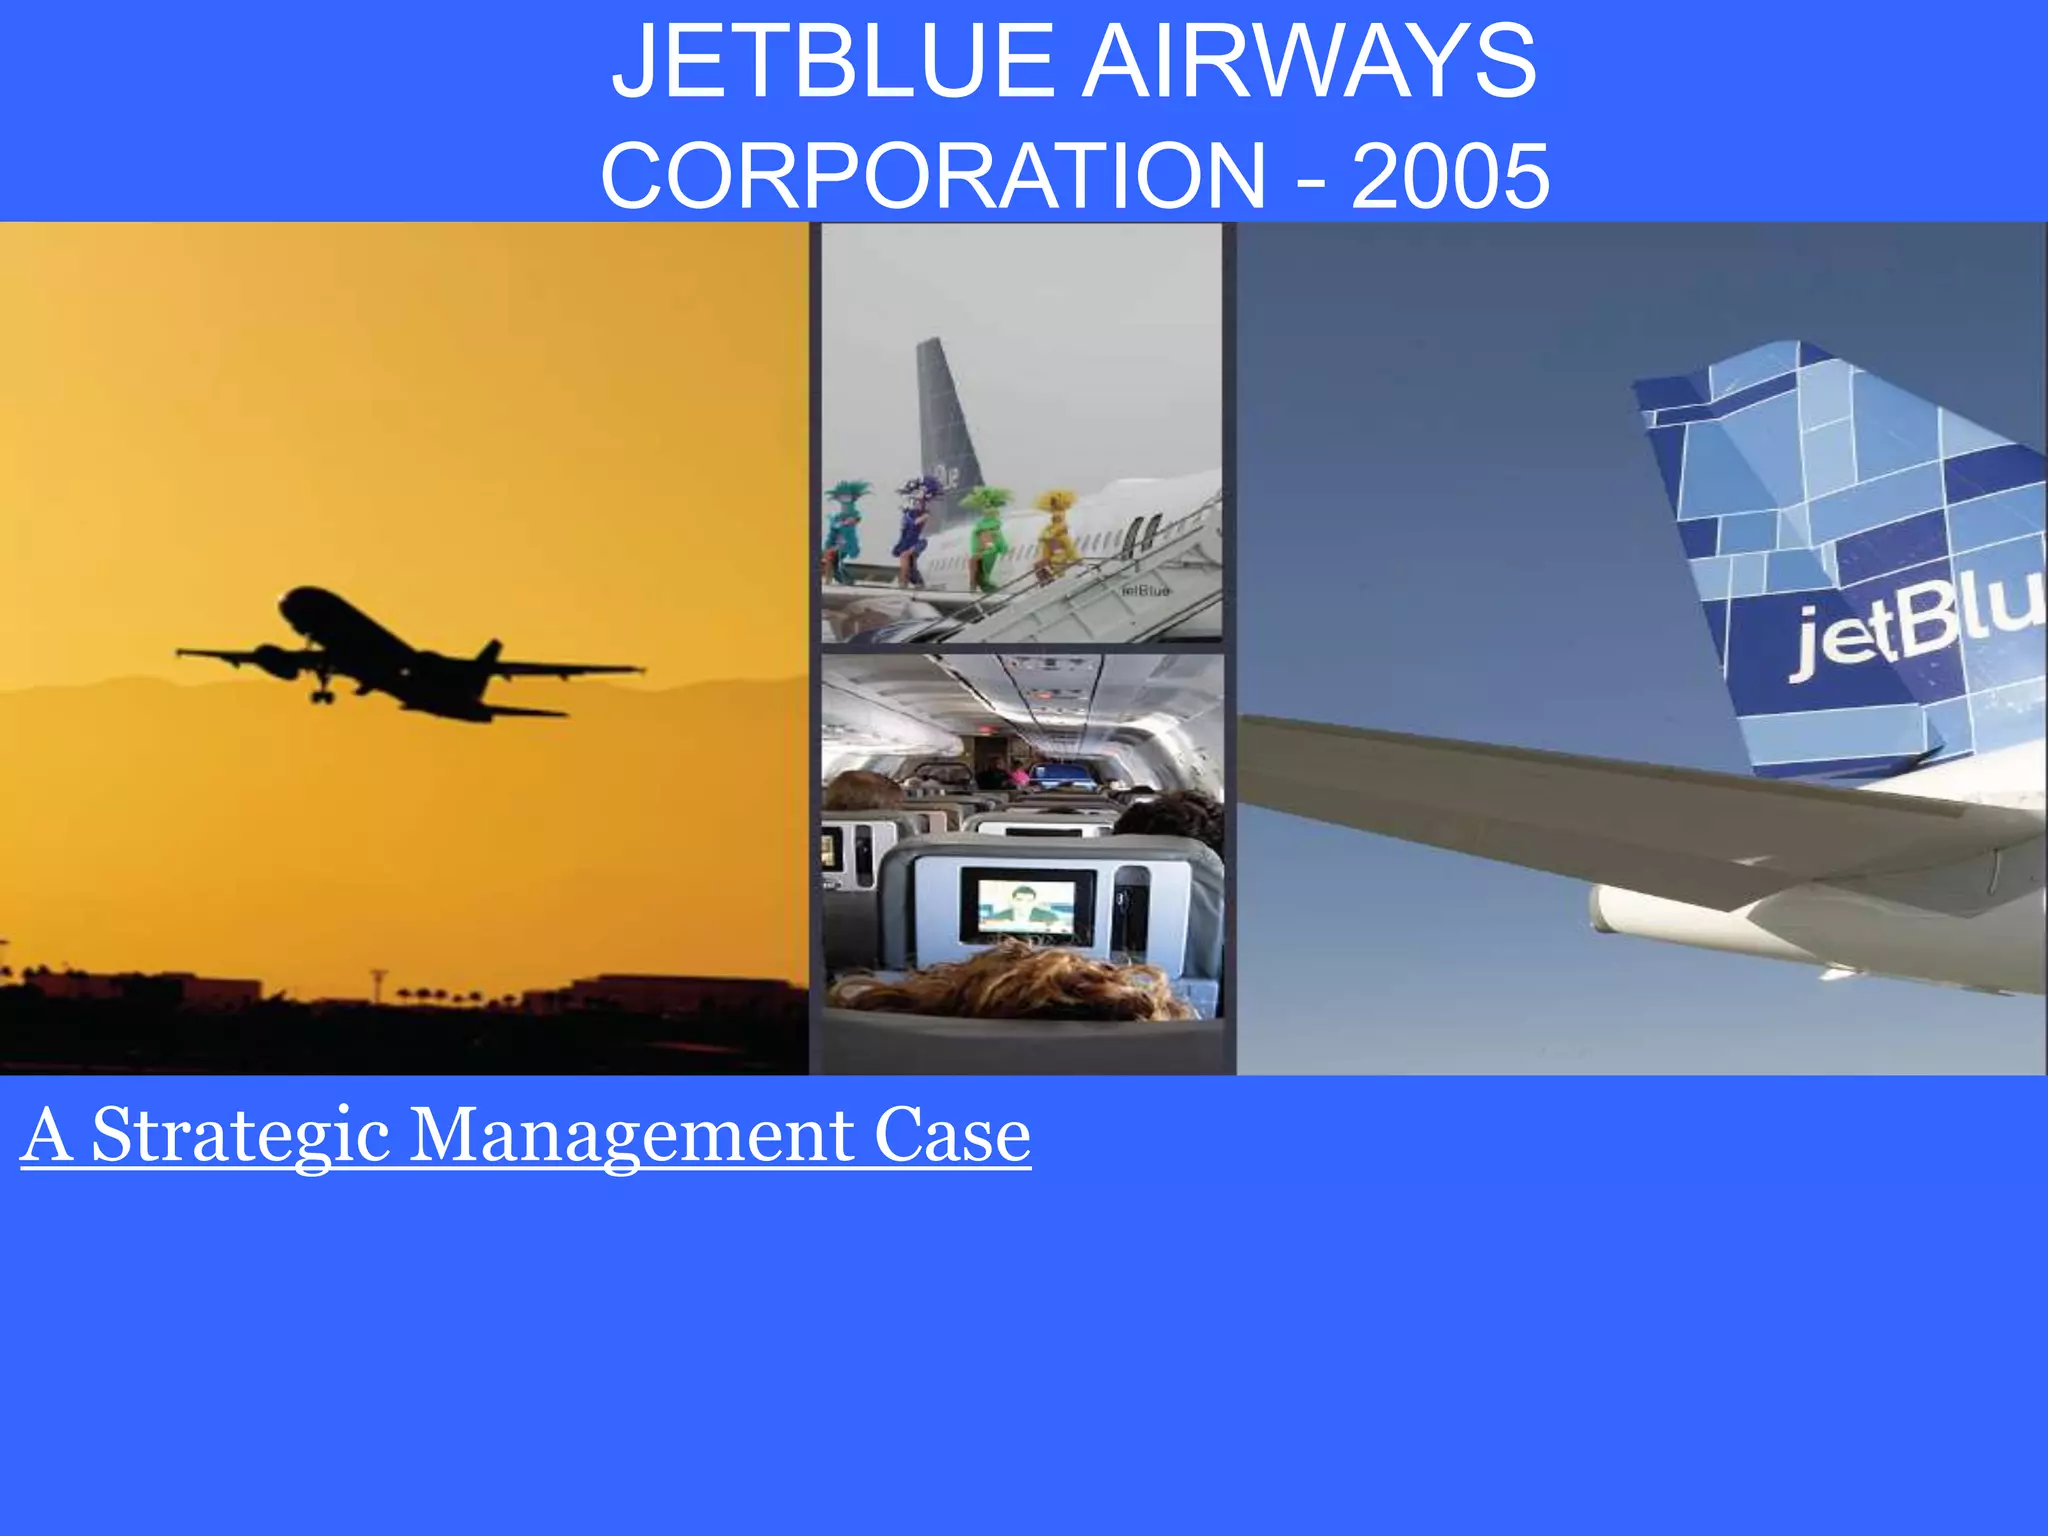
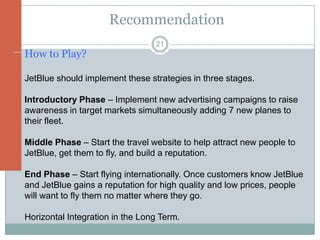
JETBLUE AIRWAYS
               CORPORATION - 2005


A Strategic Management Case
Outline
                           2

Introduction
Strategy Formulation Stage
    Vision & Mission Formulation
    SLEPT Analysis
    CPM, EFE, IFE
    SWOT, SPACE, Market Focus Matrix
    IE, Grand Strategy Matrix
    QSPM
Strategy Implementation Stage
    Recommendations
    Annual Objectives and Policies
Strategy Evaluation Stage
Introduction
                                    3

 High competition in US airline industry.


 JetBlue
     Established in 1998 and started service in 2000
     Goal has been to establish itself as a leading low-fare, low-cost
      passenger airline by offering customers high-quality customer
      service and differentiated products.
     Focus on underserved markets.
     108 flights in 2002 and 316 in 2005 serving 32 destinations.
     By mid 2005, fleet of 77 new Airbus A320 Aircraft
     Stock price $20 in 2002 and peaked at $26.4 in 2005.
Introduction
                                    4

 JetBlue Facts Sheet
    First and only US to launch with more than 100 million in capital
    First and only to offer 24 channels of live satellite free at every seat.
    First and only to broadcast the Olympics live at every seat.
    First to introduce “paperless cockpit” technology.
    Only US to be 100% ticketless.
    First to install bulletproof cockpit doors.
    First and only to install security cameras.
 Major Competitors
    American
    Southwest
    United
Vision & Mission
                                    5


PROPOSED VISION

At JetBlue our vision is to be the best regional air carrier by providing
  low-fare, low-cost, enjoyable and safe flight experiences to our
  passengers.
Vision & Mission
                                 6

Proposed Mission Statements

Jet Blue’s mission is to be the leading low-fare, low-cost passenger
airline offering high quality customer service to underserved
markets and customers who are looking for the best value in their
flight. We have the newest most advanced planes that are reliable,
safe, fuel efficient, utilizing advanced technologies, and unique in
multimedia entertainments. Our philosophy is to give customers
the best price value for their ticket and maintaining distinctive
services. At JetBlue we hire highly motivated employees and train
them to reach a high level of competency to provide better
experiences to customers. We believe that our high-value, high
quality service philosophy will lead the way to becoming the
number one in the industry.
External Opportunities and Threats
                                        7

SLEPT Analysis
         SLEPT Influences        External Opportunities               External Threats
Social                      200 million passengers will be    Obese passengers contributing
                            carried in 2005 (4.1% increase    to high fuel consumption costs
                            than previous year)               (275 million additional cost to
                            High demand for air travel        airlines)
Legal                       Increase in labor wages           Union labor contract & strikes
                            Bankruptcy of many rival          Mergence of competing airlines
                            airlines                          New regulations
                            New regulations
Environmental and Ethical   None                              High oil prices
                                                              Availability of Jet fuel

Political                   None                              Rising security rules and
                                                              obligations.

Technological               Utilization of the internet for   Reliability of the internet and
                            sales                             system downtime.
                            New airplanes fleet
Competitive Profile Matrix (CPM)
                                      8
                                High Demand
                 Weight   JetBlue High Sales
                                         American   Southwest   United
Market           0.10     3.00           3.00       4.00        1.00
Capitalization
Employees        0.10     4.00           1.00       3.00        2.00

Quarterly Rev    0.12     4.00           2.00       2.00        1.00
Growth
Revenue          0.10     4.00           4.00       4.00        4.00

Gross Margin     0.10     4.00           3.00       4.00        2.00

Net Income       0.12     3.00           2.00       4.00        1.00

EPS              0.10
                            High Efficiency
                          3.00          1.00        4.00        1.00
                               Low cost
P/S              0.08     4.00           1.00       4.00        1.00

Expense          0.18     4.00           2.00       2.00        2.00
Passenger
Miles
Total            1.00     3.68           2.12       3.30        1.68
External Factor Analysis
                                                                   9
                                      Factors                                  Weight      Rating        Weighted Score
Opportunities
Rapid growth of discount airlines due to bankruptcy of rival airlines           0.06          3               0.18
200 million passengers will be carried in 2005 (more than the year before by
4.1%)                                                                           0.08          3               0.24
Air travel is much safer than other means of transportation                     0.05          4                0.2
Emergence of new federal laws enhancing security in airports                    0.04          3               0.12

Threat                                                                                                         0
High oil or jet fuel prices                                                     0.08          4               0.32
Union labor contracts, wages, benefits & strikes                                0.09          4               0.36
Fierce competition from other rival airlines                                    0.07          3               0.21
Availability of jet fuel                                                        0.09          3               0.27
Market is maturing                                                              0.07          3               0.21
Rapid growth of discount airlines                                               0.05          3               0.15
Emergence of new US federal laws (e.g., change in daylight saving time)         0.07          2               0.14
Pricing is weak                                                                 0.05          4                0.2
Obese passengers contributing to high fuel consumption & negative
environmental impact                                                            0.06          3               0.18
Rising security rules and obligations                                           0.08          4               0.32
Rising breakeven load factor                                                    0.06          3               0.18
                                                                                        Total Weighted
                                   Total weight                                  1          Score             3.28
Internal Factor Evaluation
                                   Factors                    10                  Weight      Rating        Weighted Score
Opportunities
Deployment of technology in terms of paperless tickets (i.e., e-commerce)          0.08          4               0.32
Attention to security in terms of bullet-proof in cockpit cabin and cameras in
passenger cabins                                                                   0.09          4               0.36
JetBlue fleet maintains a new fleet of aircrafts                                   0.06          4               0.24
JetBlue offer in-flight entertainment                                              0.06          3               0.18
JetBlue hires the best crew in terms of skills and employees                       0.08          3               0.24
Jet Blue has a very well clear strategy in terms of leadership                     0.09          4               0.36
JetBlue offers exceptional training physical resources to company employees        0.08          4               0.32
Availability of customer service management                                        0.07          3               0.21
JetBlue has the lowest labor wages compared to other rival airlines ($3.13 with
each seat flown)                                                                   0.05          4               0.2
JetBlue has a loyalty program, named TrueBlue, which rewards program
members                                                                            0.03          3               0.09
JetBlue maintains a higher net income ($39.24M) compared to industry ($27.61)      0.03          2               0.06
JetBlue maintains a higher revenue ($1.35B) compared to industry ($1.24B)          0.03          2               0.06
JetBlue maintains a higher operating margin (7.84%) than its industry (6.86%)      0.02          3               0.06
JetBlue has a high market capitalization ($2.19B)compared to industry ($536.6M)    0.02          2               0.04
JetBlue maintained a higher P/E ratio (59.21) compared to industry (14.16)         0.03          3               0.09
JetBlue has a high P/S ratio (1.63) compared to industry (0.42)                    0.03          2               0.06
JetBlue maintained a high gross margin (36.12%) compared to industry (23.08%)
and other rival airlines                                                           0.03          3               0.09
JetBlue has a higher quarterly revenue growth (29.5%) compared to industry
(20.4%) and other rival airlines                                                   0.03          2               0.06
Threat
JetBlue reported a high PEG ratio (3.90) compared to industry (0.93)               0.04           1              0.04
JetBlue reported low EBITDA (191.54) compared to industry (154.38M)                0.05           2               0.1
                                                                                           Total Weighted
                                 Total weight                                       1          Score             3.18
Internal-External Matrix
                     11


      4          3               2         1

           I               II        III
      3
IFE


           IV              V         VI
      2

          VII             VIII       IX
      1

                     EFE
SPACE MATRIX
     12
Grand Strategy Matrix


                        13
SWOT analysis
                                              14


             STRENGTHS                                         WEAKNESSES
Constant financial growth over past 3 years.       Relatively new company.
Low operating cost and labor cost due to           Serving only 13 States.
strong utilization of resources.                   Low fares could mean less profit.
High service passenger airline.                    Lower percentage of full time employees
Comfortable accommodation.                         compared to competitors.
Product differentiation due to unique in-flight    Lowest in market cap among competitors.
digital entertainment systems.                     Single fleet of planes (77 Airbus A320 Aircraft
Known for being efficient and on time.             only).
Dedicated staff due to their strong hiring         Relying mostly on word of mouth advertising.
process.                                           Higher percentage of airborne time and
75.4% online reservation – Effective use of        higher number of diverted flights than
website.                                           competitors.
100% ticketless.
SWOT analysis

        OPPORTUNITIES                                   THREATS
Northwest may be heading for              Risk of strikes (Trade Unions)
Chapter 11.                               Fuel price and fuel availability.
Demand in air travel predicted to         Risks of hedging fuel.
increase by 4.1%.                         Break-even load factor is increasing.
Possibility of senate approving           Rapid growth of discount airlines.
daylight savings hitting competitors in   Strong competitions as competitors
EO market.                                move to Cost leadership strategy.
Using luggage tracking technology         Some competitors are merging to rival
could help in the lost luggage            with discount airlines.
department.                               New taxes from govt.
                                          Security & Terrorism

                                                                              15
SWOT analysis
                                            16
             SO STRATEGIES                                   WO STRATEGIES
Market Penetration: Expand and offer flights      Raise fares slightly but keep it lower than
to Europe and market their superior price value   competitors.
to Europe.                                        Advertise on TV to increase customer
Market Penetration: Capture markets of            awareness.
airlines heading for Chapter 11.                  Market Penetration: Start flying internationally
Set up TV adds to advertise Jet Blue low price    to increase profits.
and their product differentiation.                Product Development: Add new fleet of
                                                  airplanes.
             ST STRATEGIES                                   WT STRATEGIES
Horizontal Integration: Take over emerging        Revise/optimize their flight schedule, timings
discount airlines.                                and destinations to improve the number of
Introduce programs to build confidence of         diverted flights and to improve the high break-
trade unions.                                     even load factor.
Raise awareness on their security measures
(bulletproof cockpit).
Market Focus Matrix
                                                     17

              Embryonic                    Growth                      Mature                        Aging
Dominant


                                                                                                Defend position
                                          Fast Grow                Defend Position
                Fast grow                                                                           Focus
                                    Attain cost leadership      Attain cost leadership
                 Start up                                                                           Renew
                                   Renew Defend position       Renew Defend position
                                                                                               Grow with industry

                                          Fast Grow             Attain cost leadership            Find niche
                  Start up
Strong


                                           catch-up                  renew, focus                 Hold niche
               differentiate
                                    attain cost leadership           differentiate                  Hang-in
                 fast grow
                                         differentiate           grow with industry        Grow with industry, harvest
Favorable


                                         Differentiate             Harvest, catch-up
                  Start up
                                             focus                hold niche. Hand-in              Retrench
               differentiate
                                           catch-up                   turn around                 Turn around
                   focus
                                      grow with industry       focus, grow with industry

                                       Harvest, catch-up                Harvest
Tenable


                 Start up                                                                     Divert
                                      hold niche. Hand-in            turn around             Retrench
            grow with industry
                                          turn around                 find niche
                  focus
                                   focus, grow with industry           retrench

               Find Niche                Turn Around             Withdraw divest
                catch-up                   Retrench
Weak


            grow with industry                                                                    Withdraw
Quantitative Strategic Planning Matrix


                             QSPM
                              STRATEGY 1   STRATEGY 2   STRATEGY 3
                                             Expand       Acquire
                               Buy new
                                            Marketing     United
                                Fleet
                                            channels      Airlines
External Factor Evaluation       1.31         1.27           1.87
Internal Factor Evaluation       3.42         3.23           2.64
           TOTAL SCORES         4.73          4.5            4.51


                                                        18
 Manufacturer: Airbus    Seating capacity: 180 passengers    Fuel Efficiency

 Cost: $85 million       Range: 6,000 km                     CR
 Competitors: Boeing 717  Speed: 871 km/h                    Complexity
  & 737                   Cargo capacity: 40 m3
Recommendation
                                             20
As per the Strategy formulation, we recommend 3 strategies:
Strategy 1: Market Development
Add domestic locations and fly internationally, extend flights to major hubs in Europe to
start off, then as that takes off, offer flights to Asia, Australia, etc. The new planes will
mitigate risk of losing customers due to unplanned delays.
Cost: $600 million for 7 planes, fuel for a year and maintenance & hiring costs.

Strategy 2: Market Penetration
By increasing advertising and Expand to Other Media. JetBlue could advertise on TV,
Radio, and Online to boost revenues and popularity of the airline instead of heavily
depending on word of mouth.
Cost: About $4,000,000.

Strategy 3: Related Diversification:
Build Partnership Travel Website. In this website, users can look up information about
different travel destinations, find hotels, restaurants, hot spots, etc, and book a flight
through JetBlue all while comparing prices from other airlines.
Cost: About $30,000 to start off, then about $60,000 per year to maintain (for a small site).
Recommendation
                                 21
How to Play?

JetBlue should implement these strategies in three stages.

Introductory Phase – Implement new advertising campaigns to raise
awareness in target markets simultaneously adding 7 new planes to
their fleet.

Middle Phase – Start the travel website to help attract new people to
JetBlue, get them to fly, and build a reputation.

End Phase – Start flying internationally. Once customers know JetBlue
and JetBlue gains a reputation for high quality and low prices, people
will want to fly them no matter where they go.

Horizontal Integration in the Long Term.
Annual Objectives

Deliver the Decade

   8-10%        Sales       10%+
               Growth
                             Profit    13%
                            Growth
  +0.6%         Margin
  pts/yr     Improvement               TSR
                           Cash Flow
  45% GM        Asset       Growth     60 P/E
  1.78c CL
              Efficiency
                             90%
Strategy Evaluation

Over the next decade, JetBlue strategy will be
 evaluated annually based on 4 perspectives:

 Financial performance
 Customer Knowledge
 Internal Business Processes
 Learning & Growth


                                            23
THANK YOU
for flying with us


                     24

Jet Blue Airways - Strategic Management Case Study

  • 1.
    JETBLUE AIRWAYS CORPORATION - 2005 A Strategic Management Case
  • 2.
    Outline 2 Introduction Strategy Formulation Stage Vision & Mission Formulation SLEPT Analysis CPM, EFE, IFE SWOT, SPACE, Market Focus Matrix IE, Grand Strategy Matrix QSPM Strategy Implementation Stage Recommendations Annual Objectives and Policies Strategy Evaluation Stage
  • 3.
    Introduction 3  High competition in US airline industry.  JetBlue  Established in 1998 and started service in 2000  Goal has been to establish itself as a leading low-fare, low-cost passenger airline by offering customers high-quality customer service and differentiated products.  Focus on underserved markets.  108 flights in 2002 and 316 in 2005 serving 32 destinations.  By mid 2005, fleet of 77 new Airbus A320 Aircraft  Stock price $20 in 2002 and peaked at $26.4 in 2005.
  • 4.
    Introduction 4  JetBlue Facts Sheet  First and only US to launch with more than 100 million in capital  First and only to offer 24 channels of live satellite free at every seat.  First and only to broadcast the Olympics live at every seat.  First to introduce “paperless cockpit” technology.  Only US to be 100% ticketless.  First to install bulletproof cockpit doors.  First and only to install security cameras.  Major Competitors  American  Southwest  United
  • 5.
    Vision & Mission 5 PROPOSED VISION At JetBlue our vision is to be the best regional air carrier by providing low-fare, low-cost, enjoyable and safe flight experiences to our passengers.
  • 6.
    Vision & Mission 6 Proposed Mission Statements Jet Blue’s mission is to be the leading low-fare, low-cost passenger airline offering high quality customer service to underserved markets and customers who are looking for the best value in their flight. We have the newest most advanced planes that are reliable, safe, fuel efficient, utilizing advanced technologies, and unique in multimedia entertainments. Our philosophy is to give customers the best price value for their ticket and maintaining distinctive services. At JetBlue we hire highly motivated employees and train them to reach a high level of competency to provide better experiences to customers. We believe that our high-value, high quality service philosophy will lead the way to becoming the number one in the industry.
  • 7.
    External Opportunities andThreats 7 SLEPT Analysis SLEPT Influences External Opportunities External Threats Social 200 million passengers will be Obese passengers contributing carried in 2005 (4.1% increase to high fuel consumption costs than previous year) (275 million additional cost to High demand for air travel airlines) Legal Increase in labor wages Union labor contract & strikes Bankruptcy of many rival Mergence of competing airlines airlines New regulations New regulations Environmental and Ethical None High oil prices Availability of Jet fuel Political None Rising security rules and obligations. Technological Utilization of the internet for Reliability of the internet and sales system downtime. New airplanes fleet
  • 8.
    Competitive Profile Matrix(CPM) 8 High Demand Weight JetBlue High Sales American Southwest United Market 0.10 3.00 3.00 4.00 1.00 Capitalization Employees 0.10 4.00 1.00 3.00 2.00 Quarterly Rev 0.12 4.00 2.00 2.00 1.00 Growth Revenue 0.10 4.00 4.00 4.00 4.00 Gross Margin 0.10 4.00 3.00 4.00 2.00 Net Income 0.12 3.00 2.00 4.00 1.00 EPS 0.10 High Efficiency 3.00 1.00 4.00 1.00 Low cost P/S 0.08 4.00 1.00 4.00 1.00 Expense 0.18 4.00 2.00 2.00 2.00 Passenger Miles Total 1.00 3.68 2.12 3.30 1.68
  • 9.
    External Factor Analysis 9 Factors Weight Rating Weighted Score Opportunities Rapid growth of discount airlines due to bankruptcy of rival airlines 0.06 3 0.18 200 million passengers will be carried in 2005 (more than the year before by 4.1%) 0.08 3 0.24 Air travel is much safer than other means of transportation 0.05 4 0.2 Emergence of new federal laws enhancing security in airports 0.04 3 0.12 Threat 0 High oil or jet fuel prices 0.08 4 0.32 Union labor contracts, wages, benefits & strikes 0.09 4 0.36 Fierce competition from other rival airlines 0.07 3 0.21 Availability of jet fuel 0.09 3 0.27 Market is maturing 0.07 3 0.21 Rapid growth of discount airlines 0.05 3 0.15 Emergence of new US federal laws (e.g., change in daylight saving time) 0.07 2 0.14 Pricing is weak 0.05 4 0.2 Obese passengers contributing to high fuel consumption & negative environmental impact 0.06 3 0.18 Rising security rules and obligations 0.08 4 0.32 Rising breakeven load factor 0.06 3 0.18 Total Weighted Total weight 1 Score 3.28
  • 10.
    Internal Factor Evaluation Factors 10 Weight Rating Weighted Score Opportunities Deployment of technology in terms of paperless tickets (i.e., e-commerce) 0.08 4 0.32 Attention to security in terms of bullet-proof in cockpit cabin and cameras in passenger cabins 0.09 4 0.36 JetBlue fleet maintains a new fleet of aircrafts 0.06 4 0.24 JetBlue offer in-flight entertainment 0.06 3 0.18 JetBlue hires the best crew in terms of skills and employees 0.08 3 0.24 Jet Blue has a very well clear strategy in terms of leadership 0.09 4 0.36 JetBlue offers exceptional training physical resources to company employees 0.08 4 0.32 Availability of customer service management 0.07 3 0.21 JetBlue has the lowest labor wages compared to other rival airlines ($3.13 with each seat flown) 0.05 4 0.2 JetBlue has a loyalty program, named TrueBlue, which rewards program members 0.03 3 0.09 JetBlue maintains a higher net income ($39.24M) compared to industry ($27.61) 0.03 2 0.06 JetBlue maintains a higher revenue ($1.35B) compared to industry ($1.24B) 0.03 2 0.06 JetBlue maintains a higher operating margin (7.84%) than its industry (6.86%) 0.02 3 0.06 JetBlue has a high market capitalization ($2.19B)compared to industry ($536.6M) 0.02 2 0.04 JetBlue maintained a higher P/E ratio (59.21) compared to industry (14.16) 0.03 3 0.09 JetBlue has a high P/S ratio (1.63) compared to industry (0.42) 0.03 2 0.06 JetBlue maintained a high gross margin (36.12%) compared to industry (23.08%) and other rival airlines 0.03 3 0.09 JetBlue has a higher quarterly revenue growth (29.5%) compared to industry (20.4%) and other rival airlines 0.03 2 0.06 Threat JetBlue reported a high PEG ratio (3.90) compared to industry (0.93) 0.04 1 0.04 JetBlue reported low EBITDA (191.54) compared to industry (154.38M) 0.05 2 0.1 Total Weighted Total weight 1 Score 3.18
  • 11.
    Internal-External Matrix 11 4 3 2 1 I II III 3 IFE IV V VI 2 VII VIII IX 1 EFE
  • 12.
  • 13.
  • 14.
    SWOT analysis 14 STRENGTHS WEAKNESSES Constant financial growth over past 3 years. Relatively new company. Low operating cost and labor cost due to Serving only 13 States. strong utilization of resources. Low fares could mean less profit. High service passenger airline. Lower percentage of full time employees Comfortable accommodation. compared to competitors. Product differentiation due to unique in-flight Lowest in market cap among competitors. digital entertainment systems. Single fleet of planes (77 Airbus A320 Aircraft Known for being efficient and on time. only). Dedicated staff due to their strong hiring Relying mostly on word of mouth advertising. process. Higher percentage of airborne time and 75.4% online reservation – Effective use of higher number of diverted flights than website. competitors. 100% ticketless.
  • 15.
    SWOT analysis OPPORTUNITIES THREATS Northwest may be heading for Risk of strikes (Trade Unions) Chapter 11. Fuel price and fuel availability. Demand in air travel predicted to Risks of hedging fuel. increase by 4.1%. Break-even load factor is increasing. Possibility of senate approving Rapid growth of discount airlines. daylight savings hitting competitors in Strong competitions as competitors EO market. move to Cost leadership strategy. Using luggage tracking technology Some competitors are merging to rival could help in the lost luggage with discount airlines. department. New taxes from govt. Security & Terrorism 15
  • 16.
    SWOT analysis 16 SO STRATEGIES WO STRATEGIES Market Penetration: Expand and offer flights Raise fares slightly but keep it lower than to Europe and market their superior price value competitors. to Europe. Advertise on TV to increase customer Market Penetration: Capture markets of awareness. airlines heading for Chapter 11. Market Penetration: Start flying internationally Set up TV adds to advertise Jet Blue low price to increase profits. and their product differentiation. Product Development: Add new fleet of airplanes. ST STRATEGIES WT STRATEGIES Horizontal Integration: Take over emerging Revise/optimize their flight schedule, timings discount airlines. and destinations to improve the number of Introduce programs to build confidence of diverted flights and to improve the high break- trade unions. even load factor. Raise awareness on their security measures (bulletproof cockpit).
  • 17.
    Market Focus Matrix 17 Embryonic Growth Mature Aging Dominant Defend position Fast Grow Defend Position Fast grow Focus Attain cost leadership Attain cost leadership Start up Renew Renew Defend position Renew Defend position Grow with industry Fast Grow Attain cost leadership Find niche Start up Strong catch-up renew, focus Hold niche differentiate attain cost leadership differentiate Hang-in fast grow differentiate grow with industry Grow with industry, harvest Favorable Differentiate Harvest, catch-up Start up focus hold niche. Hand-in Retrench differentiate catch-up turn around Turn around focus grow with industry focus, grow with industry Harvest, catch-up Harvest Tenable Start up Divert hold niche. Hand-in turn around Retrench grow with industry turn around find niche focus focus, grow with industry retrench Find Niche Turn Around Withdraw divest catch-up Retrench Weak grow with industry Withdraw
  • 18.
    Quantitative Strategic PlanningMatrix QSPM STRATEGY 1 STRATEGY 2 STRATEGY 3 Expand Acquire Buy new Marketing United Fleet channels Airlines External Factor Evaluation 1.31 1.27 1.87 Internal Factor Evaluation 3.42 3.23 2.64 TOTAL SCORES 4.73 4.5 4.51 18
  • 19.
     Manufacturer: Airbus  Seating capacity: 180 passengers  Fuel Efficiency  Cost: $85 million  Range: 6,000 km  CR  Competitors: Boeing 717  Speed: 871 km/h  Complexity & 737  Cargo capacity: 40 m3
  • 20.
    Recommendation 20 As per the Strategy formulation, we recommend 3 strategies: Strategy 1: Market Development Add domestic locations and fly internationally, extend flights to major hubs in Europe to start off, then as that takes off, offer flights to Asia, Australia, etc. The new planes will mitigate risk of losing customers due to unplanned delays. Cost: $600 million for 7 planes, fuel for a year and maintenance & hiring costs. Strategy 2: Market Penetration By increasing advertising and Expand to Other Media. JetBlue could advertise on TV, Radio, and Online to boost revenues and popularity of the airline instead of heavily depending on word of mouth. Cost: About $4,000,000. Strategy 3: Related Diversification: Build Partnership Travel Website. In this website, users can look up information about different travel destinations, find hotels, restaurants, hot spots, etc, and book a flight through JetBlue all while comparing prices from other airlines. Cost: About $30,000 to start off, then about $60,000 per year to maintain (for a small site).
  • 21.
    Recommendation 21 How to Play? JetBlue should implement these strategies in three stages. Introductory Phase – Implement new advertising campaigns to raise awareness in target markets simultaneously adding 7 new planes to their fleet. Middle Phase – Start the travel website to help attract new people to JetBlue, get them to fly, and build a reputation. End Phase – Start flying internationally. Once customers know JetBlue and JetBlue gains a reputation for high quality and low prices, people will want to fly them no matter where they go. Horizontal Integration in the Long Term.
  • 22.
    Annual Objectives Deliver theDecade 8-10% Sales 10%+ Growth Profit 13% Growth +0.6% Margin pts/yr Improvement TSR Cash Flow 45% GM Asset Growth 60 P/E 1.78c CL Efficiency 90%
  • 23.
    Strategy Evaluation Over thenext decade, JetBlue strategy will be evaluated annually based on 4 perspectives:  Financial performance  Customer Knowledge  Internal Business Processes  Learning & Growth 23
  • 24.