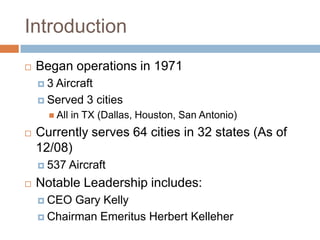
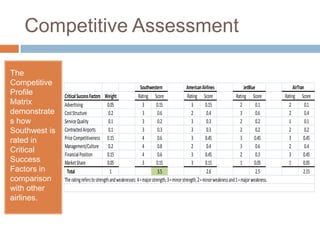
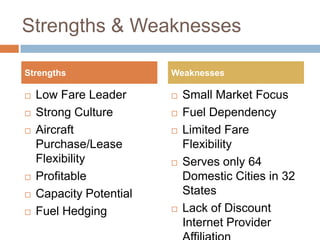
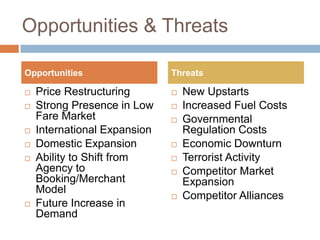
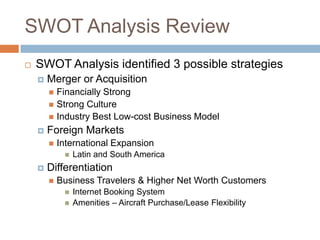
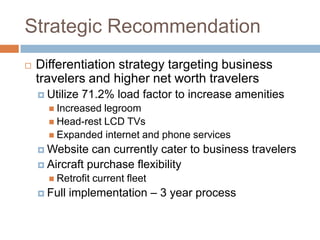
SOUTHWEST AIRLINES
Strategic Analysis Presentation
Introduction
   Began operations in 1971
    3 Aircraft
     Served 3 cities
       All   in TX (Dallas, Houston, San Antonio)
   Currently serves 64 cities in 32 states (As of
    12/08)
     537     Aircraft
   Notable Leadership includes:
     CEO  Gary Kelly
     Chairman Emeritus Herbert Kelleher
Mission & Employee
Commitment
   Current Employee Commitment provides
    excellent guidance

   Recommend a revision of Southwest’s Mission
    Statement

   Southwest lacks a visible Vision Statement
Competitive Assessment

The
Competitive
                                                               Southwestern                   American Airlines                  JetBlue               AirTran
Profile        Critical Success Factors Weight                Rating Score                    Rating Score                  Rating Score          Rating Score
Matrix         Advertising                 0.05                  3        0.15                  3         0.15                 2         0.1        2          0.1
demonstrate    Cost Structure               0.2                  3         0.6                  2          0.4                 3         0.6        2          0.4
s how          Service Quality              0.1                  3         0.2                  3          0.3                 2         0.2        1          0.1
Southwest is   Contracted Airports          0.1                  3         0.3                  3          0.3                 2         0.2        2          0.2
rated in       Price Competitiveness 0.15                        4         0.6                  3         0.45                 3        0.45        3         0.45
               Management/Culture           0.2                  4         0.8                  2          0.4                 3         0.6        2          0.4
Critical
               Financial Position          0.15                  4         0.6                  3         0.45                 2         0.3        3         0.45
Success        Market Share                0.05                  3        0.15                  3         0.15                 1        0.05        1         0.05
Factors in       Total                       1                             3.5                             2.6                           2.5                  2.15
comparison     The rating refers to strength and weaknesses: 4 = major strength, 3 = minor strength, 2 = minor weakness and 1 = major weakness.
with other
airlines.
Internal Assessment

                                                             Key Internal Factors
                Opportunities                                                                     Weight       Rating     Score
The Internal              1 Ticket Price Restructuring                                             0.025         3        0.075
                          2 Existing Capacity Potential                                             0.1          3         0.3
Factor                    3 Strong Presence in Low Fare Market                                      0.15         4         0.6
Evaluation                4 Ability to shift from Agency to Booking/Merchant Model                 0.025         2         0.05
                          5 One fleet/engine type                                                   0.1          4         0.4
shows                     6 High Service Quality                                                    0.05         4         0.2
several                   7 Strong Credit Rating                                                    0.1          4         0.4

strong                    8 Financial Ratios                                                        0.1          3         0.3

Opportunitie    Threats                                                                           Weight       Rating     Score
s and                     1 Labor/Union Strike                                                     0.025         2         0.05
                          2 Competitive Price Movement Response Ability                             0.05         1         0.05
relatively                3 Lack of International Presence                                          0.1          1         0.1
weak                      4 Strong Dependency on Fuel                                               0.15         1         0.15
                          5 Small Market Focus                                                     0.025         2         0.05
Threats.                    Total                                                                    1                    2.725
               The rating refers to strength and weaknesses: 4 = major strength, 3 = minor strength, 2 = minor weakness and 1 = major weakness.
External Assessment

                                                             Key External Factors
                Opportunities                                                               Weight         Rating        Score
The External                        1 Increased Domestic Travel                                0.1           3            0.3
Factor                              2 Increased International Travel                          0.05           2            0.2
                                    3 Integrated Consumer Technology                          0.05           2            0.1
Evaluation                          4 Aircraft Purchase Flexibility                            0.1           4            0.4
shows few                           5 Commercial Leases                                       0.05           2            0.1
                                    6 Increased Commercial Freight Demand                     0.05           1           0.05
strong                              7 Increased Business Travel Demand                         0.1           2            0.2
Opportunitie
                Threats                                                                     Weight         Rating        Score
s and
                                    1 Increased Competition/new upstarts                      0.05           2            0.1
several                             2 High Fuel Costs                                         0.15           4            0.6
significant                         3 Governmental Regulation/Cost                            0.05           3           0.15
                                    4 Competitor Alliances                                     0.1           2            0.2
Threats.                            5 Economic Downturn                                        0.1           3            0.3
                                    6 Terrorist Activity                                      0.05           2            0.1
                                      Total                                                     1                         2.7
               The rating refers to strength and weaknesses: 4 = major strength, 3 = minor strength, 2 = minor weakness and 1 = major weakness.
Financial Analysis

2008 Profitability Highlights        2008 Debt Highlights
   Year-over-year revenue              Southwest’s1.0 current
    growth of 11.8% is                   ratio is on par with the
    considerably above the Major         industry average
    Airlines Sub-Industry average
    of 8.5%.                            Debt-to-capital of 22.8% is
   Gross margin of 34.37% is            far below the industry
    above the Major Airlines Sub-        average of 73.8%. The
    Industry average of 28.9%.           five year average of 20.8%
                                         is also far lower than the
   Net margin of 1.61% is below         industry average of 65.9%.
    its five-year average of 5.1%.
   ROE of 3.6% ranks 3 out of          Debt to equity ratio of
    11 within its Major Airlines         188.8%
    Sub-Industry
Financial Analysis

2008 Investor Analysis        2008 Cash Highlights

   Earnings per Share of        Substantial liquidity in
    $0.24                         the form of cash on
                                  hand of $1.4 billion at
   Price/Earnings Ratio of       the end of 2008
    35.92                        Enviable cash ratio of
   Dividend Yield of 2.09%       0.64
   Book Value per Share         Low Days' Sales in
    of $6.13                      Receivables of 6.92
   Degree of Financial          High Days' Sales in
    Leverage of 1.38              Inventory of 10.24
Strengths & Weaknesses

Strengths                Weaknesses

   Low Fare Leader         Small Market Focus
   Strong Culture          Fuel Dependency
   Aircraft                Limited Fare
    Purchase/Lease           Flexibility
    Flexibility             Serves only 64
   Profitable               Domestic Cities in 32
   Capacity Potential       States
   Fuel Hedging            Lack of Discount
                             Internet Provider
Opportunities & Threats

Opportunities                 Threats

   Price Restructuring          New Upstarts
   Strong Presence in Low       Increased Fuel Costs
    Fare Market                  Governmental
   International Expansion       Regulation Costs
   Domestic Expansion           Economic Downturn
   Ability to Shift from        Terrorist Activity
    Agency to                    Competitor Market
    Booking/Merchant              Expansion
    Model
                                 Competitor Alliances
   Future Increase in
    Demand
SWOT Analysis Review
   SWOT Analysis identified 3 possible strategies
       Merger or Acquisition
         Financially Strong
         Strong Culture
         Industry Best Low-cost Business Model
       Foreign Markets
           International Expansion
                Latin and South America
       Differentiation
           Business Travelers & Higher Net Worth Customers
                Internet Booking System
                Amenities – Aircraft Purchase/Lease Flexibility
Strategic Recommendation
   Differentiation strategy targeting business
    travelers and higher net worth travelers
     Utilize   71.2% load factor to increase amenities
       Increased legroom
       Head-rest LCD TVs
       Expanded internet and phone services
     Website   can currently cater to business travelers
     Aircraft purchase flexibility
       Retrofit   current fleet
     Full   implementation – 3 year process
Financial Forecast
   The following assumes implementation of
    recommendation:
     2009 – Flat revenue & net income when compared to
      2008
     2010 – Economic relief and increased travel activity
      should spur $12 billion in revenue and $500 million
      net income
     2011 – Steeper rise in revenue and net income due to
      higher percentage of business travelers to $13 billion
      and $600 million
     2012 – Implementation of plan fully realized with $15
      billion in revenue and $725 million net income
Thank you for your valuable time
Joshua Sigmon
April 26th, 2009

Southwest Airlines

  • 1.
  • 2.
    Introduction  Began operations in 1971 3 Aircraft  Served 3 cities  All in TX (Dallas, Houston, San Antonio)  Currently serves 64 cities in 32 states (As of 12/08)  537 Aircraft  Notable Leadership includes:  CEO Gary Kelly  Chairman Emeritus Herbert Kelleher
  • 3.
    Mission & Employee Commitment  Current Employee Commitment provides excellent guidance  Recommend a revision of Southwest’s Mission Statement  Southwest lacks a visible Vision Statement
  • 4.
    Competitive Assessment The Competitive Southwestern American Airlines JetBlue AirTran Profile Critical Success Factors Weight Rating Score Rating Score Rating Score Rating Score Matrix Advertising 0.05 3 0.15 3 0.15 2 0.1 2 0.1 demonstrate Cost Structure 0.2 3 0.6 2 0.4 3 0.6 2 0.4 s how Service Quality 0.1 3 0.2 3 0.3 2 0.2 1 0.1 Southwest is Contracted Airports 0.1 3 0.3 3 0.3 2 0.2 2 0.2 rated in Price Competitiveness 0.15 4 0.6 3 0.45 3 0.45 3 0.45 Management/Culture 0.2 4 0.8 2 0.4 3 0.6 2 0.4 Critical Financial Position 0.15 4 0.6 3 0.45 2 0.3 3 0.45 Success Market Share 0.05 3 0.15 3 0.15 1 0.05 1 0.05 Factors in Total 1 3.5 2.6 2.5 2.15 comparison The rating refers to strength and weaknesses: 4 = major strength, 3 = minor strength, 2 = minor weakness and 1 = major weakness. with other airlines.
  • 5.
    Internal Assessment Key Internal Factors Opportunities Weight Rating Score The Internal 1 Ticket Price Restructuring 0.025 3 0.075 2 Existing Capacity Potential 0.1 3 0.3 Factor 3 Strong Presence in Low Fare Market 0.15 4 0.6 Evaluation 4 Ability to shift from Agency to Booking/Merchant Model 0.025 2 0.05 5 One fleet/engine type 0.1 4 0.4 shows 6 High Service Quality 0.05 4 0.2 several 7 Strong Credit Rating 0.1 4 0.4 strong 8 Financial Ratios 0.1 3 0.3 Opportunitie Threats Weight Rating Score s and 1 Labor/Union Strike 0.025 2 0.05 2 Competitive Price Movement Response Ability 0.05 1 0.05 relatively 3 Lack of International Presence 0.1 1 0.1 weak 4 Strong Dependency on Fuel 0.15 1 0.15 5 Small Market Focus 0.025 2 0.05 Threats. Total 1 2.725 The rating refers to strength and weaknesses: 4 = major strength, 3 = minor strength, 2 = minor weakness and 1 = major weakness.
  • 6.
    External Assessment Key External Factors Opportunities Weight Rating Score The External 1 Increased Domestic Travel 0.1 3 0.3 Factor 2 Increased International Travel 0.05 2 0.2 3 Integrated Consumer Technology 0.05 2 0.1 Evaluation 4 Aircraft Purchase Flexibility 0.1 4 0.4 shows few 5 Commercial Leases 0.05 2 0.1 6 Increased Commercial Freight Demand 0.05 1 0.05 strong 7 Increased Business Travel Demand 0.1 2 0.2 Opportunitie Threats Weight Rating Score s and 1 Increased Competition/new upstarts 0.05 2 0.1 several 2 High Fuel Costs 0.15 4 0.6 significant 3 Governmental Regulation/Cost 0.05 3 0.15 4 Competitor Alliances 0.1 2 0.2 Threats. 5 Economic Downturn 0.1 3 0.3 6 Terrorist Activity 0.05 2 0.1 Total 1 2.7 The rating refers to strength and weaknesses: 4 = major strength, 3 = minor strength, 2 = minor weakness and 1 = major weakness.
  • 7.
    Financial Analysis 2008 ProfitabilityHighlights 2008 Debt Highlights  Year-over-year revenue  Southwest’s1.0 current growth of 11.8% is ratio is on par with the considerably above the Major industry average Airlines Sub-Industry average of 8.5%.  Debt-to-capital of 22.8% is  Gross margin of 34.37% is far below the industry above the Major Airlines Sub- average of 73.8%. The Industry average of 28.9%. five year average of 20.8% is also far lower than the  Net margin of 1.61% is below industry average of 65.9%. its five-year average of 5.1%.  ROE of 3.6% ranks 3 out of  Debt to equity ratio of 11 within its Major Airlines 188.8% Sub-Industry
  • 8.
    Financial Analysis 2008 InvestorAnalysis 2008 Cash Highlights  Earnings per Share of  Substantial liquidity in $0.24 the form of cash on hand of $1.4 billion at  Price/Earnings Ratio of the end of 2008 35.92  Enviable cash ratio of  Dividend Yield of 2.09% 0.64  Book Value per Share  Low Days' Sales in of $6.13 Receivables of 6.92  Degree of Financial  High Days' Sales in Leverage of 1.38 Inventory of 10.24
  • 9.
    Strengths & Weaknesses Strengths Weaknesses  Low Fare Leader  Small Market Focus  Strong Culture  Fuel Dependency  Aircraft  Limited Fare Purchase/Lease Flexibility Flexibility  Serves only 64  Profitable Domestic Cities in 32  Capacity Potential States  Fuel Hedging  Lack of Discount Internet Provider
  • 10.
    Opportunities & Threats Opportunities Threats  Price Restructuring  New Upstarts  Strong Presence in Low  Increased Fuel Costs Fare Market  Governmental  International Expansion Regulation Costs  Domestic Expansion  Economic Downturn  Ability to Shift from  Terrorist Activity Agency to  Competitor Market Booking/Merchant Expansion Model  Competitor Alliances  Future Increase in Demand
  • 11.
    SWOT Analysis Review  SWOT Analysis identified 3 possible strategies  Merger or Acquisition  Financially Strong  Strong Culture  Industry Best Low-cost Business Model  Foreign Markets  International Expansion  Latin and South America  Differentiation  Business Travelers & Higher Net Worth Customers  Internet Booking System  Amenities – Aircraft Purchase/Lease Flexibility
  • 12.
    Strategic Recommendation  Differentiation strategy targeting business travelers and higher net worth travelers  Utilize 71.2% load factor to increase amenities  Increased legroom  Head-rest LCD TVs  Expanded internet and phone services  Website can currently cater to business travelers  Aircraft purchase flexibility  Retrofit current fleet  Full implementation – 3 year process
  • 13.
    Financial Forecast  The following assumes implementation of recommendation:  2009 – Flat revenue & net income when compared to 2008  2010 – Economic relief and increased travel activity should spur $12 billion in revenue and $500 million net income  2011 – Steeper rise in revenue and net income due to higher percentage of business travelers to $13 billion and $600 million  2012 – Implementation of plan fully realized with $15 billion in revenue and $725 million net income
  • 14.
    Thank you foryour valuable time Joshua Sigmon April 26th, 2009