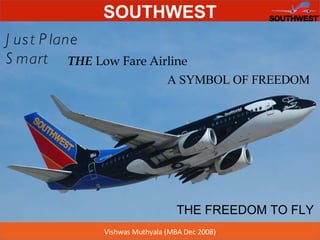
Just Plane Smart THE  Low Fare Airline A SYMBOL OF FREEDOM THE FREEDOM TO FLY
WHO ARE WE? Founded in 1971 Largest airline in the world by number of passengers carried 6 th  Largest US airline by revenues 4 th  Largest commercial airline in the world by fleet size 64 destinations in 32 states with 3,300 flights a day More than 33,000 employees; 87% unionized
WHO ARE WE? The Mission of Southwest Airlines To provide safe and comfortable air transportation in commuter and short-haul markets, from close-in airports, at prices competitive with automobiles and buses and to involve customers and employees in the product and the process, making the airline a fun, profitable and quality experience.  The Vision of Southwest Airlines Dedication to the highest quality of Customer Service delivered with a sense of warmth, friendliness, individual pride, and Company Spirit.
Internal Rivalry :  High Price is primary differentiator Exit Barriers are high Difficult to dispose of planes Loss making companies take longer to close down Threat of New Entrants  :  Medium - Large Capital Requirement High Political leverage requirement Threat of Substitutes :  Low No other alternatives to very long distances Low threat of other means of transportation because air fares are relatively inexpensive Supplier Power :  Medium High competition High switching costs for customer No threat of forward integration by supplier Gov’t / Airports have limited facilities – gates, hangars, etc Buyer Power:   Medium - Price Sensitive Destination Dependent Not concentrated No threat of backward integration Porter’s Five Forces The US Low Cost Carrier industry is seen as moderately attractive. This is because the opportunity exists to enter the industry with used or leased planes.
Target Market First-time Fliers Business Travelers (Point – to – Point)  Dissatisfied customers from full-service airlines People who travel by Road, Rail Leisure family  travelers
Key Success Factors (Low Cost Carrier Industry) Low Fares More destinations Operational Efficiency Turn Around Time Hub / Secondary Locations Aircraft Utilization Single Model Usage On time Performance Service Standards (Basic) Safety  (Threshold)
Market Share (US Airline Industry)
Market Share – US Low Cost Career (LCC) Industry Southwest Airlines is, by far, the largest Low Cost Carrier in the US market
FRILLS FARES Fares and the level of Frills offered are the key differentiators between the Low Cost Carriers and the Full Service Airlines
FARES ONTIME On-time performance and fares are a key differentiator within the LCC industry
FARES DESTINATIONS Destinations covered do not come out as a major differentiator as can be seen from US Airways and Southwest.
FARES SERVICE Service = No. of Customer Complaints per 100,000 passengers 0.00 3.50 The level of service / passenger care, shown here in the form of number of customer complaints / 100,000 passengers, is also a key separator.
ONTIME SERVICE Service = No. of Customer Complaints per 100,000 passengers 0.00 3.50 Level of service / passenger care and on-time performance together give a much clearer picture.
ONTIME Plane  Models Plane Models = No. of distinct Airplane  Models in the fleet 1 10 2 The number of distinct plane models used in the fleet is also a key factor. Southwest is the only airline which uses only the Boeing 737 family of airplanes in it’s fleet.
DESTINATIONS SERVICE Service = No. of Customer Complaints per 100,000 passengers 0.00 3.50 This map further reinforces the weightage of Service / Passenger Care over Destinations covered.
KSF MATRIX The weights to the various KSFs and the relative score of the competitors bears out the large lead in Market Share that Southwest Airlines enjoys. SWA scores over the competition in all the critical KSFs. Key Success Factors Weightage Southwest US Air AirTran JetBlue Alaska Air ExpressJet Low Fares 30% 9 8 8 9 7 6 More Destinations 15% 5 9 5 5 6 7 Operational Efficiency 30% 9 7 8 7 7 7 Service 20% 9 6 5 5 5 6 Safety 5% 9 8 8 6 6 6 Score 100% 41 38 34 32 31 32                 Weighted Score   8.4 7.45 6.95 6.85 6.4 6.4                 Market Share   40.9% 14.5% 9.5% 8.2% 6.1% 6.0%
COMPETENCY LADDER Human and Financial Capital Difficulties in inorganic growth Brand Image Cost & Service Culture INCOMPETENCIES PERIPHERAL THRESHOLD COMPETITIVE ADVANTAGE COMPETENCIES STRATEGIC DISTINCTIVE SUSTAINABLE COMPETITIVE ADVANTAGE Operating Efficiency Technology for cost reduction Team of talented people Mgt of human capital Excellent Union Relations
LONG TERM OBJECTIVES Expand to near-international locations with coach fares Target a growth of 4-5 % per annum Generate additional revenues thru Southwest.com Introduce and sustain Business Select* Deliver more to the customer through Rapid Rewards (frequent flyer program) *Business Select is an option for customers to pay slightly higher fares in return for first boarding privileges (no assigned seating), a free cocktail, extra credit on Rapid Rewards. # The Long Term Objectives have been extracted from a webcast of the speech made by Ms. Laura Wright, CFO – Southwest Airlines on the18th of March, 2008 at the JP Morgan Aviation & Transportation Conference http://www.southwest.com/investor_relations/fs_events_calendar.html
VALUE PROPOSITION KEY SUCCESS FACTORS Low Fares (30%) More destinations (10%) Operational Efficiency (30%) Turn Around Time Hub / Secondary Locations Aircraft Utilization Single Model Usage On time Performance Service Standards (Basic) (20% ) Safety (10%) STRATEGIC COMPETENCIES Cost & Service culture Team of talented people Operating Efficiency Technology for cost reduction Mgt of human capital Excellent Union Relations  Southwest Airlines provides  reliable  service and  passenger care  at the  lowest fares  to the short haul, frequent-flying, point-to-point, non-interlining traveler.
SWOT STRENGTH Cost & Service culture Operational Efficiency Brand Image Low Fares Customer Service WEAKNESSES Inability to grow inorganically Does not serve international routes OPPORTUNITY Increasing tourism to Non-US North American destinations Gain further market share from full-service airlines Introducing flights to non-US North American destinations (S1, S2, S3, S4, S5, O1) Increase the number of destinations served (S2, S3, S4, O2) Tie-up with full-service airlines to serve international routes (W2, O2) Provide last-mile connectivity to other LCCs from outside US (W1, O1, O2) THREAT Full-service airlines emulating low cost model Difficulty in securing gates in major airports Increase the number of destinations served (S2, S3, S4, T1) Enter gate-sharing agreements in Major airports (S3, S2, T2) Tie-up with full-service airlines to serve international routes (W2, T2, T1)
Strategic Options Filter Strategic Options  KSFs LTO Strategic Competencies Vision / Mission Final Score 35% 25% 20% 20%   S1, S2, S3, S4, S5, O1 Introducing new flights to non-US North American destinations 8 8 8 7 7.8 S2, S3, S4, O2 / S3, S4, T1 Increase number of destinations served 8 7 7 8 7.55 S3, S2, T2 Enter gate-sharing agreements in Major airports 6 6 6 7 6.2 W2, O2 / W2, T2, T1 Tie-up with full service airlines to serve international routes 7 5 8 6 6.5 W1, O1, O2 Provide last-mile connectivity to other LCCs from outside US 8 7 8 6 7.35
Recommendations Introduce flights to non-US North American destinations (within range of the Boeing 737) Increase the number of destinations served within the US. Provide  last-mile connectivity*  to other Low Cost Carriers from outside the US. *  By last-mile connectivity, I am looking at travelers going to destinations close to the US like the Caribbean. For example, a flyer from Miami, Florida might have LCC options to take him to Jamaica, but a flyer from New York would be forced to fly full-service airlines. Southwest could tie-up with LCCs from the Caribbean to get these passengers from New York to Miami and hence create a win-win situation for everyone.
References www.southwest.com www.jetblue.com www.usairways.com www.alaskaair.com www.expressjet.com www.airtran.com www.wikipedia.org US Department of Transportation – Bureau of Transport Statistics  Air Travel Consumer Report (Feb 2008) – Office of Aviation Enforcement & Proceedings (Aviation Consumer Protection Division – US Department of Transport) Webcast of the speech made by Ms. Laura Wright, CFO – Southwest Airlines on the18th of March, 2008 at the JP Morgan Aviation & Transportation Conference
THANK YOU