Download to read offline
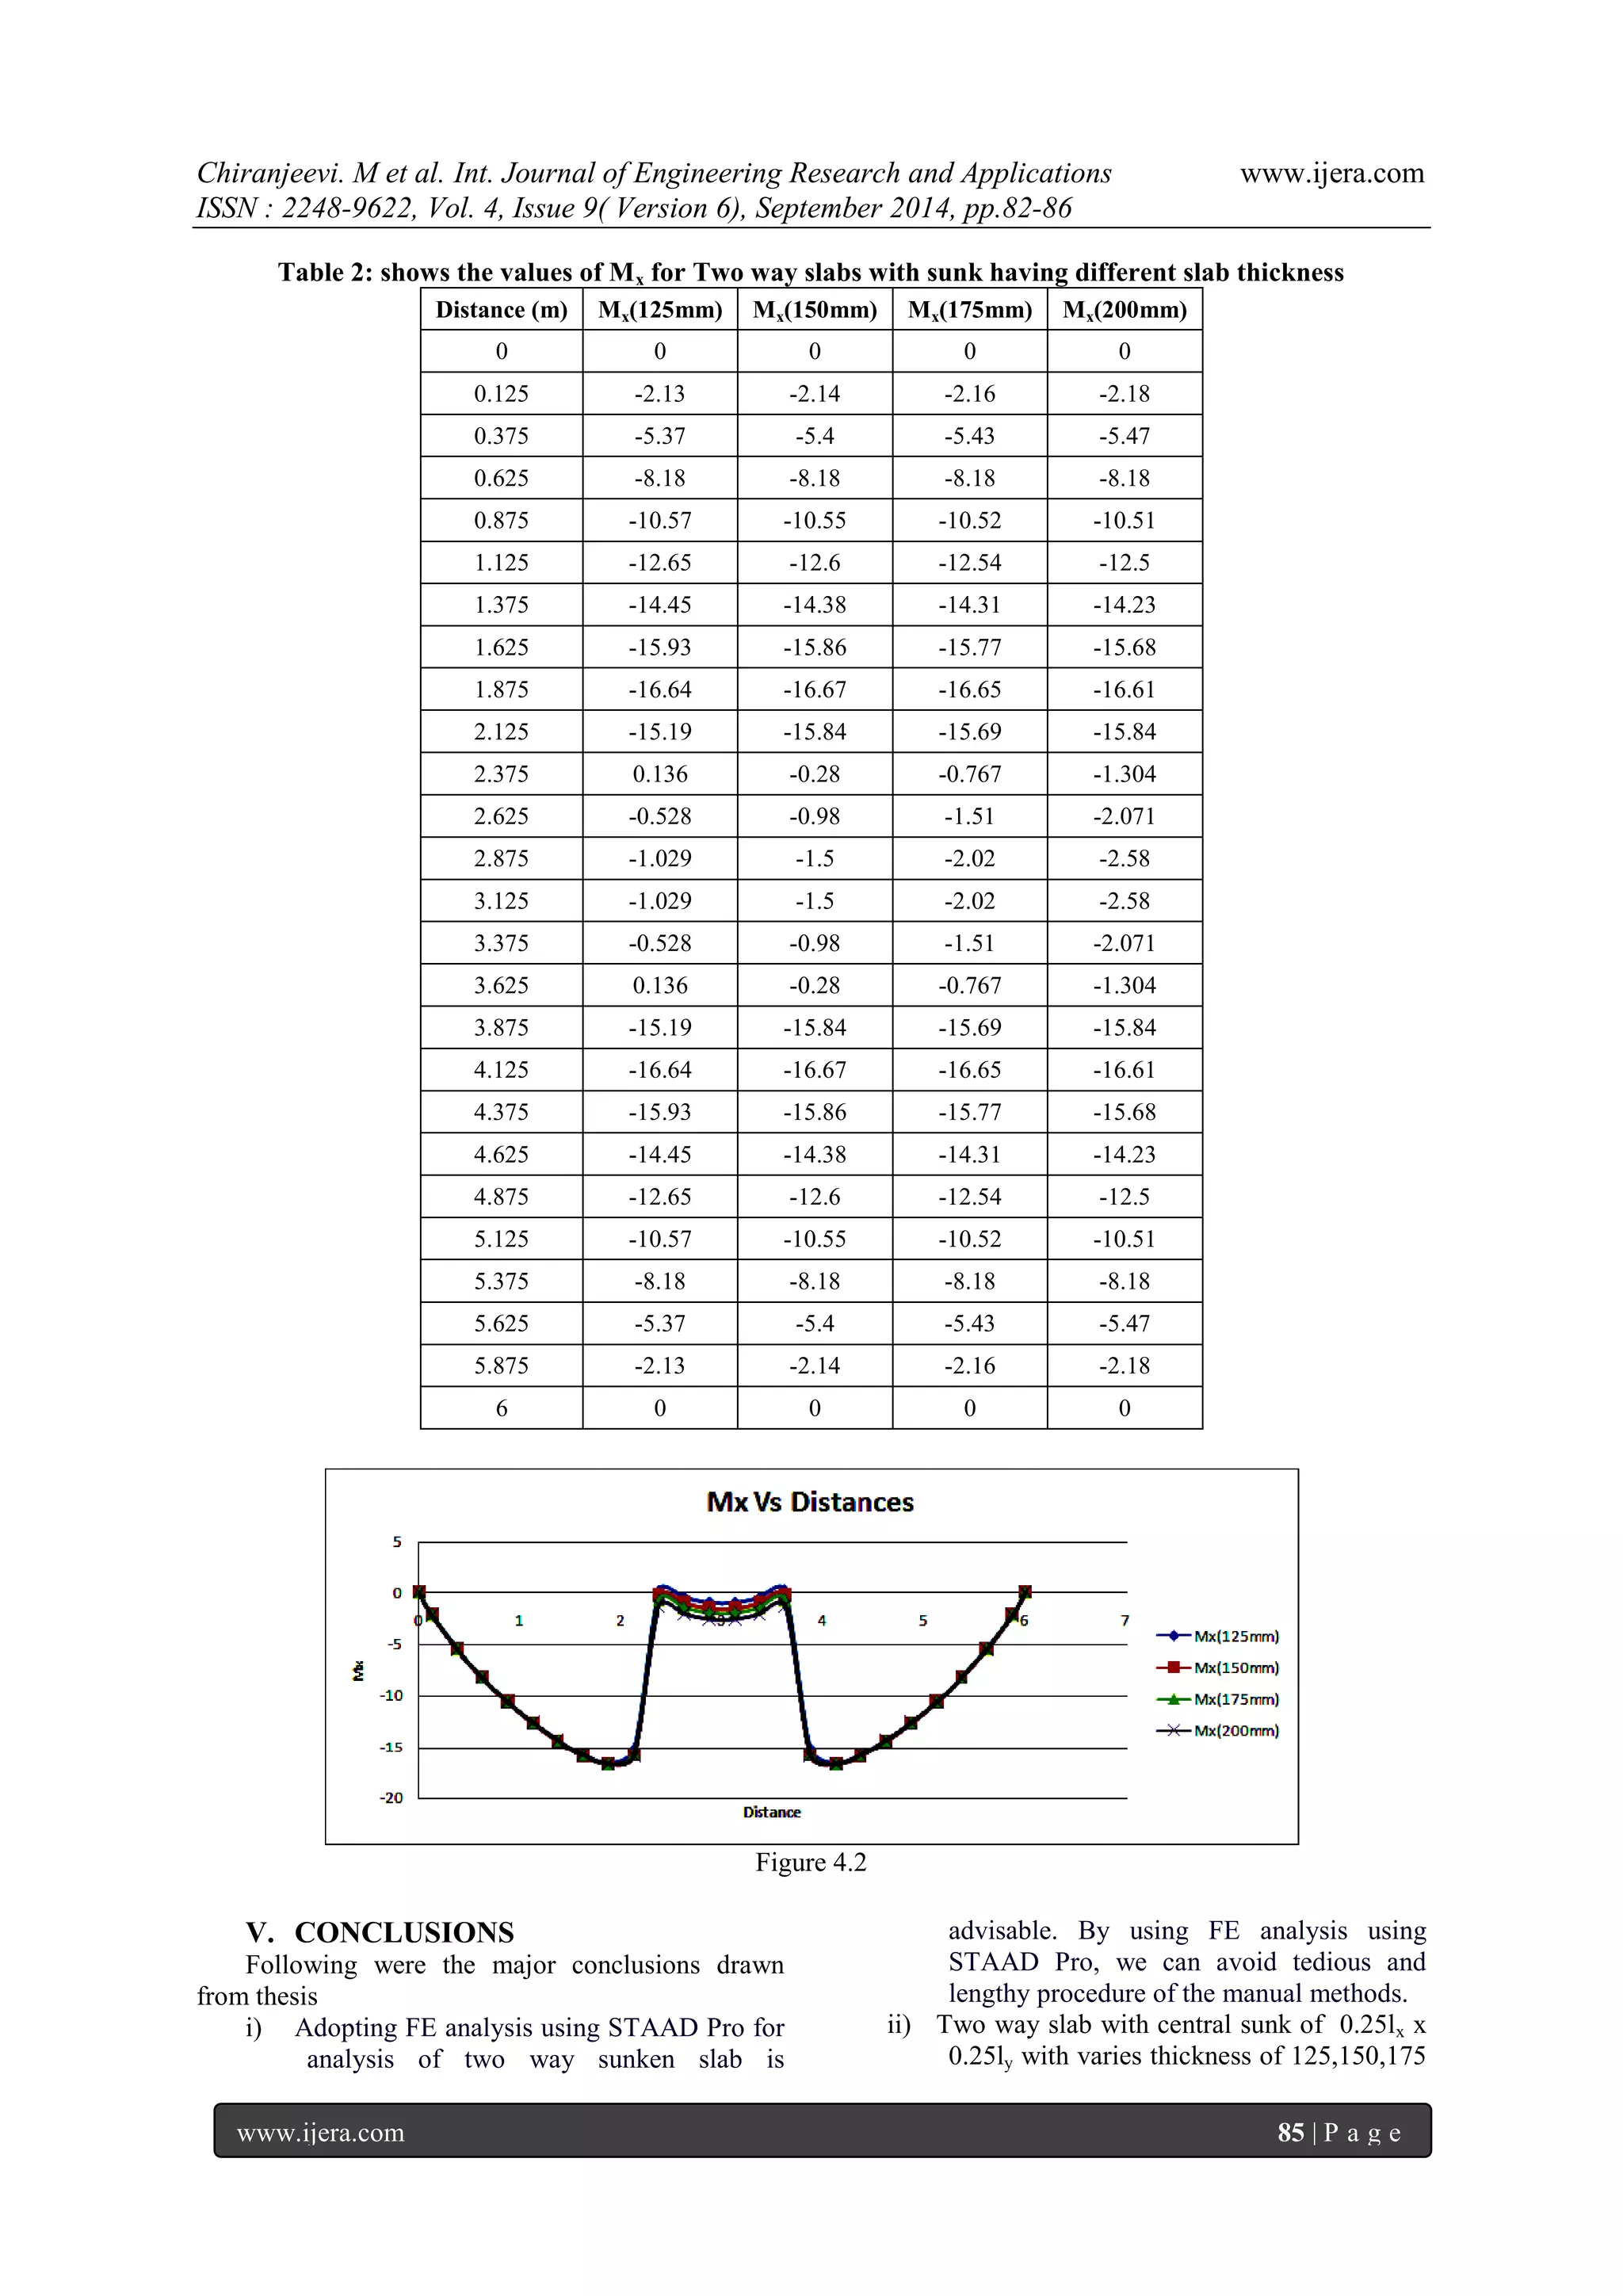
![Chiranjeevi. M et al. Int. Journal of Engineering Research and Applications www.ijera.com
ISSN : 2248-9622, Vol. 4, Issue 9( Version 6), September 2014, pp.82-86
www.ijera.com 86 | P a g e
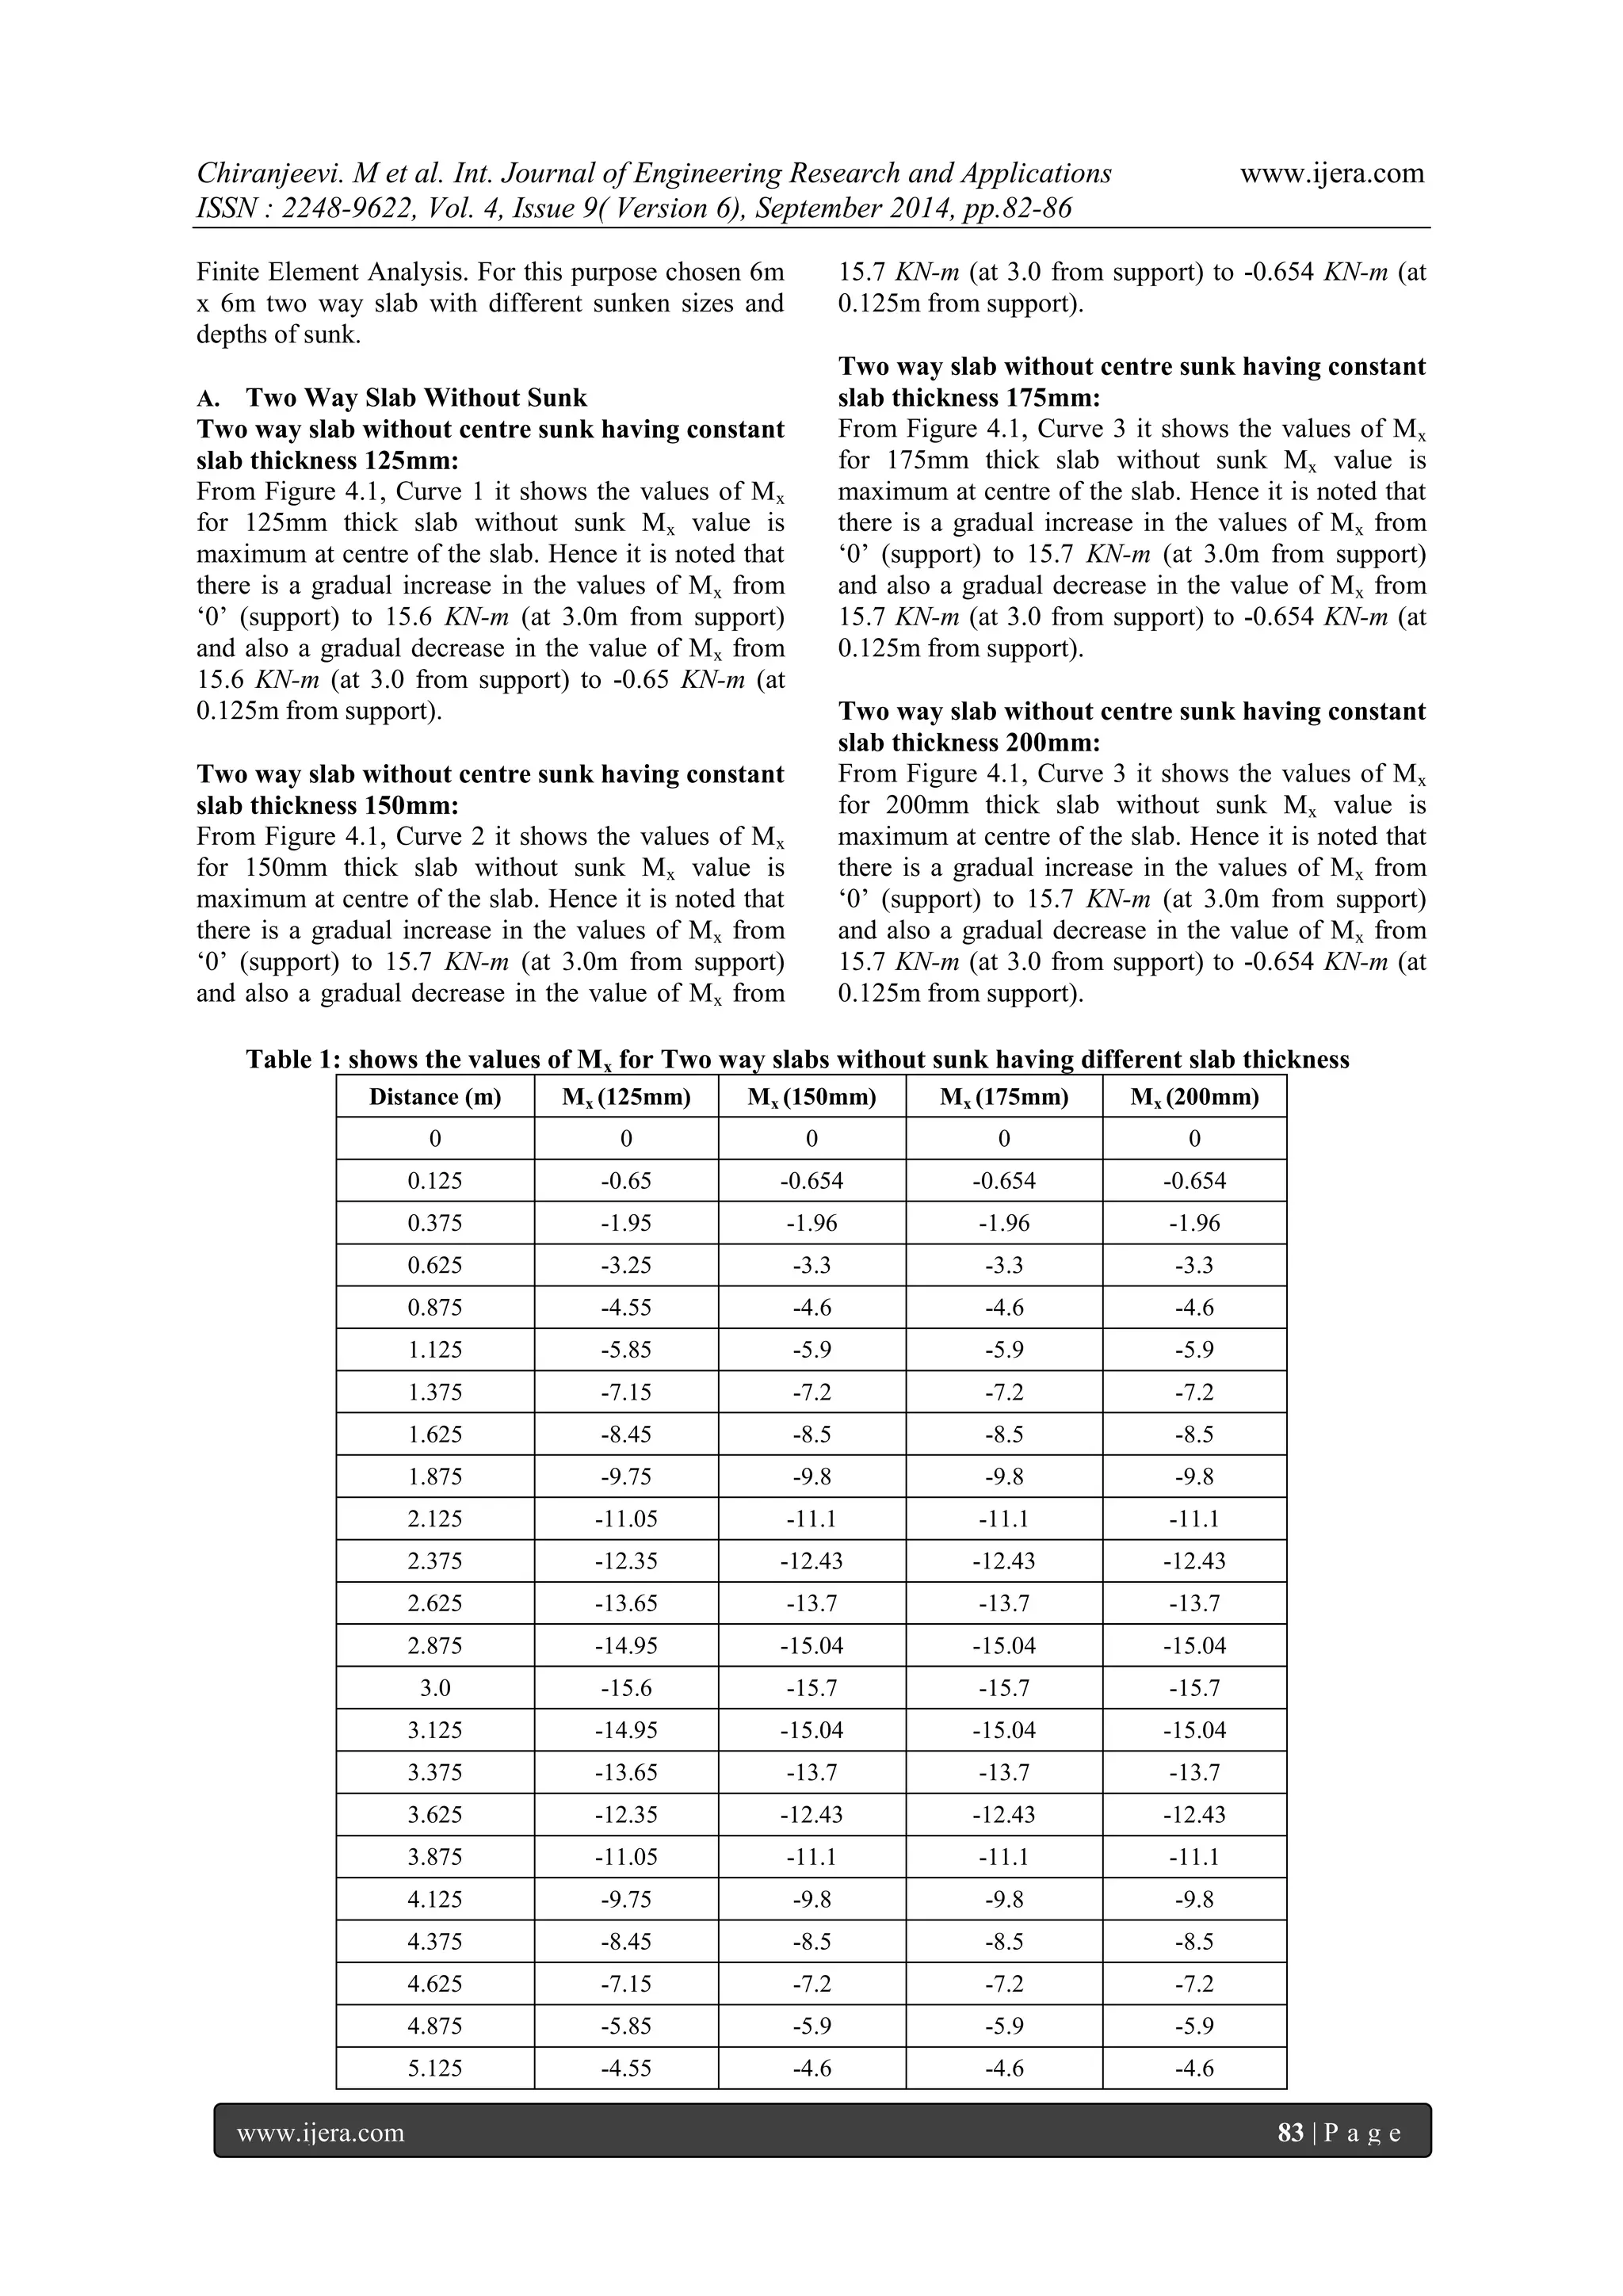
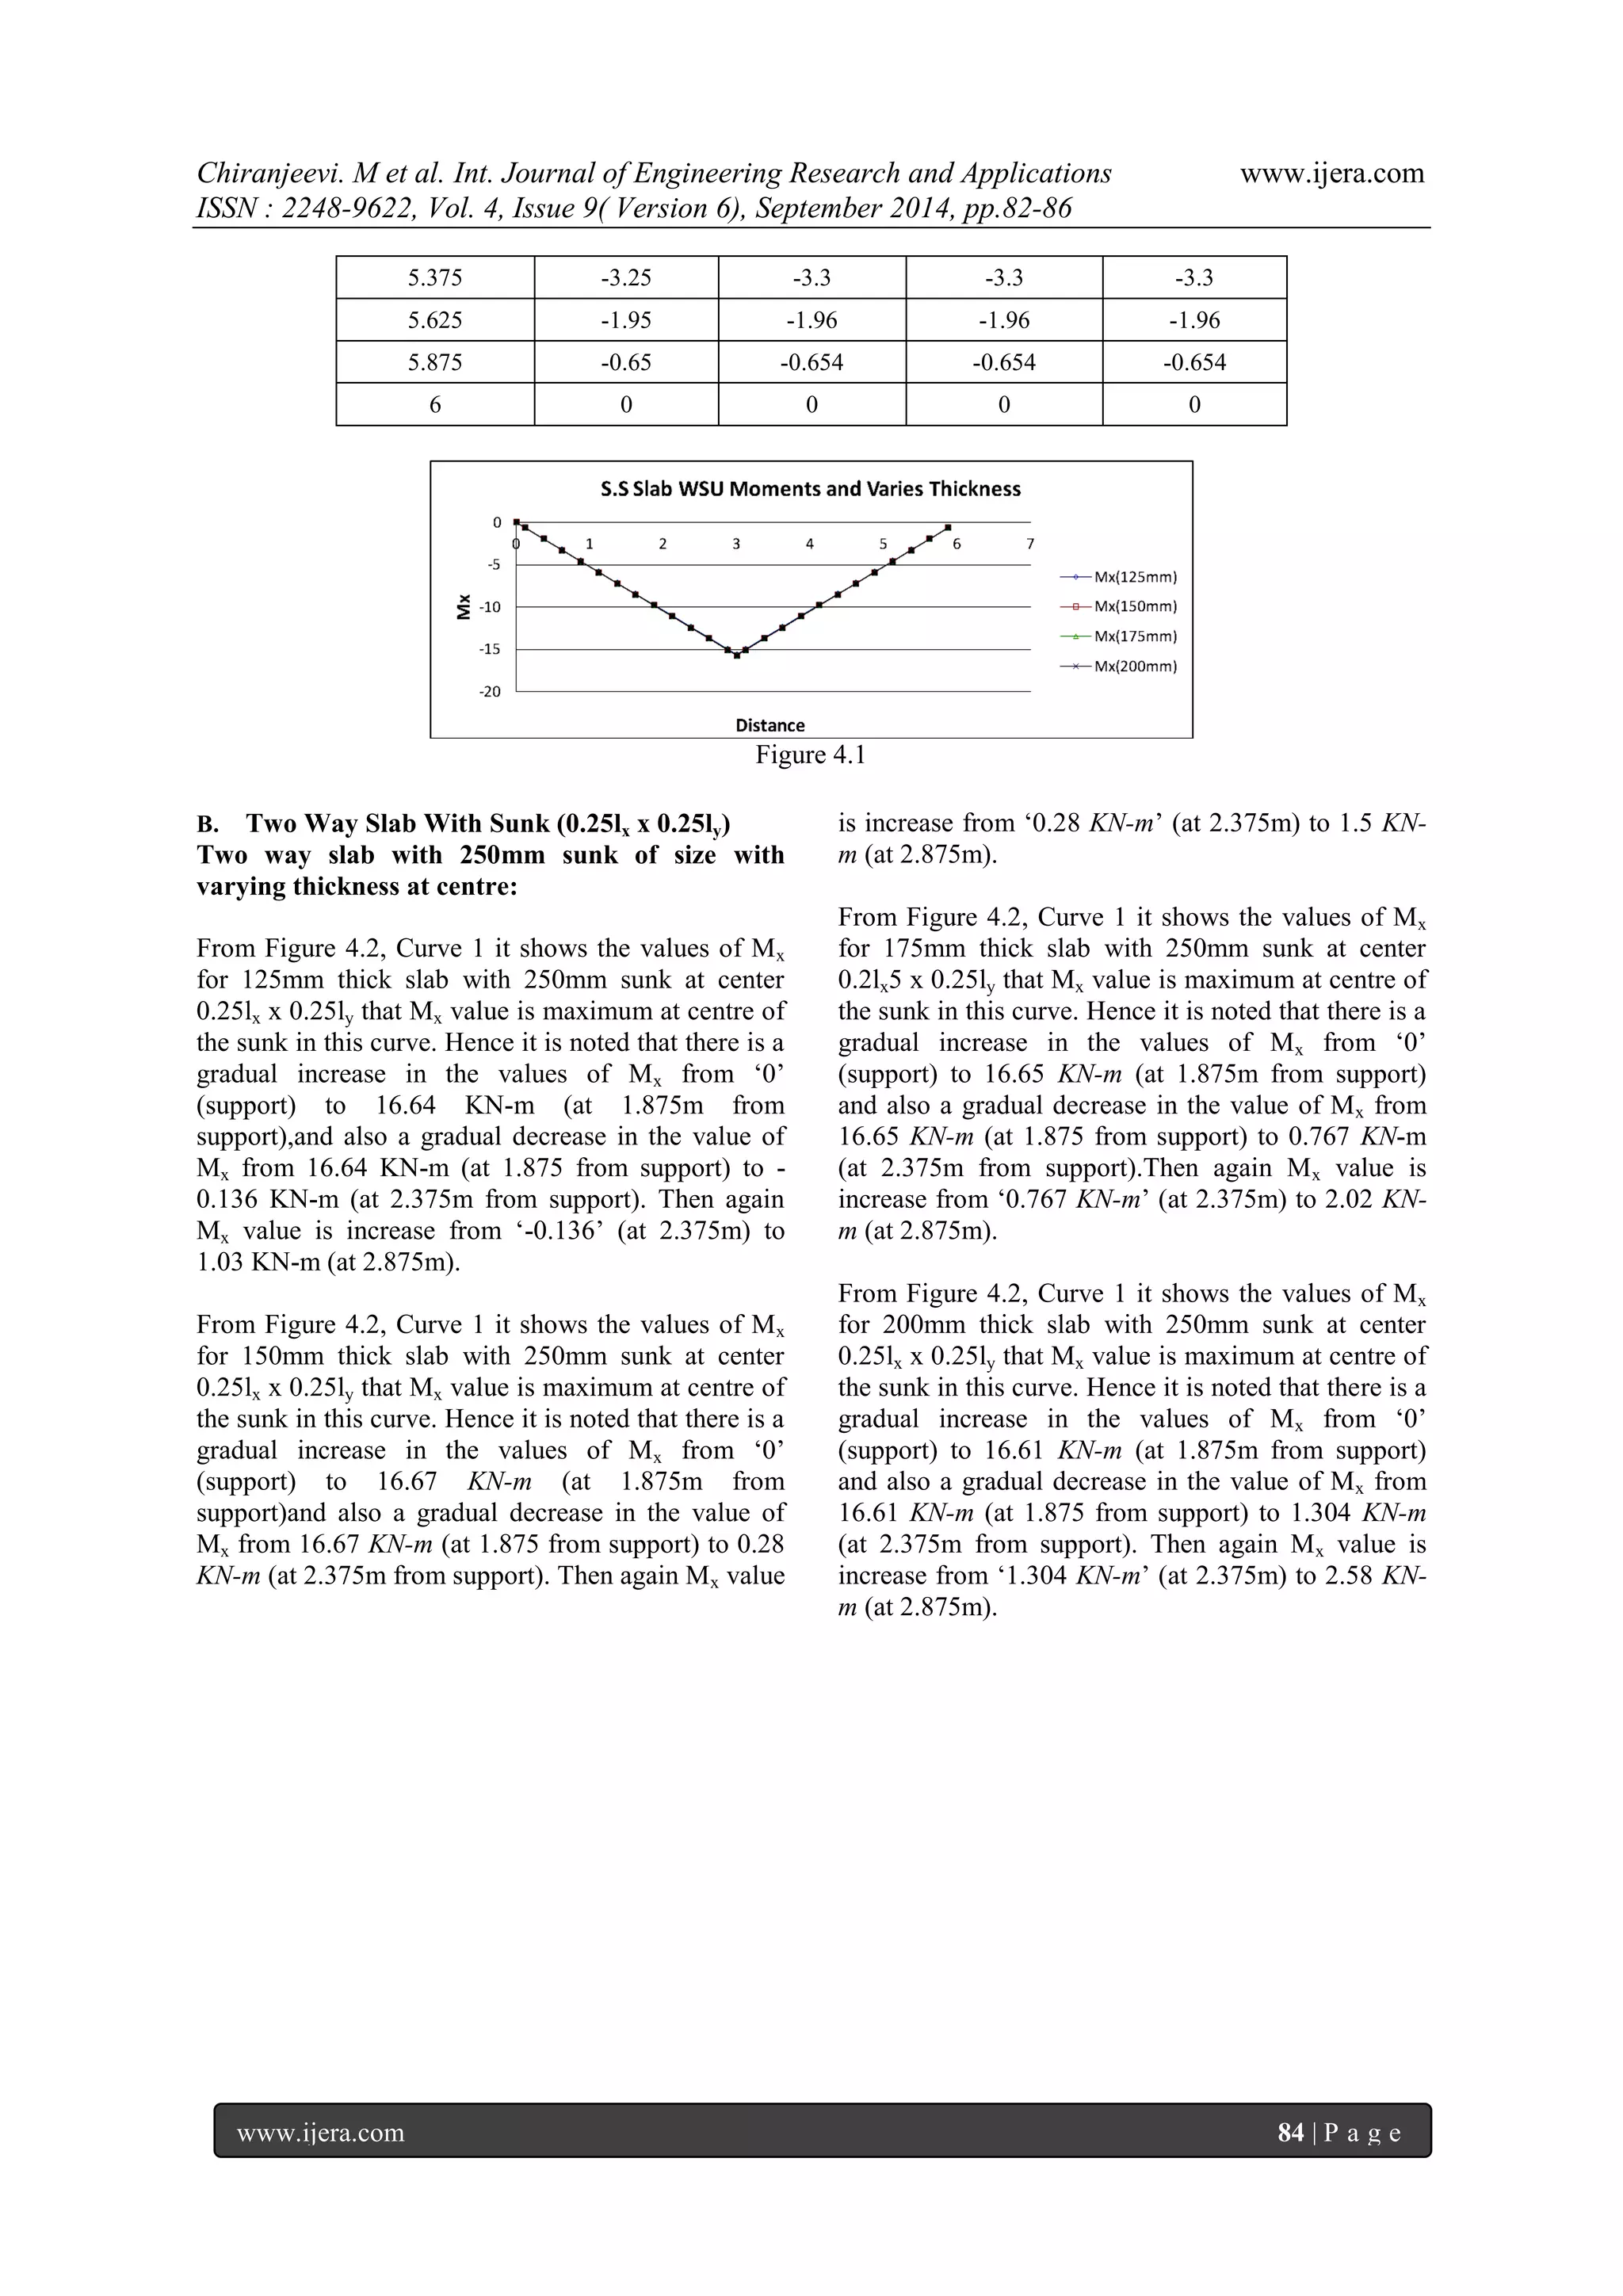
and 200mm,no considerable variations in the moments with respect to the sunk depth of 250mm. But there is a small increase in the values of moments with the increase in thickness of slab.
REFERENCES
[1]. A.M. Mont‟Alverne 2012 “Determination of the reinforced concrete slabs ultimate load using finite element method and mathematical programming” Latin American Journal of solids structures Vol.9, No.1, Rio de janeiro 2012.
[2]. K. M. A. Hossain 2005 “Design optimization of simply supported concrete slabs by finite element modeling” Struct. Multidisc Optim 30, 76–88(2005).
[3]. M. M. Smadi and K. A. Belakhdar 2007 “Development of Finite Element Code for Analysis of Reinforced Concrete Slabs” Jordan Journal of Civil engineering Vol.1, No.2, 2007.
[4]. Johansen K.W., 1962, “Yield-Line Theory “, Cement and Concrete Association, London,.pp 181.
[5]. Sudhakar, K.J., 1998, “Moment Coefficients for the design of Irregular slabs by yield line theory.” M.E, Thesis, Submitted to Andhra University, Andhra Pradesh, Visakhapatnam, India, pp.150.
[6]. Zaslavsky.Aron. Dec 1967, “Yield line analysis of rectangular slabs with central opening” ACI journal, No 64-74,.pp 838-844.
[7]. Rambabu,K. and Goli, H B. “Simplified approach to design orthogonal slabs using affine theorem” Journal of Structural Engineering, Chennai, India.](https://image.slidesharecdn.com/j49068286-141021040946-conversion-gate02/75/Analysis-of-Two-Way-Simply-Supported-Slabs-With-Central-Sunk-Using-Finite-Element-Method-5-2048.jpg)

This paper analyzes two-way simply supported slabs with central sunk using finite element analysis (FEA) to improve structural efficiency. Various slab thicknesses (125mm, 150mm, 175mm, and 200mm) and a sunk depth of 250mm were examined, revealing that using FEA can avoid manual calculation complexities. The study concludes that adopting FEA methods is beneficial for analyzing such slab designs, showing minor variations in moments with thicker slabs but overall showing decreased sagging moments compared to non-sunk slabs.