International Journal of Engineering and Science Invention (IJESI) is an international journal intended for professionals and researchers in all fields of computer science and electronics. IJESI publishes research articles and reviews within the whole field Engineering Science and Technology, new teaching methods, assessment, validation and the impact of new technologies and it will continue to provide information on the latest trends and developments in this ever-expanding subject. The publications of papers are selected through double peer reviewed to ensure originality, relevance, and readability. The articles published in our journal can be accessed online.
International Journal of Engineering and Science Invention (IJESI) is an international journal intended for professionals and researchers in all fields of computer science and electronics. IJESI publishes research articles and reviews within the whole field Engineering Science and Technology, new teaching methods, assessment, validation and the impact of new technologies and it will continue to provide information on the latest trends and developments in this ever-expanding subject. The publications of papers are selected through double peer reviewed to ensure originality, relevance, and readability. The articles published in our journal can be accessed online.
Calculation of solar radiation by using regression methodsmehmet şahin
Abstract. In this study, solar radiation was estimated at 53 location over Turkey with
varying climatic conditions using the Linear, Ridge, Lasso, Smoother, Partial least, KNN
and Gaussian process regression methods. The data of 2002 and 2003 years were used to
obtain regression coefficients of relevant methods. The coefficients were obtained based on
the input parameters. Input parameters were month, altitude, latitude, longitude and landsurface
temperature (LST).The values for LST were obtained from the data of the National
Oceanic and Atmospheric Administration Advanced Very High Resolution Radiometer
(NOAA-AVHRR) satellite. Solar radiation was calculated using obtained coefficients in
regression methods for 2004 year. The results were compared statistically. The most
successful method was Gaussian process regression method. The most unsuccessful method
was lasso regression method. While means bias error (MBE) value of Gaussian process
regression method was 0,274 MJ/m2, root mean square error (RMSE) value of method was
calculated as 2,260 MJ/m2. The correlation coefficient of related method was calculated as
0,941. Statistical results are consistent with the literature. Used the Gaussian process
regression method is recommended for other studies.
Flood Prediction Model using Artificial Neural NetworkEditor IJCATR
This paper presents a Flood Prediction Model (FPM) to predict flood in rivers using Artificial Neural Network (ANN)
approach. This model predicts river water level from rainfall and present river water level data. Though numbers of factors are
responsible for changes in water level, only two of them are considered. Flood prediction problem is a non-linear problem and to solve
this nonlinear problem, ANN approach is used. Multi Linear Perceptron (MLP) based ANN’s Feed Forward (FF) and Back
Propagation (BP) algorithm is used to predict flood. Statistical analysis shows that data fit well in the model. We present our
simulation results for the predicted water level compared to the actual water level. Results show that our model successfully predicts
the flood water level 24 hours ahead of time.
International Journal of Engineering Research and Applications (IJERA) is an open access online peer reviewed international journal that publishes research and review articles in the fields of Computer Science, Neural Networks, Electrical Engineering, Software Engineering, Information Technology, Mechanical Engineering, Chemical Engineering, Plastic Engineering, Food Technology, Textile Engineering, Nano Technology & science, Power Electronics, Electronics & Communication Engineering, Computational mathematics, Image processing, Civil Engineering, Structural Engineering, Environmental Engineering, VLSI Testing & Low Power VLSI Design etc.
A verification of periodogram technique for harmonic source diagnostic analyt...TELKOMNIKA JOURNAL
A harmonic source diagnostic analytic is vital to identify the root causes and type of harmonic source in power system. This paper introduces a verification of periodogram technique to diagnose harmonic sources by using logistic regression classifier. A periodogram gives a correct and accurate classification of harmonic signals. Signature recognition pattern is used to distinguish the harmonic sources accurately by obtaining the distribution of harmonic and interharmonic components and the harmonic contribution changes. This is achieved by using the significant signature recognition of harmonic producing load obtained from the harmonic contribution changes. To verify the performance of the propose method, a logistic regression classifier will analyse the result and give the accuracy and positive rate percentage of the propose method. The adequacy of the proposed methodology is tested and verified on distribution system for several rectifier and inverter-based loads.
Prospective anomaly detection methods such as the Modified EARS C2 are commonly adapted and used in public health syndromic surveillance systems. These methods however can produce an excessive false alert rate. We present a combined use of retrospective (e.g., Change Point Analysis (or CPA)) and prospective (e.g., C2) anomaly detection methods. This combined approach will help detect sudden aberrations in addition to subtle changes in local trends, help rule out alarm investigations, and assist with retrospective follow-ups. Examples on the utility of this combined approach in working collaboratively with the scientific community are applied to BioSense emergency departments' visits due to ILI. Methods, limitations, future work, and invitation to the scientific community to collaborate with us will be discussed at this talk.
Analysis of the Use of Universal Distribution Factors in SEC Power Gridresearchinventy
Distribution factors have been extensively used in many power system analysis and planning studies. In recent power system studies, the AC distribution factors are insensitive to the operating point and relatively sensitive at certain degree to changes in network topology. These factors are linear approximations of sensitivities of variables with various inputs. This paper presents the calculation of the universal distribution factors (UDF’s) applies them on several practical scenarios of Saudi Electricity Company (SEC) power grid. The results are analyzed and evaluated considering various system conditions of SEC load. The results show that the accuracy of the used approach is acceptable compared with exact method. This is practically beneficial to SEC in computing its grid complex power flows using UDF's at the base case without the need to recalculate UDF’s which save efforts and time.
Integration Method of Local-global SVR and Parallel Time Variant PSO in Water...TELKOMNIKA JOURNAL
Flood is one type of natural disaster that can’t be predicted, one of the main causes of flooding is the continuous rain (natural events). In terms of meteorology, the cause of flood is come from high rainfall and the high tide of the sea, resulting in increased the water level. Rainfall and water level analysis in each period, still not able to solve the existing problems. Therefore in this study, the proposed integration method of Parallel Time Variant PSO (PTVPSO) and Local-Global Support Vector Regression (SVR) is used to forecast water level. Implementation in this study combine SVR as regression method for forecast the water level, Local-Global concept take the role for the minimization for the computing time, while PTVPSO used in the SVR to obtain maximum performance and higher accurate result by optimize the parameters of SVR. Hopefully this system will be able to solve the existing problems for flood early warning system due to erratic weather.
Joint Cooperative Spectrum Sensing and MAC Protocol Design for Multi-channel ...Polytechnique Montreal
In this paper, we propose a semi-distributed cooperative spectrum sen
sing (SDCSS) and channel access framework
for multi-channel cognitive radio networks (CRNs). In particular, we c
onsider a SDCSS scheme where secondary
users (SUs) perform sensing and exchange sensing outcomes with ea
ch other to locate spectrum holes. In addition,
we devise the
p
-persistent CSMA-based cognitive MAC protocol integrating the SDCSS to
enable efficient spectrum
sharing among SUs. We then perform throughput analysis and develop
an algorithm to determine the spectrum
sensing and access parameters to maximize the throughput for a given
allocation of channel sensing sets. Moreover,
we consider the spectrum sensing set optimization problem for SUs to maxim
ize the overall system throughput. We
present both exhaustive search and low-complexity greedy algorithms
to determine the sensing sets for SUs and
analyze their complexity. We also show how our design and analysis can be
extended to consider reporting errors.
Finally, extensive numerical results are presented to demonstrate the sig
nificant performance gain of our optimized
design framework with respect to non-optimized designs as well as the imp
acts of different protocol parameters on
the throughput performance.
This paper develops a hybrid Measure-Correlate-Predict (MCP) strategy to predict the long term wind resource variations at a farm site. The hybrid MCP method uses the recorded data of multiple reference stations to estimate the long term wind condition at the target farm site. The weight of each reference station in the hybrid strategy is determined based on: (i) the distance and (ii) the elevation difference between the target farm site and each reference station. The applicability of the proposed hybrid strategy is investigated using four different MCP methods: (i) linear regression; (ii) variance ratio; (iii) Weibull scale; and (iv) Artificial Neural Networks (ANNs). To implement this method, we use the hourly averaged wind data recorded at six stations in North Dakota between the year 2008 and 2010. The station Pillsbury is selected as the target farm site. The recorded data at the other five stations
(Dazey, Galesbury, Hillsboro, Mayville and Prosper) is used as reference station data. Three sets of performance metrics are used to evaluate the hybrid MCP method. The first set of metrics analyze the statistical performance, including the mean wind speed, the wind speed variance, the root mean squared error, and the maximum absolute error. The second set of metrics evaluate the distribution of long term wind speed; to this end, the Weibull distribution and the Multivariate and Multimodal Wind Distribution (MMWD) models are adopted in this paper. The third set of metrics analyze the energy production capacity and the efficiency of the wind farm. The results illustrate that the many-to-one correlation in such a hybrid approach can provide more reliable prediction of the long term onsite wind variations, compared to one-to-one correlations.
Equity-Based free channels assignment for secondary users in a cognitive radi...IJECEIAES
The present paper addresses the equity issue among the secondary users in a cognitive radio network. After using a multi scheduler algorithm and a fairness metric namely Jain’s Equity Index; we enhance the equity between the secondary users’ transfer rates by 0.64 in average, relative to a previous work.
(Slides) UbiREMOTE: Framework for Remotely Controlling Networked Appliances t...Naoki Shibata
Kiyokawa, K., Yamamoto, S., Shibata, N., Yasumoto, K., Ito, M.: UbiREMOTE: Framework for Remotely Controlling Networked Appliances through Interaction with 3D Virtual Space, Proc. of ACM Multimedia Systems 2010 (MMSys2010), pp.271-280, DOI:10.1145/1730836.1730870 (Feb. 2010).
http://ito-lab.naist.jp/mediawiki/images/6/60/100223mmsys.pdf
In this paper, we propose a framework named “UbiREMOTE”for controlling information appliances connected to a home network with a unified and intuitive user interface from a remote place. The UbiREMOTE framework provides users with a way to control appliances in a home through a virtual space drawn on a mobile terminal screen which reflects the latest conditions of the real appliances and the rooms in the home. With UbiREMOTE, a user controls appliances by (1) moving to the front of an appliance, (2) choosing the appliance to control and (3) pushing buttons on the virtual remote controller which imitates the real remote controller for the appliance or the real console. In this paper, we propose a method to improve the drawing speed of 3D virtual space on mobile terminals and a method for automatically reflecting condition changes of the real space in the virtual space. We implemented the methods and evaluated the performance. The results showed that the proposed methods can be practically used on small mobile terminals.
The patent wars in the US Tech Industry are rampant. It's difficult to keep track of so many lawsuits and patent sales, but this infographic can clear things up.
International Journal of Engineering Research and Development (IJERD)IJERD Editor
call for paper 2012, hard copy of journal, research paper publishing, where to publish research paper,
journal publishing, how to publish research paper, Call For research paper, international journal, publishing a paper, IJERD, journal of science and technology, how to get a research paper published, publishing a paper, publishing of journal, publishing of research paper, reserach and review articles, IJERD Journal, How to publish your research paper, publish research paper, open access engineering journal, Engineering journal, Mathemetics journal, Physics journal, Chemistry journal, Computer Engineering, Computer Science journal, how to submit your paper, peer reviw journal, indexed journal, reserach and review articles, engineering journal, www.ijerd.com, research journals,
yahoo journals, bing journals, International Journal of Engineering Research and Development, google journals, hard copy of journal
This paper descriibes the performance of the Wavelet based Filtered Multitone(WFMT) modulation. The novel WFMT modulation was proposed in 2003 for improving characteristic of Wireless and DSL multicarrier systems.
ANN Modeling of Monthly and Weekly Behaviour of the Runoff of Kali River Catc...IOSR Journals
Model is a system, by whose operation; the characteristics of other similar systems can be ascertained. Experimental observation made on a model bear a definite relationship with prototype. So, the model analysis or modeling is actually an experimental method of finding solution of complex flow problems like surface water modeling, sub-surface water modeling etc. Many flow situations are not amenable to theoretical analysis. Modeling is a valuable means of obtaining better understanding of particular situation. Inspired by the functioning of the brain and biological nervous system, Artificial Neural Networks (ANNs) has been applied to various hydrological problems in last two decades. In this study, two ANN models using feed forward – back propagation network are developed to correlate a relationship between rainfall and runoff on monthly and weekly basis for Kali river catchment up to Supa dam in Uttara Kannada District of Karnataka State, India. The developed two models are compared and evaluated using standard statistical parameters to know strength and weaknesses. This performance can be further refined by incorporating more input parameters of catchment properties like soil moisture index; land use and land cover details etc.
Sewer systems are used to convey sewage and/or storm water to sewage treatment
plants for disposal by a network of buried sewer pipes, gutters, manholes and pits.
Unfortunately, the sewer pipe deteriorates with time leading to the collapsing of the
pipe with traffic disruption or clogging of the pipe causing flooding and
environmental pollution. Thus, the management and maintenance of the buried pipes
are important tasks that require information about the changes of the current and
future sewer pipes conditions. In this research, the study was carried on in Baghdad,
Iraq and two deteriorations model’s multinomial logistic regression and neural
network deterioration model NNDM are used to predict sewers future conditions. The
results of the deterioration models' application showed that NNDM gave the highest
overall prediction efficiency of 93.6% by adapting the confusion matrix test, while
multinomial logistic regression was inconsistent with the data. The error in prediction
of related model was due to its inability to reflect the dependent variable (condition
classes) ordered nature.
EFFICACY OF NEURAL NETWORK IN RAINFALL-RUNOFF MODELLING OF BAGMATI RIVER BASINIAEME Publication
In this paper, rainfall-runoff model of Bagmati river basin has been developed
using the ANN Technique. Three-layered fced forward network structure with back
propagation algorithm was used to train the ANN model. Different combinations of
rainfall and runoff were considered as input to the network and trained by BP
algorithm with different error tolerance, learning parameter, number of cycles and
number of hidden layers. The sensitivity of the prediction accuracy to the number of
hidden layer neurons in a back error propagation algorithm was used for the study.
The monthly rainfall and runoff data from 2000 to 2009 of Bagmati river basin has
been considered for the development of ANN model. Performance evaluation of the
model has been done by using statistical parameters. Three sets of data have been
used to make several combination of year keeping in view the highest peaks of
hydrographs. First set of data used was from 2000 to 2006 for the calibration and
from 2007 to 2009 for validation. The second set of data was from 2004 to 2009 for
calibration and from 2000 to 2003 for validation. The Third set of data was from 2000
to 2009 for calibration and from 2007 to 2009 for validation. It was found that the
third set of data gave better result than other two sets of data. The study demonstrates
the applicability of ANN approach in developing effective non-linear models of
Rainfall-Runoff process without the need to explicitly representing the internal
hydraulic structure of the watershed
RAINFALL PREDICTION USING DATA MINING TECHNIQUES - A SURVEYcsandit
Rainfall is considered as one of the major components of the hydrological process; it takes
significant part in evaluating drought and flooding events. Therefore, it is important to have an
accurate model for rainfall prediction. Recently, several data-driven modeling approaches have
been investigated to perform such forecasting tasks as multilayer perceptron neural networks
(MLP-NN). In fact, the rainfall time series modeling (SARIMA) involvesimportant temporal
dimensions. In order to evaluate the incomes of both models, statistical parameters were used to
make the comparison between the two models. These parameters include the Root Mean Square
Error RMSE, Mean Absolute Error MAE, Coefficient Of Correlation CC and BIAS. Two-Third
of the data was used for training the model and One-third for testing.
RAINFALL PREDICTION USING DATA MINING TECHNIQUES - A SURVEYcscpconf
Rainfall is considered as one of the major components of the hydrological process; it takes significant part in evaluating drought and flooding events. Therefore, it is important to have anaccurate model for rainfall prediction. Recently, several data-driven modeling approaches havebeen investigated to perform such forecasting tasks as multilayer perceptron neural networks
(MLP-NN). In fact, the rainfall time series modeling (SARIMA) involvesimportant temporal dimensions. In order to evaluate the incomes of both models, statistical parameters were used to
make the comparison between the two models. These parameters include the Root Mean Square Error RMSE, Mean Absolute Error MAE, Coefficient Of Correlation CC and BIAS. Two-Third of the data was used for training the model and One-third for testing.
WATERSHED MODELING USING ARTIFICIAL NEURAL NETWORKS IAEME Publication
Artificial Neural Networks analysis was used for modeling rainfall-runoff relationship. A new Instantaneous ANN watershed model was built and tried herein using Walnut Gulch watershed (catchment) area. For modeling the instantaneous response of a catchment to a rainfall event an ANN model was built shown herein. The built model can represent the actual response using descritized
rainfall-runoff values, over a selected time interval (∆t). As this time interval decreases the actual response is more accurately modeled. This model was applied to one of the sub-catchment of Walnut Gulch watershed (sub-catchment No.9 (flume 11)). The model was found successful to represent the lag-time and time of runoff related to the hyetograph properties
Applications of Artificial Neural Networks in Civil EngineeringPramey Zode
An artificial brain-like network based on certain mathematical algorithms developed using a numerical computing environment is called as an ‘Artificial Neural Network (ANN)’. Many civil engineering problems which need understanding of physical processes are found to be time consuming and inaccurate to evaluate using conventional approaches. In this regard, many ANNs have been seen as a reliable and practical alternative to solve such problems. Literature review reveals that ANNs have already being used in solving numerous civil engineering problems. This study explains some cases where ANNs have been used and its future scope is also discussed.
Urban strategies to promote resilient cities The case of enhancing Historic C...inventionjournals
This research tackles disaster prevention problems in dense urban areas, concentrating on the urban fire challenge in Historic Cairo district, Egypt, through disaster risk management approach. The study area suffers from the strike of several urban fire outbreaks, that resulted in disfiguring historic monuments and destroying unregulated traditional markets. Therefore, the study investigates the significance of hazard management and how can urban strategies improve the city resilient through reducing the impact of natural and man-made threats. The main findings of the research are the determination of the vulnerability factors in Historic Cairo district, either regarding management deficiency or issues related to the existing urban form. It is found that the absence of the mitigation and preparedness phases is the main problem in the risk management cycle in the case study. Additionally, the coping initiatives adopted by local authorities to address risks are random and insufficient. The study concludes with recommendations which invoke incorporating hazard management stages (pre disaster, during disaster and post disaster) into the process of evolving development planning. Finally, solutions are offered to mitigate, prepare, respond and recover from fire disasters in the case study. The solutions include urban policies, land-use planning, urban design outlines, safety regulation and public awareness and training.
Multi-task learning using non-linear autoregressive models and recurrent neur...IJECEIAES
Tide level forecasting plays an important role in environmental management and development. Current tide level forecasting methods are usually implemented for solving single task problems, that is, a model built based on the tide level data at an individual location is only used to forecast tide level of the same location but is not used for tide forecasting at another location. This study proposes a new method for tide level prediction at multiple locations simultaneously. The method combines nonlinear autoregressive moving average with exogenous inputs (NARMAX) model and recurrent neural networks (RNNs), and incorporates them into a multi-task learning (MTL) framework. Experiments are designed and performed to compare single task learning (STL) and MTL with and without using non-linear autoregressive models. Three different RNN variants, namely, long short- term memory (LSTM), gated recurrent unit (GRU) and bidirectional LSTM (BiLSTM) are employed together with non-linear autoregressive models. A case study on tide level forecasting at many different geographical locations (5 to 11 locations) is conducted. Experimental results demonstrate that the proposed architectures outperform the classical single-task prediction methods.
Forecasting Electric Energy Demand using a predictor model based on Liquid St...Waqas Tariq
Electricity demand forecasts are required by companies who need to predict their customers’ demand, and by those wishing to trade electricity as a commodity on financial markets. It is hard to find the right prediction method for a given application if not a prediction expert. Recent works show that Liquid State Machines (LSM’s) can be applied to the prediction of time series. The main advantage of the LSM is that it projects the input data in a high-dimensional dynamical space and therefore simple learning methods can be used to train the readout. In this paper we present an experimental investigation of an approach for the computation of time series prediction by employing Liquid State Machines (LSM) in the modeling of a predictor in a case study for short-term and long-term electricity demand forecasting. Results of this investigation are promising, considering the error to stop training the readout, the number of iterations of training of the readout and that no strategy of seasonal adjustment or preprocessing of data was achieved to extract non-correlated data out of the time series.
Reliability analysis of pmu using hidden markov modelamaresh1234
As modern electric power systems are transforming into smart grids, real time wide area monitoring system (WAMS) has become an essential tool for operation and control. With the increasing applications of WAMS for on-line stability analysis and control in smart grids, phasor measurement unit (PMU) is becoming a key element in wide area measurement system and the consequence of the failure of PMU is very severe and may cause a black out. Therefore reliable operation of PMU is very much essential for smooth functioning of the power system. This thesis is focused mainly on evaluating the reliability of PMU using hidden Markov model. Firstly, the probability of given observation sequence is obtained for the individual modules and PMU as a whole using forward and backward algorithm. Secondly, the optimal state sequence each module passes through is found. Thirdly, the parameters of the hidden Markov model are re-estimated using Baum-Welch algorithm.
DevOps and Testing slides at DASA ConnectKari Kakkonen
My and Rik Marselis slides at 30.5.2024 DASA Connect conference. We discuss about what is testing, then what is agile testing and finally what is Testing in DevOps. Finally we had lovely workshop with the participants trying to find out different ways to think about quality and testing in different parts of the DevOps infinity loop.
Essentials of Automations: Optimizing FME Workflows with ParametersSafe Software
Are you looking to streamline your workflows and boost your projects’ efficiency? Do you find yourself searching for ways to add flexibility and control over your FME workflows? If so, you’re in the right place.
Join us for an insightful dive into the world of FME parameters, a critical element in optimizing workflow efficiency. This webinar marks the beginning of our three-part “Essentials of Automation” series. This first webinar is designed to equip you with the knowledge and skills to utilize parameters effectively: enhancing the flexibility, maintainability, and user control of your FME projects.
Here’s what you’ll gain:
- Essentials of FME Parameters: Understand the pivotal role of parameters, including Reader/Writer, Transformer, User, and FME Flow categories. Discover how they are the key to unlocking automation and optimization within your workflows.
- Practical Applications in FME Form: Delve into key user parameter types including choice, connections, and file URLs. Allow users to control how a workflow runs, making your workflows more reusable. Learn to import values and deliver the best user experience for your workflows while enhancing accuracy.
- Optimization Strategies in FME Flow: Explore the creation and strategic deployment of parameters in FME Flow, including the use of deployment and geometry parameters, to maximize workflow efficiency.
- Pro Tips for Success: Gain insights on parameterizing connections and leveraging new features like Conditional Visibility for clarity and simplicity.
We’ll wrap up with a glimpse into future webinars, followed by a Q&A session to address your specific questions surrounding this topic.
Don’t miss this opportunity to elevate your FME expertise and drive your projects to new heights of efficiency.
Connector Corner: Automate dynamic content and events by pushing a buttonDianaGray10
Here is something new! In our next Connector Corner webinar, we will demonstrate how you can use a single workflow to:
Create a campaign using Mailchimp with merge tags/fields
Send an interactive Slack channel message (using buttons)
Have the message received by managers and peers along with a test email for review
But there’s more:
In a second workflow supporting the same use case, you’ll see:
Your campaign sent to target colleagues for approval
If the “Approve” button is clicked, a Jira/Zendesk ticket is created for the marketing design team
But—if the “Reject” button is pushed, colleagues will be alerted via Slack message
Join us to learn more about this new, human-in-the-loop capability, brought to you by Integration Service connectors.
And...
Speakers:
Akshay Agnihotri, Product Manager
Charlie Greenberg, Host
JMeter webinar - integration with InfluxDB and GrafanaRTTS
Watch this recorded webinar about real-time monitoring of application performance. See how to integrate Apache JMeter, the open-source leader in performance testing, with InfluxDB, the open-source time-series database, and Grafana, the open-source analytics and visualization application.
In this webinar, we will review the benefits of leveraging InfluxDB and Grafana when executing load tests and demonstrate how these tools are used to visualize performance metrics.
Length: 30 minutes
Session Overview
-------------------------------------------
During this webinar, we will cover the following topics while demonstrating the integrations of JMeter, InfluxDB and Grafana:
- What out-of-the-box solutions are available for real-time monitoring JMeter tests?
- What are the benefits of integrating InfluxDB and Grafana into the load testing stack?
- Which features are provided by Grafana?
- Demonstration of InfluxDB and Grafana using a practice web application
To view the webinar recording, go to:
https://www.rttsweb.com/jmeter-integration-webinar
Slack (or Teams) Automation for Bonterra Impact Management (fka Social Soluti...Jeffrey Haguewood
Sidekick Solutions uses Bonterra Impact Management (fka Social Solutions Apricot) and automation solutions to integrate data for business workflows.
We believe integration and automation are essential to user experience and the promise of efficient work through technology. Automation is the critical ingredient to realizing that full vision. We develop integration products and services for Bonterra Case Management software to support the deployment of automations for a variety of use cases.
This video focuses on the notifications, alerts, and approval requests using Slack for Bonterra Impact Management. The solutions covered in this webinar can also be deployed for Microsoft Teams.
Interested in deploying notification automations for Bonterra Impact Management? Contact us at sales@sidekicksolutionsllc.com to discuss next steps.
Neuro-symbolic is not enough, we need neuro-*semantic*Frank van Harmelen
Neuro-symbolic (NeSy) AI is on the rise. However, simply machine learning on just any symbolic structure is not sufficient to really harvest the gains of NeSy. These will only be gained when the symbolic structures have an actual semantics. I give an operational definition of semantics as “predictable inference”.
All of this illustrated with link prediction over knowledge graphs, but the argument is general.
Generating a custom Ruby SDK for your web service or Rails API using Smithyg2nightmarescribd
Have you ever wanted a Ruby client API to communicate with your web service? Smithy is a protocol-agnostic language for defining services and SDKs. Smithy Ruby is an implementation of Smithy that generates a Ruby SDK using a Smithy model. In this talk, we will explore Smithy and Smithy Ruby to learn how to generate custom feature-rich SDKs that can communicate with any web service, such as a Rails JSON API.
The Art of the Pitch: WordPress Relationships and SalesLaura Byrne
Clients don’t know what they don’t know. What web solutions are right for them? How does WordPress come into the picture? How do you make sure you understand scope and timeline? What do you do if sometime changes?
All these questions and more will be explored as we talk about matching clients’ needs with what your agency offers without pulling teeth or pulling your hair out. Practical tips, and strategies for successful relationship building that leads to closing the deal.
Key Trends Shaping the Future of Infrastructure.pdfCheryl Hung
Keynote at DIGIT West Expo, Glasgow on 29 May 2024.
Cheryl Hung, ochery.com
Sr Director, Infrastructure Ecosystem, Arm.
The key trends across hardware, cloud and open-source; exploring how these areas are likely to mature and develop over the short and long-term, and then considering how organisations can position themselves to adapt and thrive.
Dev Dives: Train smarter, not harder – active learning and UiPath LLMs for do...UiPathCommunity
💥 Speed, accuracy, and scaling – discover the superpowers of GenAI in action with UiPath Document Understanding and Communications Mining™:
See how to accelerate model training and optimize model performance with active learning
Learn about the latest enhancements to out-of-the-box document processing – with little to no training required
Get an exclusive demo of the new family of UiPath LLMs – GenAI models specialized for processing different types of documents and messages
This is a hands-on session specifically designed for automation developers and AI enthusiasts seeking to enhance their knowledge in leveraging the latest intelligent document processing capabilities offered by UiPath.
Speakers:
👨🏫 Andras Palfi, Senior Product Manager, UiPath
👩🏫 Lenka Dulovicova, Product Program Manager, UiPath
Securing your Kubernetes cluster_ a step-by-step guide to success !KatiaHIMEUR1
Today, after several years of existence, an extremely active community and an ultra-dynamic ecosystem, Kubernetes has established itself as the de facto standard in container orchestration. Thanks to a wide range of managed services, it has never been so easy to set up a ready-to-use Kubernetes cluster.
However, this ease of use means that the subject of security in Kubernetes is often left for later, or even neglected. This exposes companies to significant risks.
In this talk, I'll show you step-by-step how to secure your Kubernetes cluster for greater peace of mind and reliability.
Transcript: Selling digital books in 2024: Insights from industry leaders - T...BookNet Canada
The publishing industry has been selling digital audiobooks and ebooks for over a decade and has found its groove. What’s changed? What has stayed the same? Where do we go from here? Join a group of leading sales peers from across the industry for a conversation about the lessons learned since the popularization of digital books, best practices, digital book supply chain management, and more.
Link to video recording: https://bnctechforum.ca/sessions/selling-digital-books-in-2024-insights-from-industry-leaders/
Presented by BookNet Canada on May 28, 2024, with support from the Department of Canadian Heritage.
Unsubscribed: Combat Subscription Fatigue With a Membership Mentality by Head...
J0342054059
1. International Journal of Engineering Science Invention
ISSN (Online): 2319 – 6734, ISSN (Print): 2319 – 6726
www.ijesi.org Volume 3 Issue 4 ǁ April 2014ǁ PP.54-59
www.ijesi.org 54 | Page
The Artificial Neural Network and Time Series Models
Assessment (ARMA) In River Flow Simulation (Case Study:
Jamash River)
Mehrdad Fereydooni 1
, Mojtaba Khalilizadeh 2
, Mohsen Tabasi3
1
(Asistant Professor,Department of Civil Eng.Larestan Branch Islamic Azad University, Larestan, Iran.
Corresponding author, m.fereydooni@yahoo.com.)
2
(Asistant Professor,Department of Civil Eng.Larestan Branch Islamic Azad University, Larestan, Iran.)
3
(M.sc.candidate, Larestan Branch Islamic Azad University, Larestan, Iran.)
ABSTRACT: One of the basic tools of water resources management is to predict the water demand and
supply. Predicting suitable river flows in civil tasks, rivers rearrangement, fluid warning systems, and
particularly, planning to achieve optimal utilization from the reservoirs of the dams, is likely a vital issue. Lots
of different methods have been developed in order to predict river flows over the recent years. In current study,
the water flow of JamashRiver has been simulated in two stations with Neural Network and Time Series Models
(ARMA) with different structures,and finallythe neural network MLP-GDX is considered as the most suitable
model, in accordance with statistical indexes R2=95/89 and RMSE= 4/99 percent.
I. INTRODUCTION
One of the basic tools in water resources management is to predict the water demand and
supply.Predicting suitable river flows in civil tasks, rivers rearrangement, fluid warning systems, and
particularly, planning to achieve optimal utilization from the reservoirs of the dams, is likely a vital issue. Lots
of different methods have been developed in order to predict river flows over the recent years that can be
classified into two models: a conceptual model and a “based on the statistical data” model.Considering the
conceptual models’ requirement to accurate and complete data and knowledge about the physical alternatives
which can affect the river flow in a particular place, and this has been impossible so far, researchers appealed to
use statistical models. During the recent four decades, Time series models have been widely used as a statistical
model in predicting the river flows. It has been observed that the artificial-intelligencemethods have been
broadly utilized in recent years such as the artificial neural networks as well as the Time series methods in the
fieldsin which the relationship between the input and output isnon-linear. These artificial-intelligence methods
act like a proper flight recorder which is less restricted by physical matters and can model the non-linear and
non-static processes of the river flow with no need to model the environmental and geometrical factors which
are effective on the river flow.In this study the monthly flow of Jamash River is predicted in two stations of
Sikhouran and Sarkhain a monthly scale by means of artificial neural networks and Time seriesmethods and
their functions are compared with each other. Water-controlling structures such as dams, flood walls, …play an
efficient role in reducing or eliminating the damages made by flood. However, in a lot of cases, the
topographical or economic factors make it impractical to control the flood. Therefore, predicting the river flow
provides alternative tools to reduce the damages of the flood. Warning prior to a progressive flood, allows
evacuating people, domestic animals and machinery. Considering appropriate results gained from the models,
their utilization in these fields is adequately acceptable. Some researches performed on the river water flow by
means of Artificial Neural Networks and Time series are: Marcos (1995), Hall & Mainz (1998), Dahn (1998),
Madsen (2000), Kishi&Kebanz (2009), John Adamofski et al (2010), Rahnama (2003), Dastourani& Wright
(2004), Rezaei et al. (2007), Barani (2002), Sartaj et al. (2009), KarimiMasouleh et al (2010).
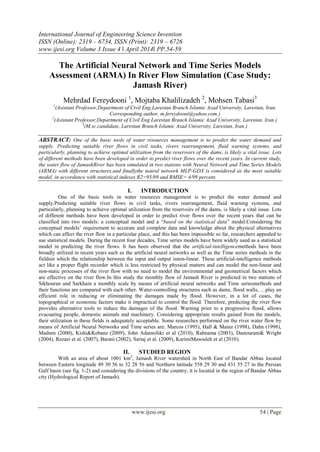
II. STUDIED REGION
With an area of about 1001 km2
, Jamash River watershed in North East of Bandar Abbas located
between Eastern longitude 49 30 56 to 32 28 56 and Northern latitude 558 29 30 and 431 55 27 in the Persian
Gulf basin (see fig. 1-2) and considering the divisions of the country, it is located in the region of Bandar Abbas
city (Hydrological Report of Jamash).
2. The Artificial Neural Network And Time…
www.ijesi.org 55 | Page
Figure (1): the location of Jamash River watershed
III. UTILIZED NETWORKS AND ALGORITHMS:
Based on how the nodes connection in the architecture of the neural networks, they are divided into the
following types:
3-1- Progressive Networks
In a progressive network, the nodes are located in consecutive layers and their relationship is unilateral
and when an input pattern is applied to the network, the first layer calculates its output values and delivers it to
the next layer. The next layer receives these values as the input and transfers its output to the next one. Each
node transfers the signal to the nodes of the next layer.
Where,
netjis the net input to the motor function,
wij is the matrix of the network weights
xj is the input vector of the network
andw0 is the bias vector of the network
3-2- Reverse Networks
They are the networks with at least one reverse flow from the output; that is, the layer received in this
kind of network is affected not only by connecting to the input layer, but also bythe output vector. This network
uses the output data as the new improved weights, therefore, allows the weights to return to the input. Figure (3-
3) shows the subsets of these two networks each of which is used for certain purposes.
Various Training Algorithms:
All implemented stages were performed in a network using different mathematical algorithms.
4-1- Luneburg – Marquardt Algorithm
This is the modified Newton’s classical algorithm which is used to find a suitable solution for the
problems with minimization requirement. This method, like Newton’s method, considers an approximation to
Hazen’s matrix of weights variations:
Where,
X is the neural network weights,
K is the number of rehearsals,
T indicates the transposed matrix,
J is Jacobin’s standard matrix of the network performance which should be minimized,
μ is the number which controls the training process,
ande is the residual error vector.
eJIJXX
TT
kk
1
1
3. The Artificial Neural Network And Time…
www.ijesi.org 56 | Page
4-2- Momentum Back-error Propagation Descent Gradient
In this method, the back-error propagation algorithm is used to estimate the network error and
determine the weight vector and network bias (critical limit) so that it has the least error. The momentum
parameter creates a kind of motional inertiato change the weights. This leads the system to get to the converge
stage with fewer samples and in a shorter time interval. If the used data has fewer numerical errors, it is possible
to use the above mentioned momentum, but in inaccurate systems lower amounts should be adopted.
4-3- Bayzyn Setting:
Bayzyn setting is an algorithm which automatically sets suitable values for the functional parameters.
In this method, weights and biases of the network are considered as random variables with particular
distributions. The statistical techniques are used to estimate the parameter with unknown changes. The
advantage of this algorithm is that the size of the network has less effect on its results.
Time Series (ARMA)
ARMA model with p and q parameters is generally expressed as follow:
Where,
Xt-i: observations of groundwater level at the time t-i,
Zt-i: Noise seed at the time t-i,
andØi , Øj: the Model Coefficients.
There are three fundamental stages in modeling the time series including:
a) Specifications and model determination
In this stage, considering the statistical characteristics of the time series and comparing with the properties
of different models, the type and the form of the model is already specified, which in fact, represents the
manner of the time series. However, the form of the model is not a fixed and final one and may change in
later stages.
b) Model Fitting
Model fitting over the Time series data means to evaluate the parameters of the model on the basis of data
given together with reliable investigation on the evaluated parameters.
c) Recognizing the Model Credit
In this stage the quality of the adopted model will be checked, i.e. how well the model has been fitted on the
sample data and furthermore, whether the existing assumptions of the adopted model are true for the Time
series.
The criterion to Evaluatethe Workability and Errorsof the Model:
The evaluation criteria to assess the workability of different models have been represented by the International
Meteorological Organization.
- The average square root of the error will be estimated as follow:
In the above equation, y1 is the “observed results”, ŷ1 is the “estimated results” and N is the “frequency of the
observations, and RMSE shows the difference between the observed and calculated values.
R2
presents the Network’s Efficiency and is expressed as follow:
The most optimum answer of this model will be gained when RMSE tends toward zero and R2
tends toward
one, and in Time series the Residual Analysis must be checked as well as the above stages.
1- Analysis Results:
Data preparation of these models will be usually done in two stages:
a) Data Normalization:
N
yy
RMSE
N
i
ii
1
2
)ˆ(
2
2
2
)(
)ˆ(
1
ii
ii
yy
yy
R
4. The Artificial Neural Network And Time…
www.ijesi.org 57 | Page
The first step to prepare the data for modeling by neural networks is data normalization. There are several
methods of data normalization. In this study, equations 1-4 are used to normalize the data.
b) Data Classification:
The most important effort taken after data normalization is to determine the set of training, examining
and validationdata. The examining data set which examines the model generalization capability must explain
and represent the whole data sets. In this study, 70% of the total data is used for training, while 30% is used for
examining as well. The results gained via different structures are presented with six input patterns by means of
error evaluation criteriaR2
and RMSE in table (1-7). Considering the results, it has been clarified that the best
input pattern for prediction is the fourth one, that is, the waterflow with two delays and precipitation,
evaporation and temperature, each one with a delay, same as figure (1-7). In this study, the best model is
determined with 5 nodes in the first layer and 6 nodes in the middle one. Thus, this type of model is used to
simulate and predict the water flow rate.
Table (1-7): Results gained via different structures with 6 input patterns
)(
)(
minmax
min
xx
xx
x normalize
5. The Artificial Neural Network And Time…
www.ijesi.org 58 | Page
Figure (1-7): Observed and calculated water flow diagram of the fourth pattern with network type FNN-LM
model
The results of the Stoke Stykymodel (ARMA) in simulation did not meet the requirements at all for 36 months
due to the lack of data and the 6-month simulation is related to ARMA (p=13,q=21) with correlation coefficients
equal to R2
=0.733 and RMSE=0.2604 (see fig. 2-7).
Figure (2-7): Dotted diagram of R2
correlation coefficient and the true and simulated data assessment diagram
Briefly, it can be stated that considering the results achieved through different models the artificial neural
networks capability is beyond the Time series models.
REFERENCES:
[1] Marcos (1995). They used neural networks during their researches to predict monthly water flow of a
river in Western Colorado.
[2] Hall and Maness (1998) in two southern and western regions of England, evaluated the peak flow rate
of the watersheds lacked the hydrometer station by means of different methods.
[3] Dahn (1998) in a study in the central highlands of Vietnam in two watershed regions of Da Nhimn and
Nga, predicted the daily water flow of the river using artificial neural network method with the method
of training after error propagation and physical method of the Tank prediction model.
[4] KarimiMasouleh (1388 / 2009) Application of neural networks in predicting Karoon River’s water flow
rate based on the statistical data of the last six months precipitation of the upstream stations – the
Eighth International Seminar on River Engineering
6. The Artificial Neural Network And Time…
www.ijesi.org 59 | Page
[5] Rahnama (2003) Studied Qareghajbolson flood prediction using artificial neural networks method.
[6] Rezaei and colleagues (2007), using physiographical features of Sefidrood River watershed regions and
one and five-day precipitations before the example flood, tried to model the peak water flow rate
regionally.
[7] Sartaj, Majid et al (1387, 2008) predicting the River flow by means of an artificial neural network –
The 3rd
Iranian Water Resources Management Conference – October 2008
[8] Mohammadi, Mahmood, et al (1385, 2006) predicting average weekly water flow rate entering
Doroodzan Dam Reservoir by artificial neural network –National Conference on Irrigation and
Drainage Networks Management- May 2006
[9] KarimiMasouleh et al (2009)investigated the neural networks application in predicting Karoon River’s
water flow rate on the basis of the statistical data of the lastsix months precipitation of the upstream
stations.