Downloaded 26 times
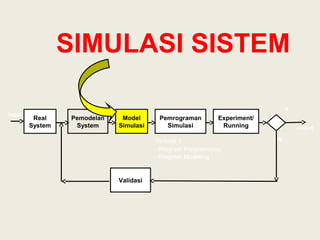
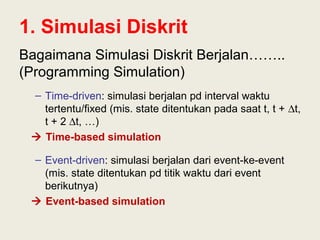
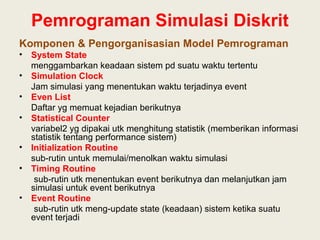
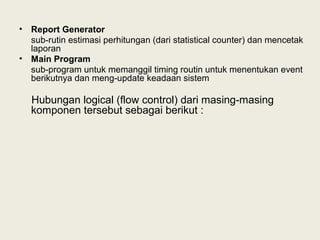
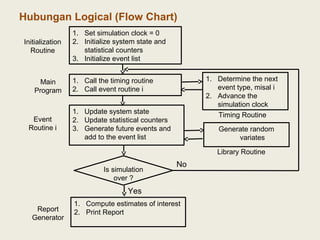
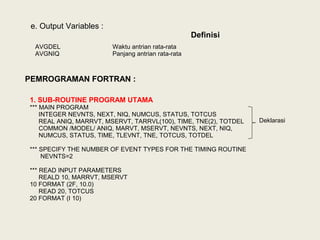

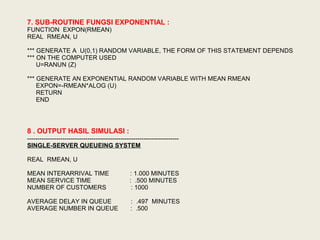

1. The document discusses discrete event simulation and its components. Discrete event simulation models systems as they change states at discrete points in time. It involves events, state variables, event lists, and statistical counters. 2. The programming of discrete event simulation involves components like the system state, simulation clock, event list, statistical counters, initialization routine, timing routine, event routines, and report generator. The timing routine determines the next event and advances the clock, while event routines update the system state. 3. An example Fortran program for simulating a single-server queueing system is presented. It involves subroutines for initialization, timing, arrival and departure events, and reporting. Key variables include event time,


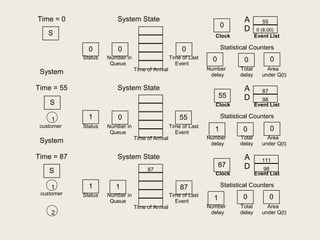
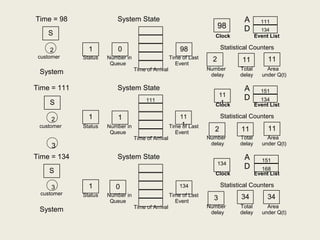
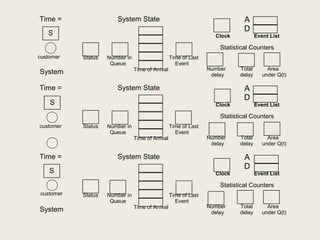
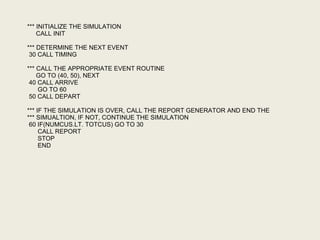
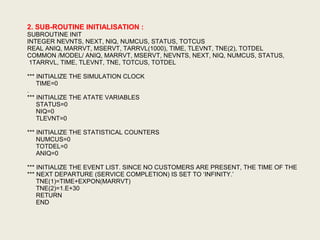
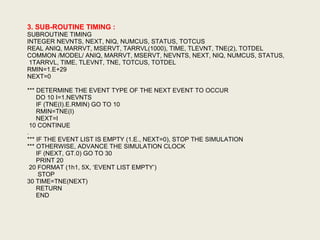
![5G Explained! A High Level Overview [Introduction]](https://cdn.slidesharecdn.com/ss_thumbnails/5gexplainedahighleveloverview-260119165306-cc137a3e-thumbnail.jpg?width=640&height=640&fit=bounds)


