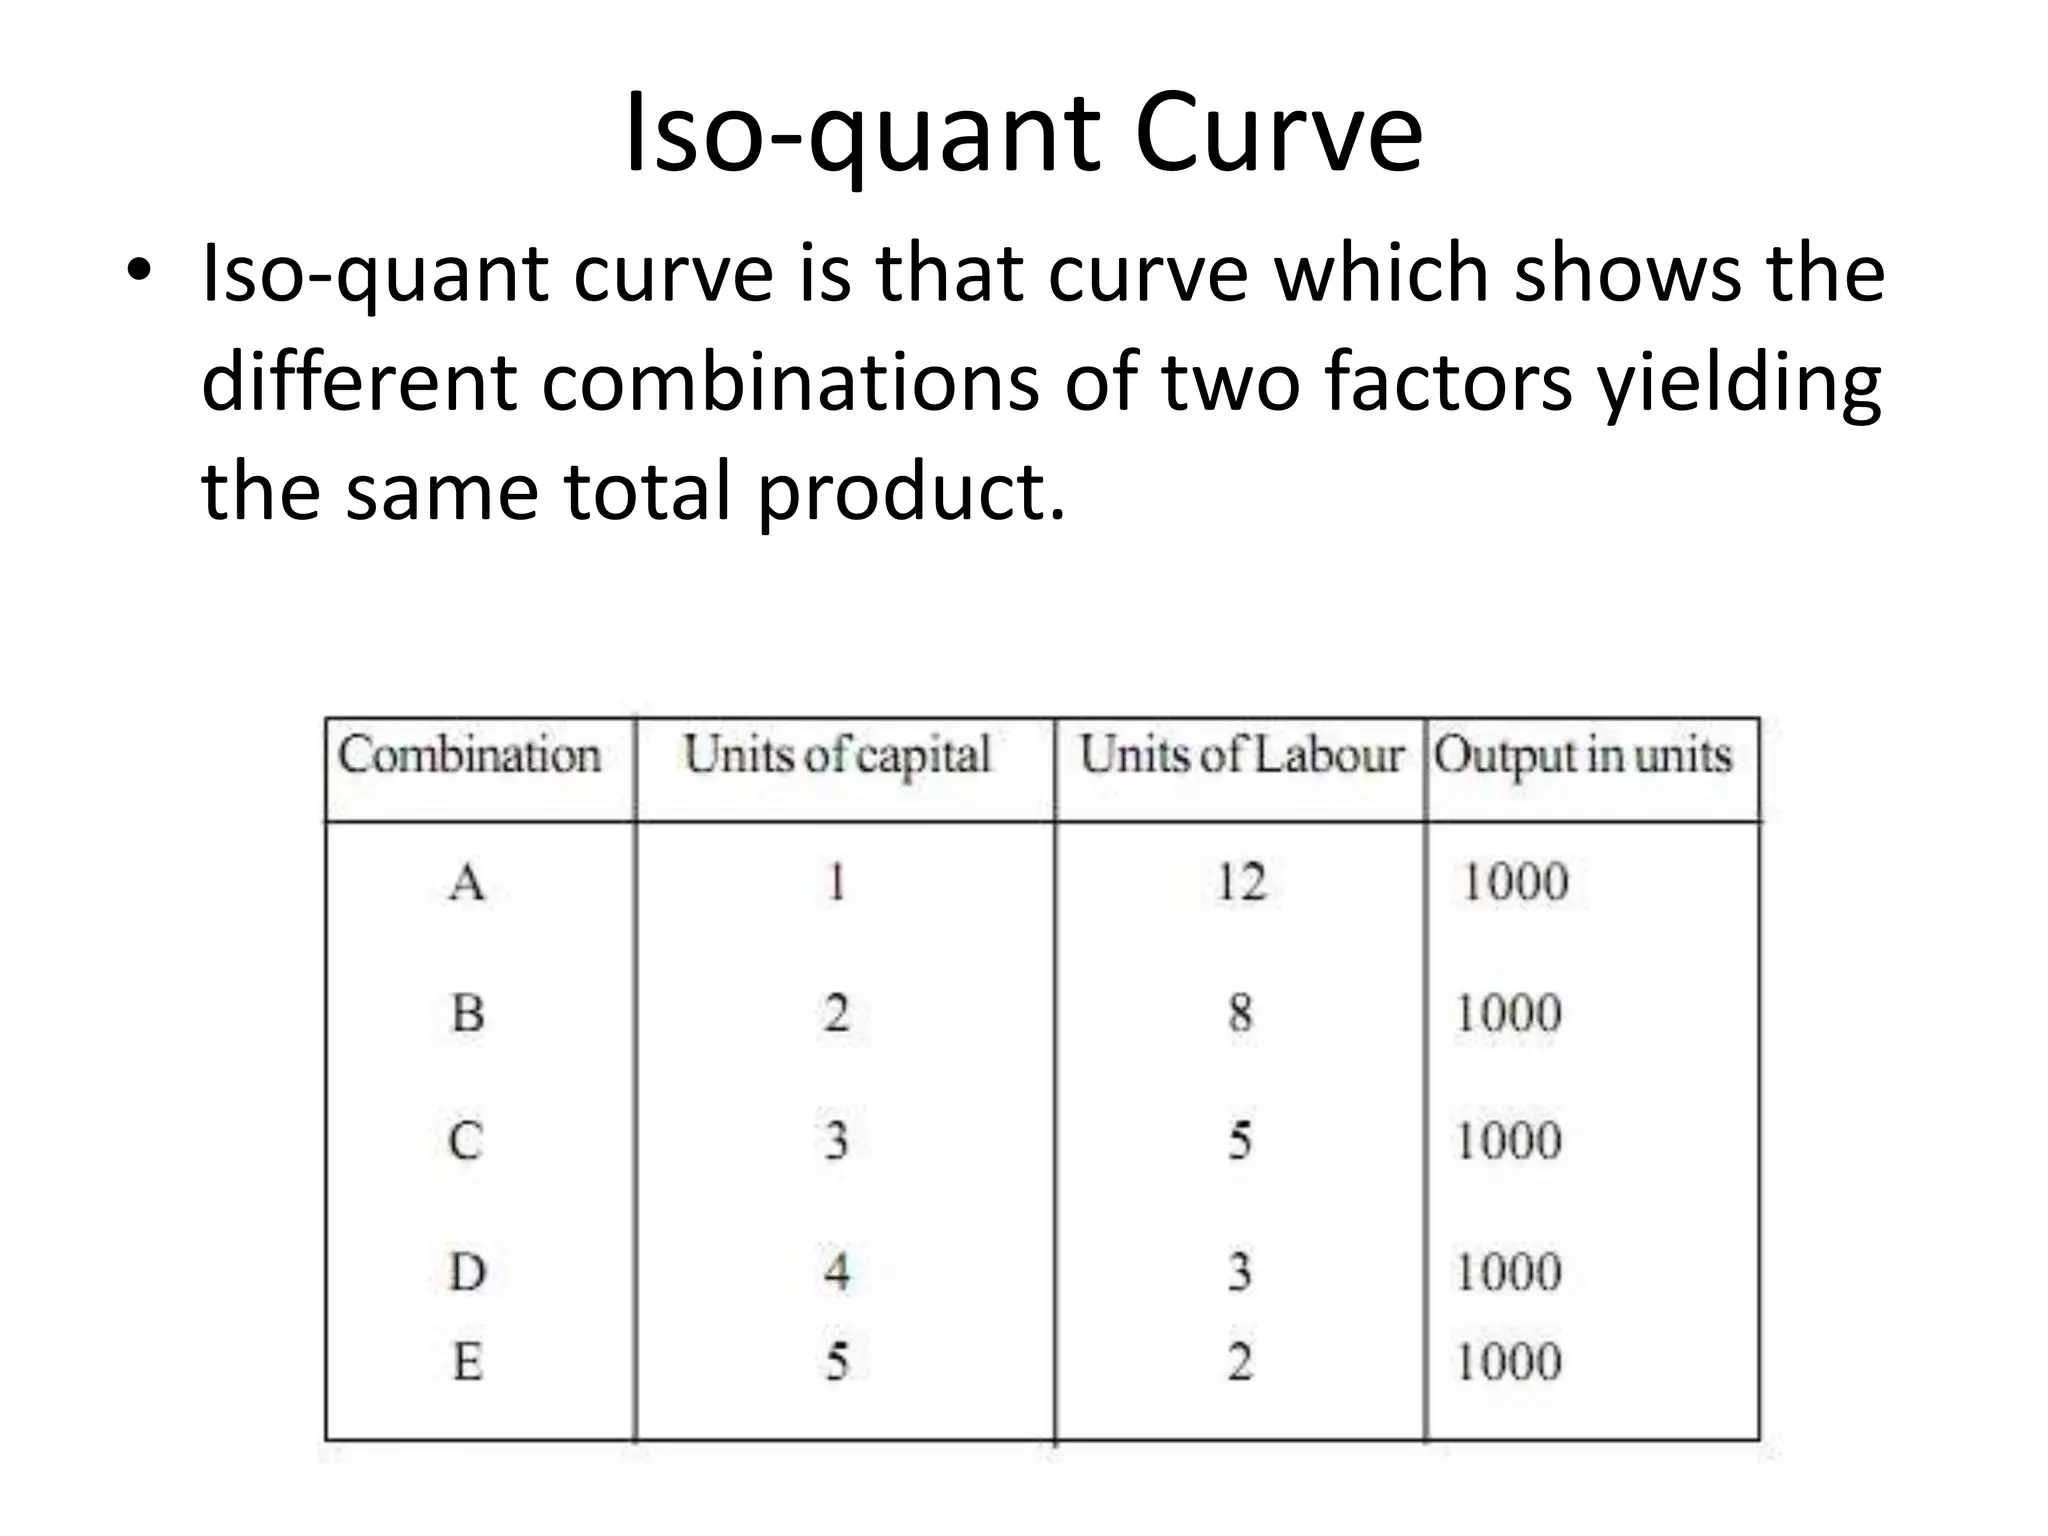
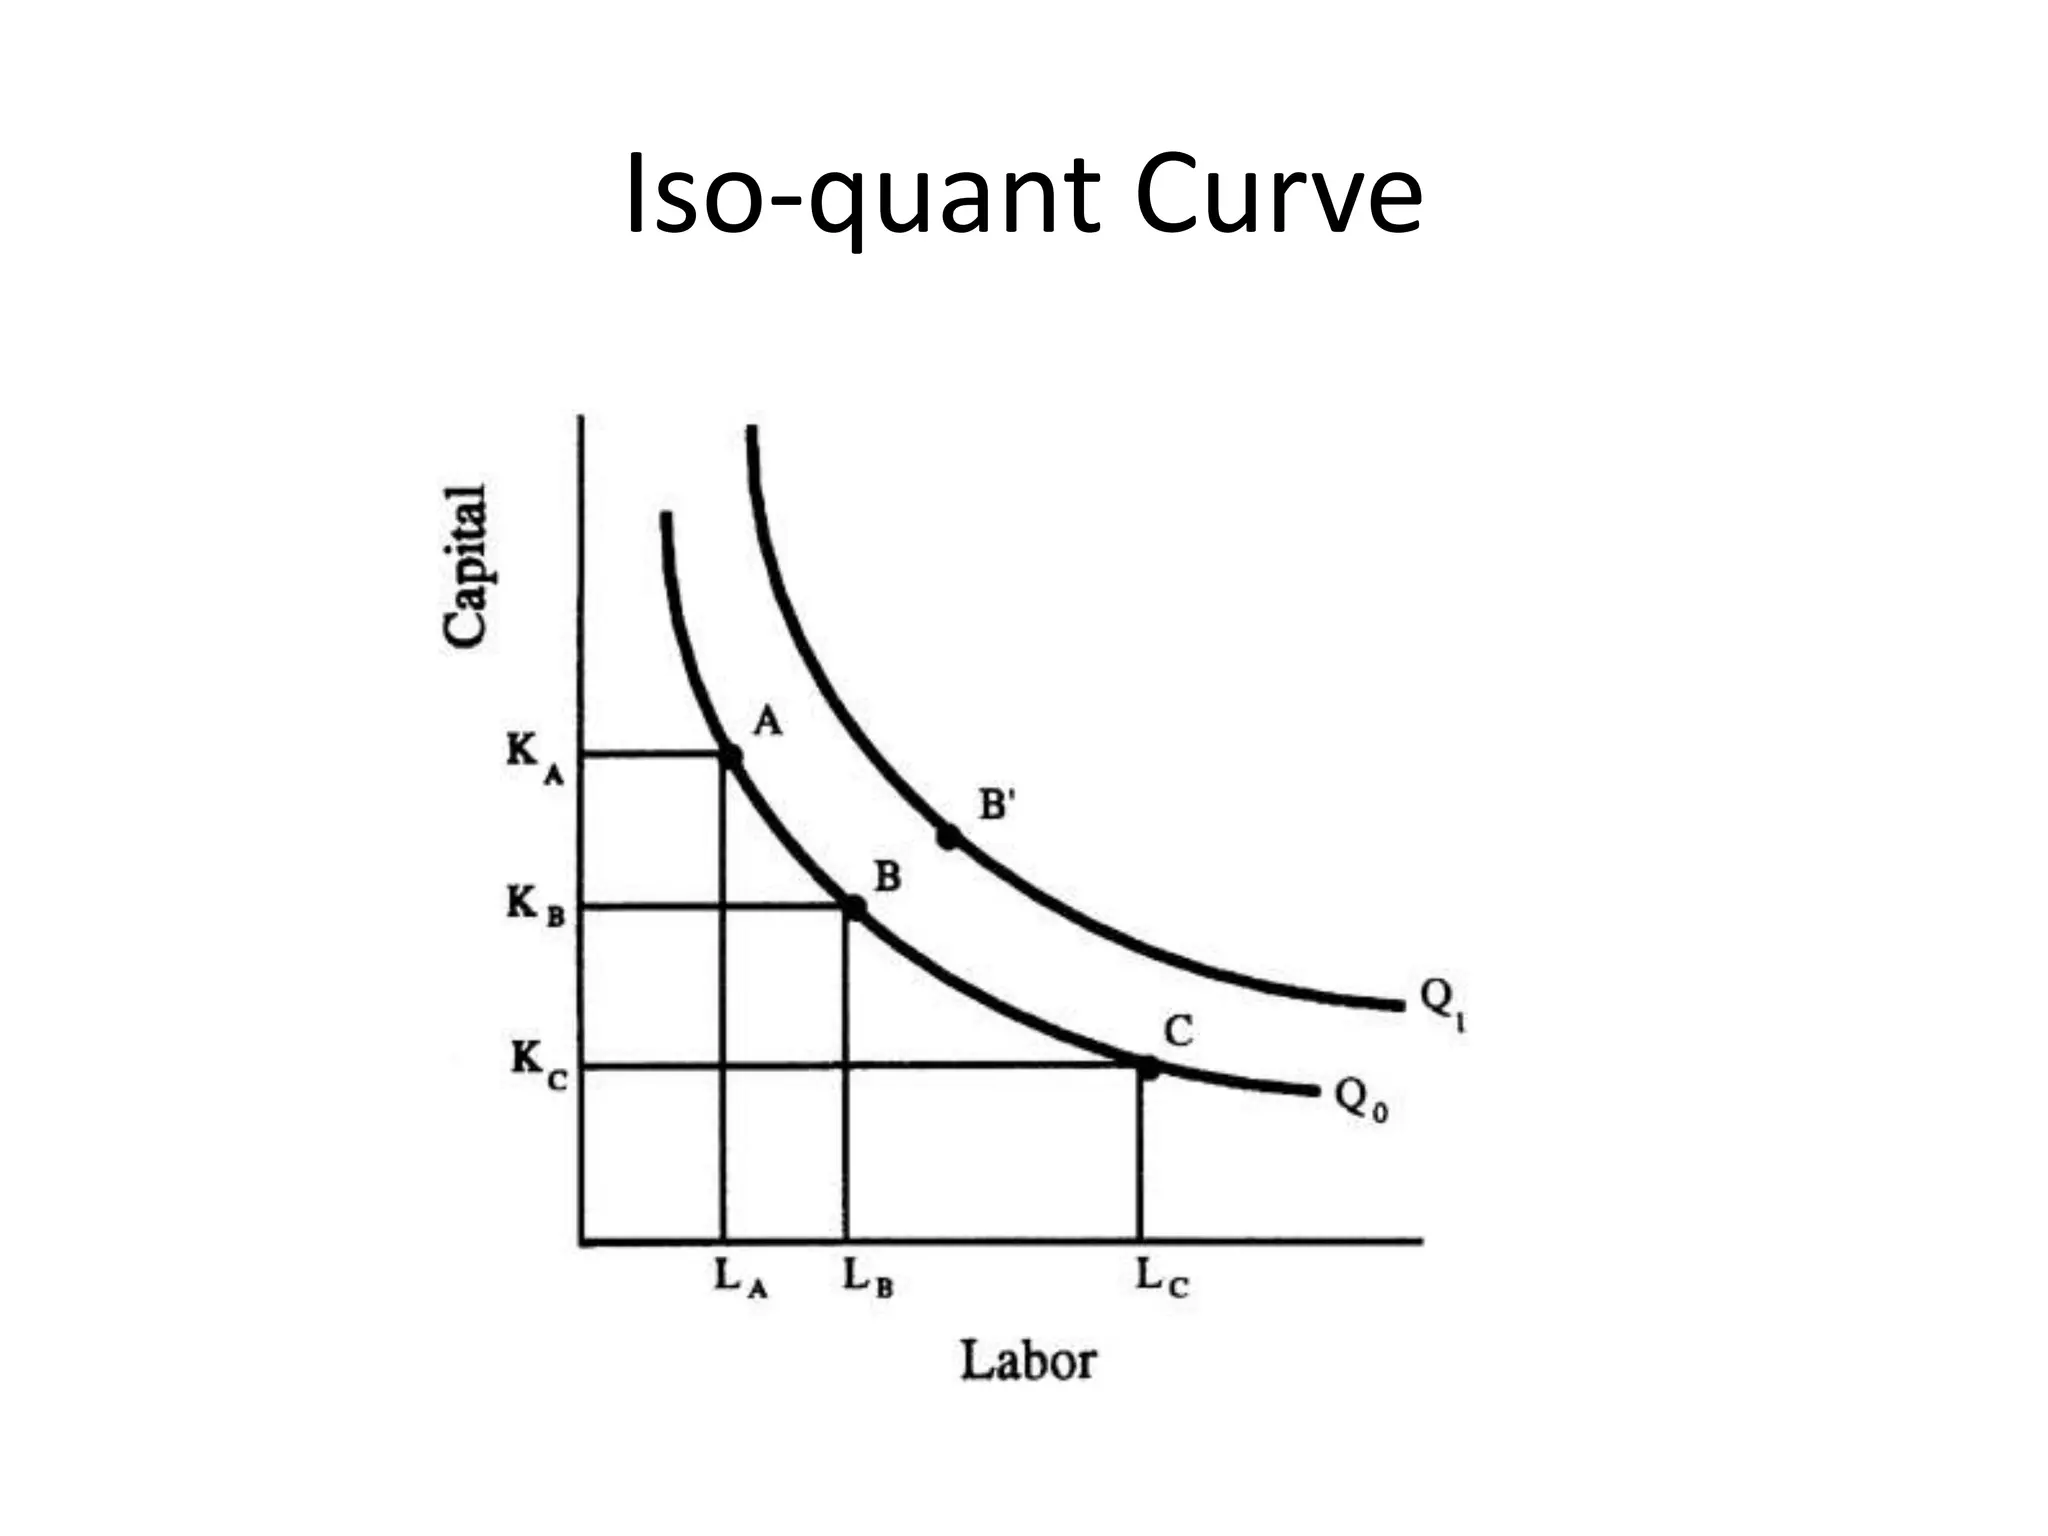
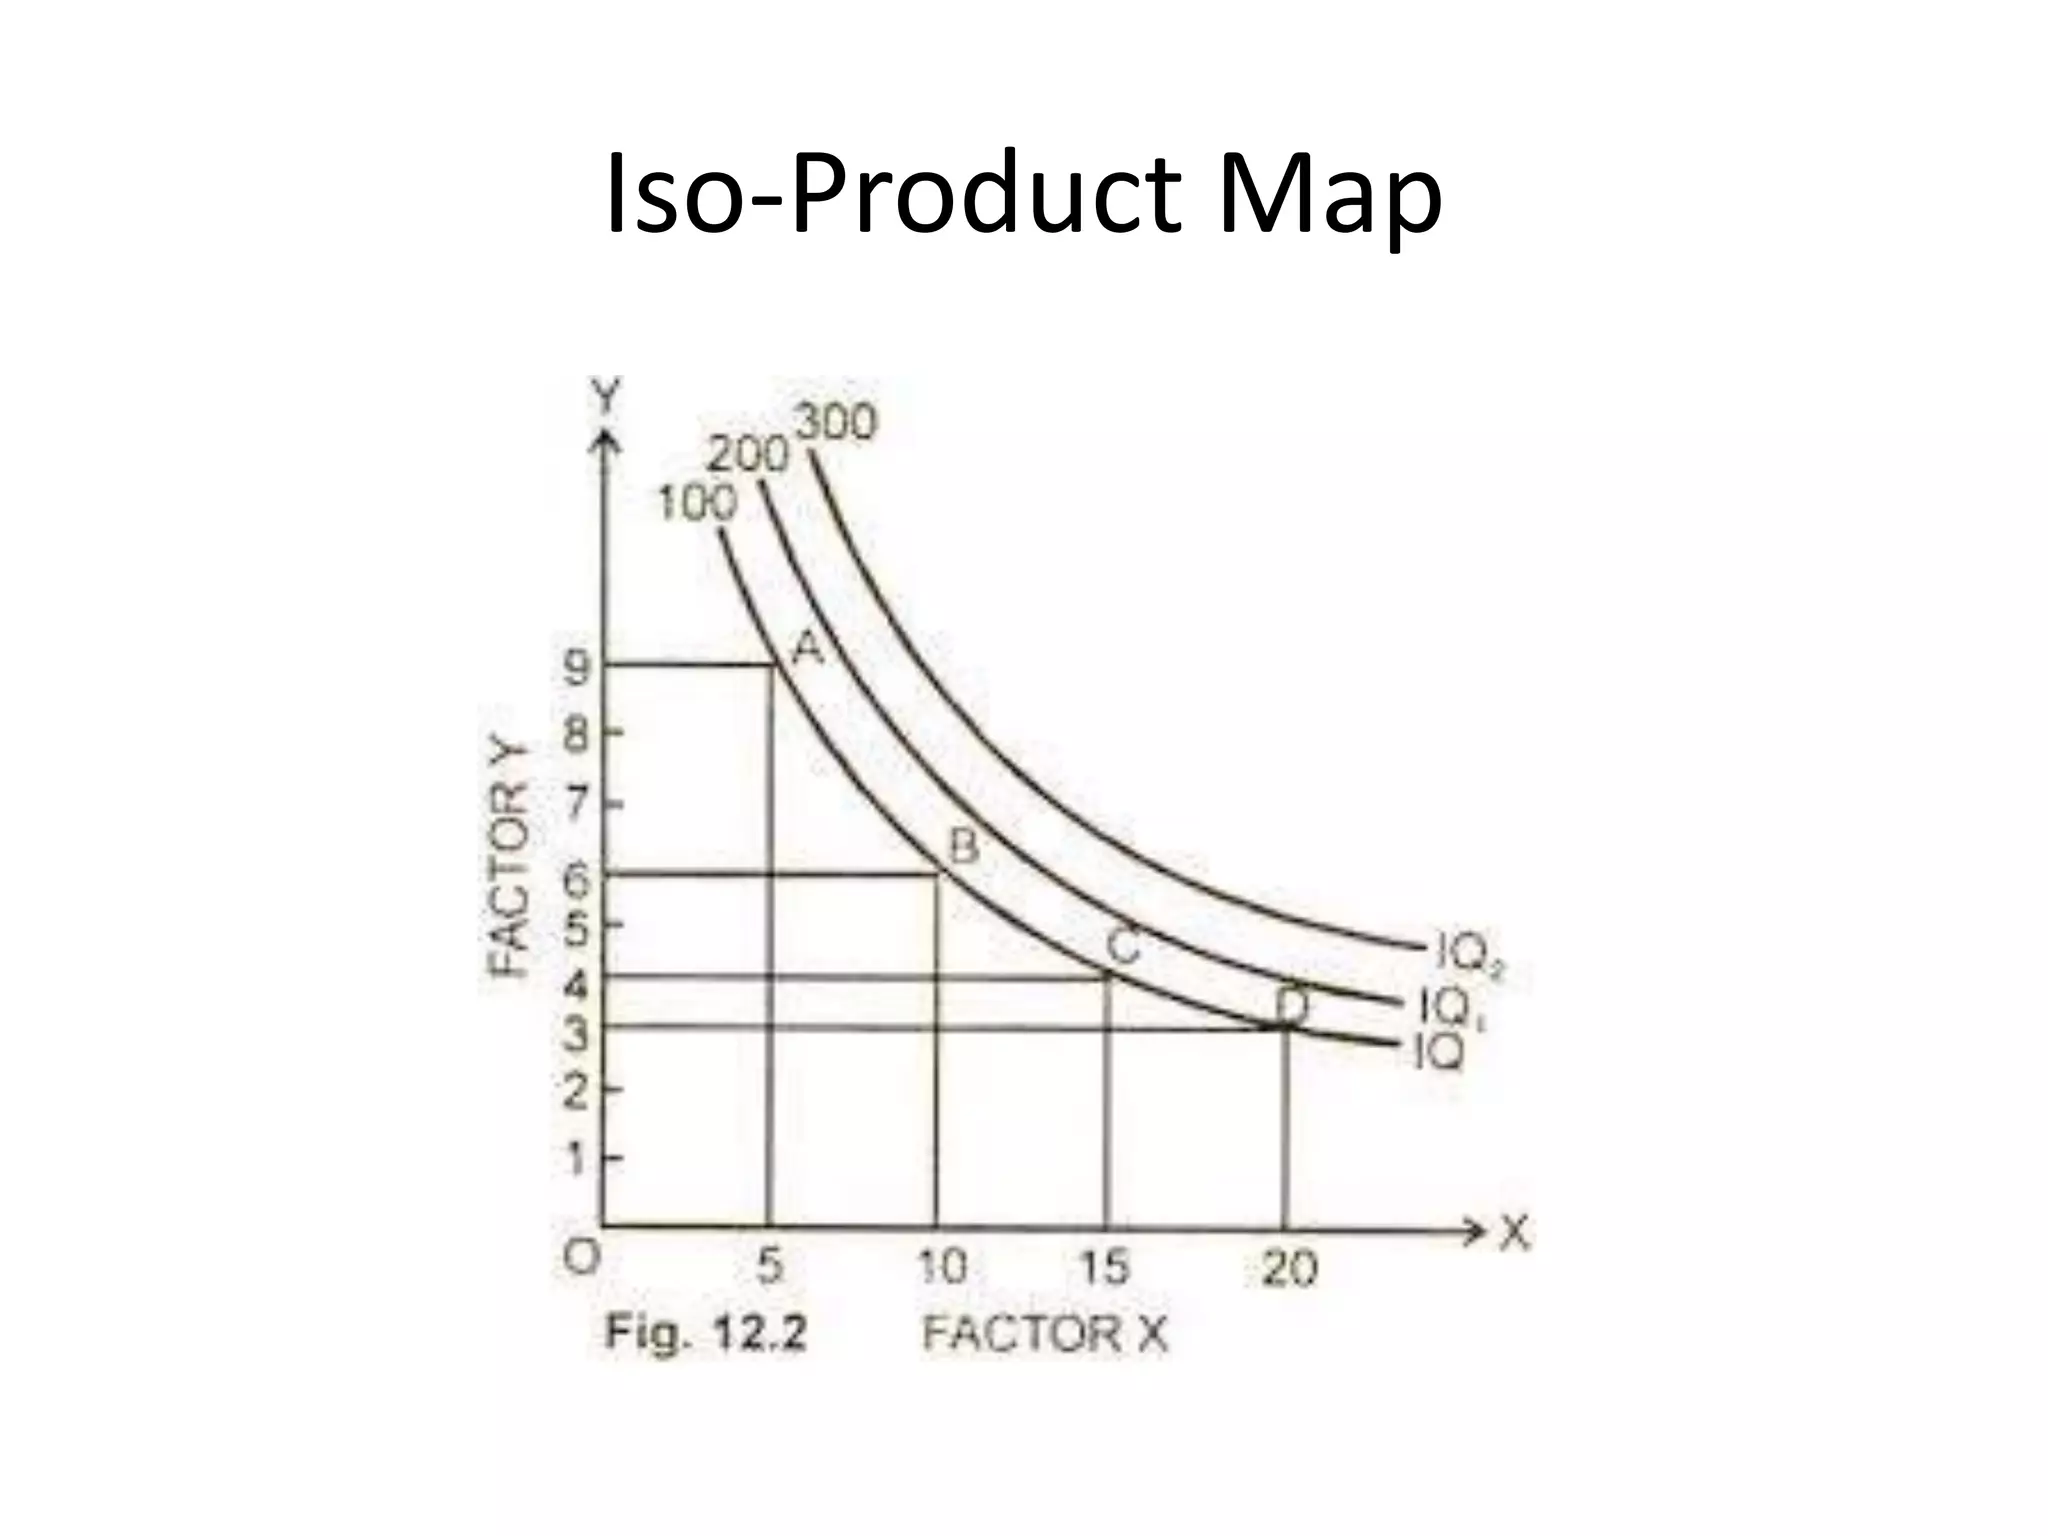
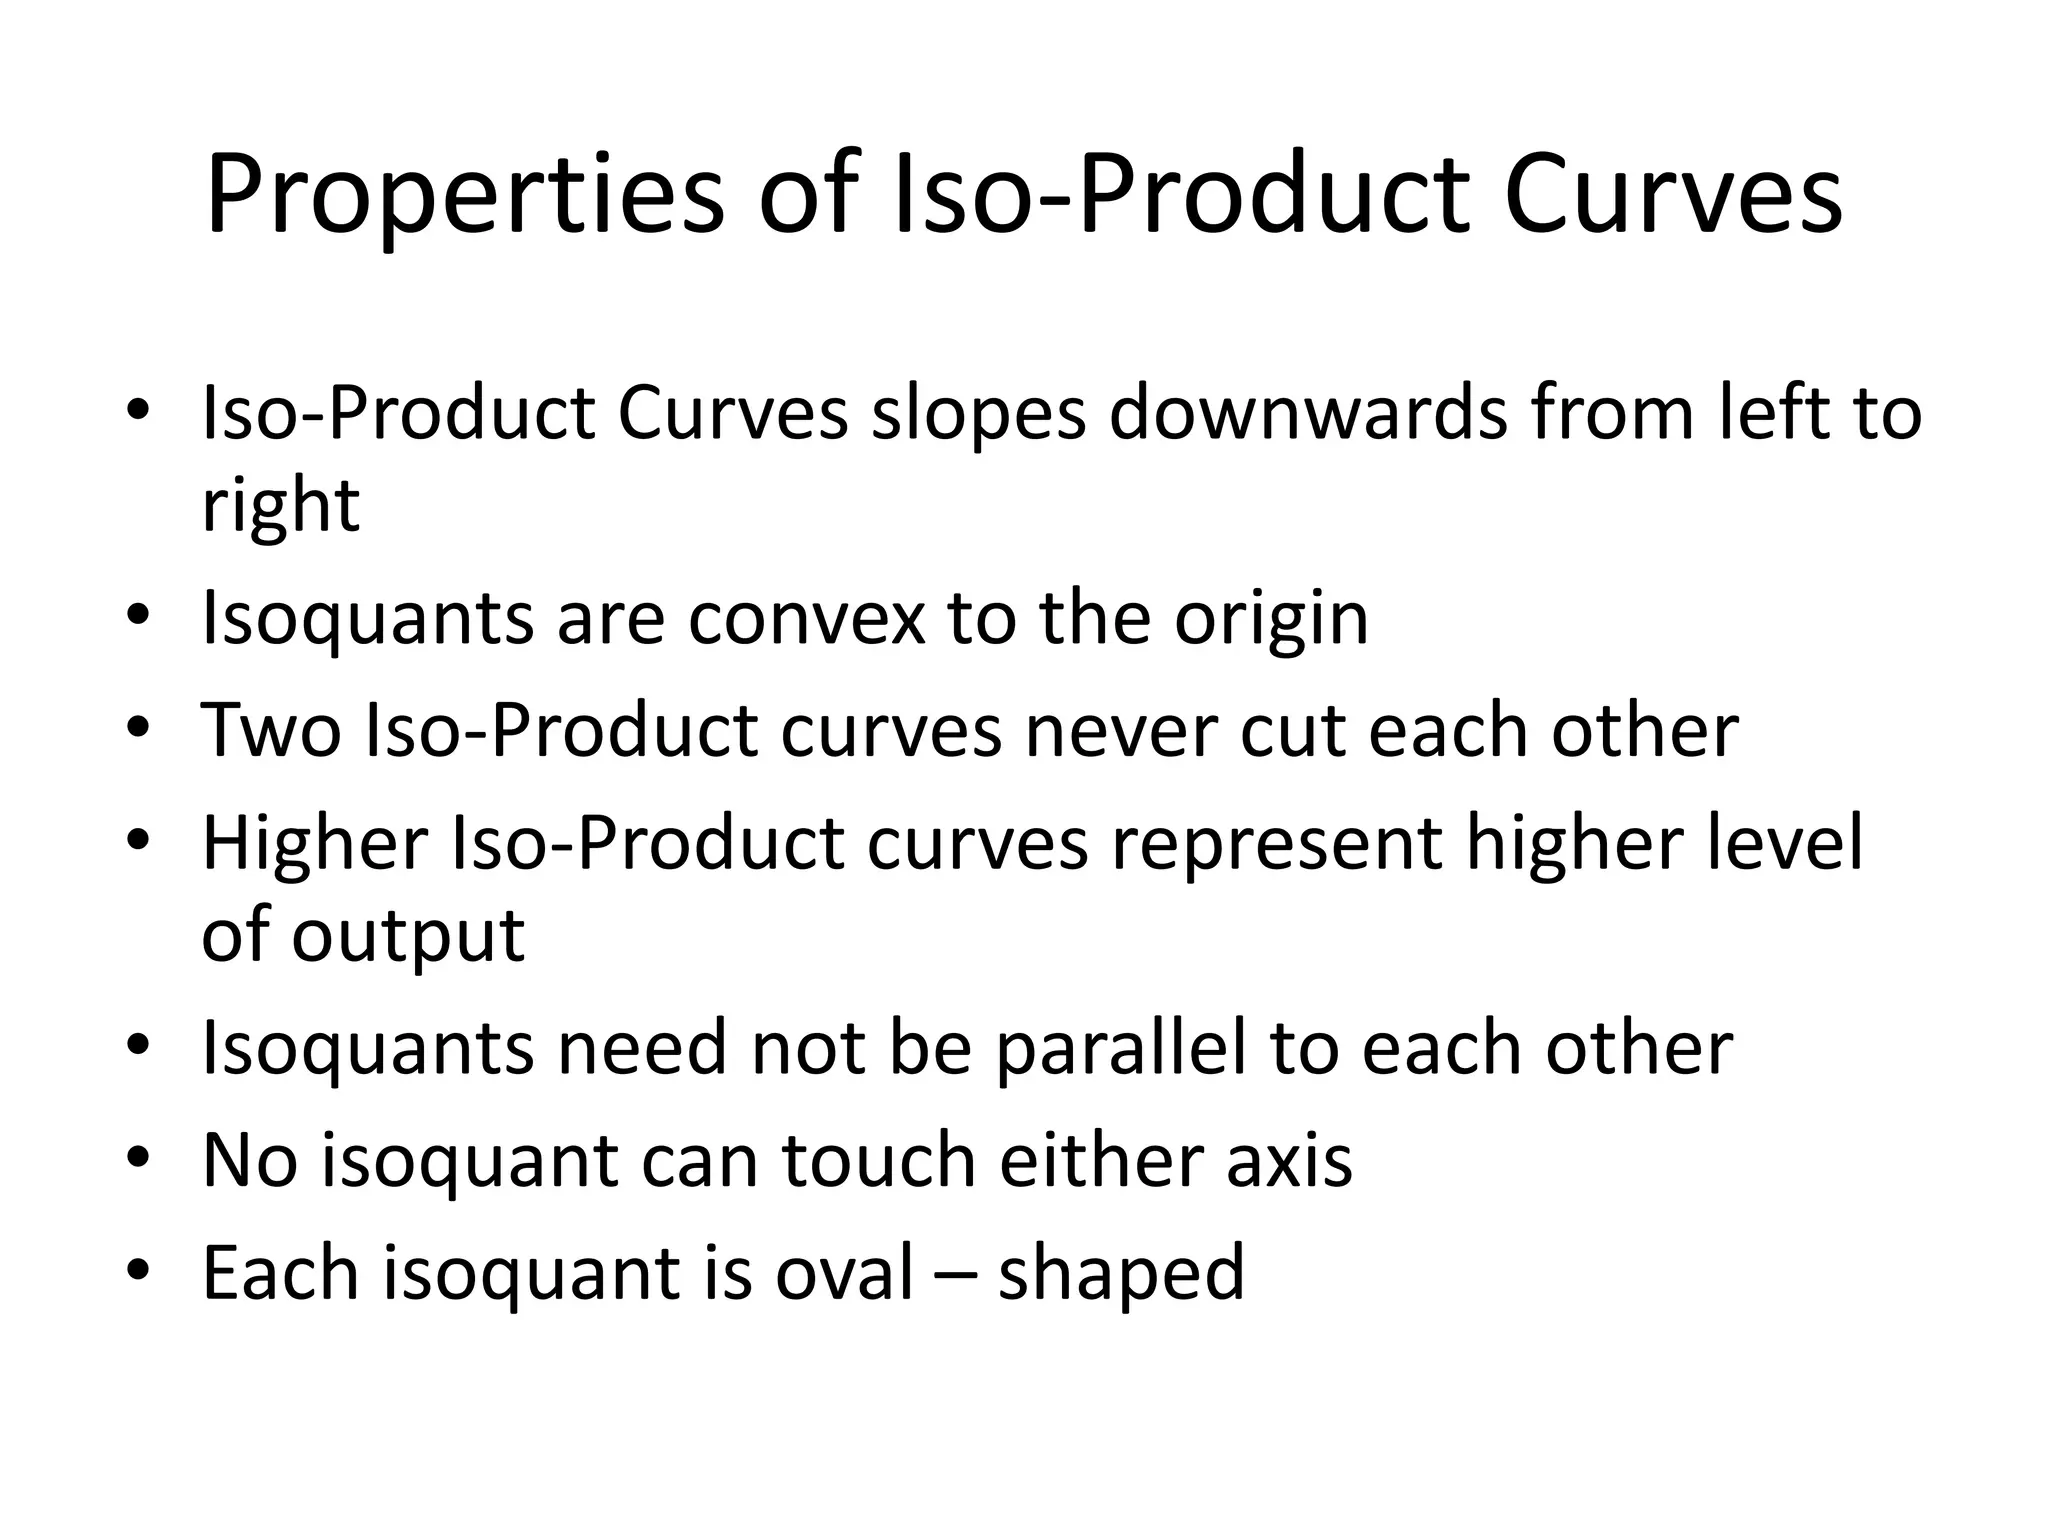
ISO-QUANTS
JITHIN K THOMAS
Berchmans Institute of Management Studies
ISO-QUANTS
• Iso = equal
• Quant = quantity
• Iso - Quant = equal quantity = equal output
Iso-quant Curve
• Iso-quant curve is that curve which shows the
different combinations of two factors yielding
the same total product.
Iso-quant Curve
Iso-quant Curve
• Assumptions
– Two factors of production
– Divisible factor
– Constant technique
– Possibility of Technical substitution
– Efficient combinations
Iso-product Schedule
• Iso-product Schedule shows the different
combinations of two inputs that yield the
same level of output.
• Iso-product Map shows a set of Iso-product
curves.
Iso-Product Map
Properties of Iso-Product Curves
• Iso-Product Curves slopes downwards from left to
right
• Isoquants are convex to the origin
• Two Iso-Product curves never cut each other
• Higher Iso-Product curves represent higher level
of output
• Isoquants need not be parallel to each other
• No isoquant can touch either axis
• Each isoquant is oval – shaped
Marginal Rate of Technical Substitution
• Marginal Rate of Technical Substitution is the
rate at which one input can be substituted for
another input without changing the level of
output.
• Iso-quant Schedule
Combination labour Capital MRTS Output
1 5 9 - 100
2 10 6 3:5 100
3 15 4 2:5 100
4 20 3 1:5 100
Iso-Cost Line
• It is a locus of all combination of two or more
inputs which the producer’s budget can buy
using his fixed outlay at fixed input pries .
Iso-Cost Line
Iso quants

Iso quants

  • 1.
    ISO-QUANTS JITHIN K THOMAS BerchmansInstitute of Management Studies
  • 2.
    ISO-QUANTS • Iso =equal • Quant = quantity • Iso - Quant = equal quantity = equal output
  • 3.
    Iso-quant Curve • Iso-quantcurve is that curve which shows the different combinations of two factors yielding the same total product.
  • 4.
  • 5.
    Iso-quant Curve • Assumptions –Two factors of production – Divisible factor – Constant technique – Possibility of Technical substitution – Efficient combinations
  • 6.
    Iso-product Schedule • Iso-productSchedule shows the different combinations of two inputs that yield the same level of output. • Iso-product Map shows a set of Iso-product curves.
  • 7.
  • 8.
    Properties of Iso-ProductCurves • Iso-Product Curves slopes downwards from left to right • Isoquants are convex to the origin • Two Iso-Product curves never cut each other • Higher Iso-Product curves represent higher level of output • Isoquants need not be parallel to each other • No isoquant can touch either axis • Each isoquant is oval – shaped
  • 9.
    Marginal Rate ofTechnical Substitution • Marginal Rate of Technical Substitution is the rate at which one input can be substituted for another input without changing the level of output. • Iso-quant Schedule Combination labour Capital MRTS Output 1 5 9 - 100 2 10 6 3:5 100 3 15 4 2:5 100 4 20 3 1:5 100
  • 10.
    Iso-Cost Line • Itis a locus of all combination of two or more inputs which the producer’s budget can buy using his fixed outlay at fixed input pries .
  • 11.