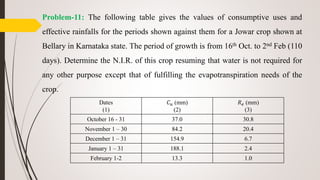
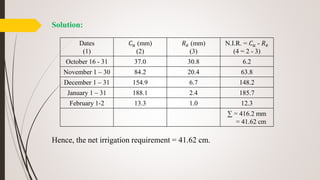
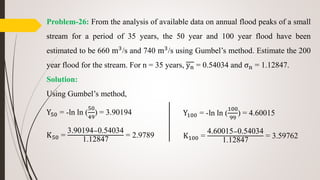
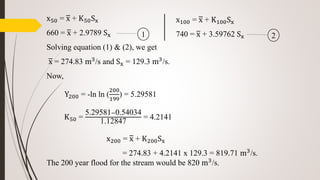
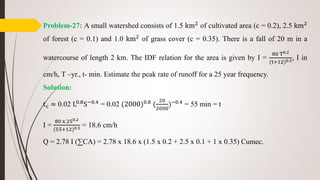
Downloaded 21 times


![Depth of water (or moisture) held by soil in root zone and available to
plants:
The water held by soil in root zone may be expressed in terms of depth of
water which may be determined as indicated below:
Let, d be the depth of root zone, 𝑤𝑠 be the specific weight of soil and w be
the specific weight of water. If unit area of soil is considered then the weight
of soil per unit area and depth d is equal to (𝑤𝑠 x 1 x d).
Further the weight of water held by the soil per unit area is equal to [w x 1 x
depth of water]
Field capacity =
𝑊𝑒𝑖𝑔ℎ𝑡 𝑜𝑓 𝑤𝑎𝑡𝑒𝑟 ℎ𝑒𝑙𝑑 𝑏𝑦 𝑠𝑜𝑖𝑙 𝑝𝑒𝑟 𝑢𝑛𝑖𝑡 𝑎𝑟𝑒𝑎
𝑊𝑒𝑖𝑔ℎ𝑡 𝑜𝑓 𝑠𝑜𝑖𝑙 𝑝𝑒𝑟 𝑢𝑛𝑖𝑡 𝑎𝑟𝑒𝑎](https://image.slidesharecdn.com/ce461-200329164810/85/Irrigation-Flood-Control-23-320.jpg)
![Field capacity =
𝑊𝑒𝑖𝑔ℎ𝑡 𝑜𝑓 𝑤𝑎𝑡𝑒𝑟 ℎ𝑒𝑙𝑑 𝑏𝑦 𝑠𝑜𝑖𝑙 𝑝𝑒𝑟 𝑢𝑛𝑖𝑡 𝑎𝑟𝑒𝑎
𝑊𝑒𝑖𝑔ℎ𝑡 𝑜𝑓 𝑠𝑜𝑖𝑙 𝑝𝑒𝑟 𝑢𝑛𝑖𝑡 𝑎𝑟𝑒𝑎
=
w x 1 x depth of water
𝑤 𝑠 x 1 x d
∴ Depth of water held by soil at field capacity =
𝑤 𝑠
𝑤
x d x [Field capacity]
= S x d x [Field capacity]
Where, S is the specific gravity of soil.
∴ Depth of water held by soil at permanent wilting point
=
𝑤 𝑠
𝑤
x d x [permanent wilting point]
= S x d x [permanent wilting point]](https://image.slidesharecdn.com/ce461-200329164810/85/Irrigation-Flood-Control-24-320.jpg)
![∴ Depth of available water =
𝑤 𝑠
𝑤
x d x [Field capacity - permanent wilting point]
= S x d x [Field capacity - permanent wilting point]
∴ Further depth of available water per meter depth of soil
=
𝑤 𝑠
𝑤
x [Field capacity - permanent wilting point]
= S x [Field capacity - permanent wilting point]](https://image.slidesharecdn.com/ce461-200329164810/85/Irrigation-Flood-Control-25-320.jpg)
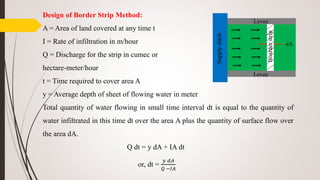
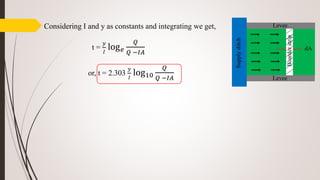
![Problem-1: The root zone of a certain soil has a field capacity of 30% and
permanent wilting percentage is 10%.
a) What is the depth of moisture in the root zone at field capacity and
permanent wilting point?
b) How much water is available if the root zone depth is 1.2 m. The dry
weight of soil is 13.73 kN/𝑚3
[1400kg/𝑚3
].](https://image.slidesharecdn.com/ce461-200329164810/85/Irrigation-Flood-Control-26-320.jpg)
![Solution:
a) The depth of moisture in root zone at field capacity per meter depth of
soil = S x Field capacity =
1400
1000
x
30
100
= 0.42 m/m
The depth of moisture in root zone at permanent wilting point per meter
depth of soil = S x Permanent wilting point =
1400
1000
x
10
100
= 0.14 m/m
b) The depth of water available per meter depth of soil
= S x [Field capacity - Permanent wilting point ]
=
1400
1000
x (
30
100
-
10
100
) = 0.28 m/m
∴ Total water available in the root zone = 0.28 x 1.2 m = 0.336 m = 336 mm.](https://image.slidesharecdn.com/ce461-200329164810/85/Irrigation-Flood-Control-27-320.jpg)
![Solution: Maximum storage capacity of soil = Available moisture
= S x d x [Field capacity - Permanent wilting point]
=
14.72
9.81
x 0.75 x [0.25 – 0.10]
= 0.169 m = 169 mm.
Depth of irrigation water = S x d x [Field capacity – Minimum moisture content at
which irrigation is required]
=
14.72
9.81
x 0.75 x [0.25 – 0.14]
= 0.124 m = 124 mm.
Depth of irrigation water to be applied in the field =
124
0.75
mm = 165 mm.](https://image.slidesharecdn.com/ce461-200329164810/85/Irrigation-Flood-Control-31-320.jpg)
![Problem-4: The field capacity of a certain soils is 18.3% and specific gravity
is 1.25. A wet sample of soil taken before irrigation weighs 153 gm and its
weight after drying in the oven is 138 gm. What depth of water must be
applied to irrigate the soil to a depth of 1.2 m?
Solution:
The moisture content before irrigation =
153−138
138
x 100 = 10.9%
Depth of water required to be applied to bring the moisture up to its field
capacity = 1.25 x 1.2 x [
18.3
100
-
10.9
100
] = 0.111 m = 111mm.](https://image.slidesharecdn.com/ce461-200329164810/85/Irrigation-Flood-Control-32-320.jpg)
![Problem-5: The field capacity of a certain soils is 12.6% and specific gravity is 1.42.
If the moisture content present in the soil before irrigation is 8.2%, how deep the soil
profile will be welted with an application of 50 mm of irrigation water?
Solution:
Depth of irrigation water = S x d x [Field capacity –Moisture content before irrigation]
or,
50
100
= 1.42 x d x [
12.6
100
-
8.2
100
]
or, d =
50
100
1.42 𝑥 [
12.6
100
− 8.2
100
]
= 0.80 m = 800 mm.](https://image.slidesharecdn.com/ce461-200329164810/85/Irrigation-Flood-Control-33-320.jpg)
![Solution:
Depth of irrigation water to be applied, 𝑑′ = S x d x [Field capacity –Moisture
content before irrigation]
= 1.35 x 1 x [
27
100
-
0.5 𝑥 27
100
]
= 0.182 m = 182 mm.
If the irrigation water is applied at the rate of q cubic meter per hour for t hours over area
of a hectare and 𝑑′ is the depth of water required to be applied in meter, then we have
q x t = a x 104 x 0.182
or,
30000
1000
x t =
1000 𝑥 10
104 x 104 x 0.182
∴ t = 60.7 hours.](https://image.slidesharecdn.com/ce461-200329164810/85/Irrigation-Flood-Control-35-320.jpg)


![Jensen-Haise Method: Jensen-Hasie used observation of consumptive use from the western
United states and developed the following linear relationship for estimating the potential
evapotranspiration.
𝐸𝑡 𝑝
= 𝐶𝑡(t - 𝑡 𝑥) 𝑅 𝑠
𝐸𝑡 𝑝
= potential evapotranspiration for reference crop in mm/day.
𝐶𝑡 = A temperature co-efficient =
1
𝐶1+𝐶2 𝐶 𝐻
𝐶1 = 38 – (20
C x
𝐸𝐿
305
) [EL = Altitude of the place in meters]
𝐶2 = 7.60
C
𝐶 𝐻 =
50 𝑚𝑏𝑎𝑟
𝑒2 −𝑒1
𝑒2 and 𝑒1 are saturation vapour pressures of water in mbar at the mean daily maximum and
minimum temperatures respectively, for the warmest month of the year in a given area.
𝑡 𝑥 = - 2.5 – 0.14 (𝑒2 − 𝑒1)0
C/m bar -
𝐸𝐿
550
𝑅 𝑠 = 𝑅 𝑎 (a + b
𝑛
𝑁
)
t = mean daily temperature](https://image.slidesharecdn.com/ce461-200329164810/85/Irrigation-Flood-Control-56-320.jpg)
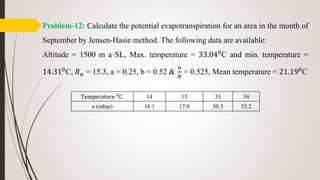
![Solution:
For 33.040
C 𝑒2 = 50.3 +
53.02 −50.3
1
x 0.04 = 50.416 mbar
For 14.310
C 𝑒2 = 16.1 +
17 −16.1
1
x 0.31 = 16.379 mbar
𝐶1 = 38 – (20
C x
𝐸𝐿
305
) = 38 – (2 x
1500
305
) = 28.164
𝐶2 = 7.6
𝐶 𝐻 =
50 𝑚𝑏𝑎𝑟
𝑒2 −𝑒1
=
50
50.416 −16.379
= 1.469
𝐶𝑡 =
1
𝐶1+𝐶2 𝐶 𝐻
=
1
28.164+7.6 𝑥 1.469
= 0.0254
𝐸𝑡 𝑝
= 𝐶𝑡(t - 𝑡 𝑥) 𝑅 𝑠
= 0.025 x [21.19 – (-9.992)] x 8.002 = 6.338 mm/day
𝑡 𝑥 = - 2.5 – 0.14 (𝑒2 − 𝑒1) -
𝐸𝐿
550
= - 2.5 – 0.14 (50.416 – 16.379) -
1500
550
=−9.992 0
C
𝑅 𝑠 = 𝑅 𝑎 (a + b
𝑛
𝑁
)
= 15.3 (0.25 + 0.52 x 0.525) = 8.002](https://image.slidesharecdn.com/ce461-200329164810/85/Irrigation-Flood-Control-58-320.jpg)
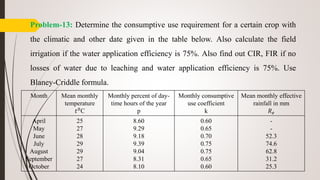
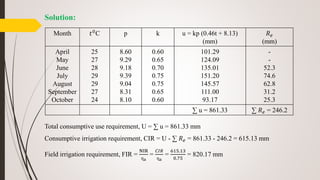
![Blaney-Criddle Method: Blaney and Criddle (1950) developed a simplified
formula in the consumptive use of water is correlated with the temperature and
daytime hours. By multiplying the mean monthly temperature t by the mean monthly
percentage p of the maximum possible daytime hours of the year, a monthly
consumptive use factor f is obtained as f =
𝑝𝑡
100
. The value of p depends on the
latitude of the place and the period of the year and it may be obtained from Table.
u = kf = k (
𝑝𝑡
100
) [ k is the monthly consumptive use coefficient]
Here, u in inch unit and temperature in degree Fahrenheit.
For SI/metric system,
u = kf = kp (0.46t + 8.13)
Here, u in millimeter and t in degree Celsius.](https://image.slidesharecdn.com/ce461-200329164810/85/Irrigation-Flood-Control-59-320.jpg)


![Flood Control Economics:
Generally the flood stage for which the ration annual benefit to cost is a maximum is
adopted for the design of flood protection works. Protection against floods of rare
occurrence is uneconomical because of the large investment (for a small increase in
the benefit) and hence there is always a certain amount of flood risk involved.
Total benefit (2)
Total cost (1)
Benefit
Cost
= 1
Max. benefit
Design stage of flood
Max. feasible peak
(1)Totalcost[incrores]
(2)Totalbenefit[incrores]
Reduction in flood peak, Q (cumec)](https://image.slidesharecdn.com/ce461-200329164810/85/Irrigation-Flood-Control-136-320.jpg)


![Chezy's Formula:
V = C 𝑅𝑆 [C = Chezy’s Co-efficient]
Manning’s Formula:
V =
1
𝑛
𝑅
2
3 𝑆
1
2 [n = Manning’s Co-efficient]
Kutter’s Formula:
V = [
1
𝑛
+(23+
0.00155
𝑆
)
1+ 23+
0.00155
𝑆
∗
𝑛
𝑅
] x 𝑅𝑆 [n = Rugosity Co-efficient]](https://image.slidesharecdn.com/ce461-200329164810/85/Irrigation-Flood-Control-156-320.jpg)
![According to Kutter’s formula,
V = [
1
0.023
+(23+
0.00155
1/4000
)
1+ 23+
0.00155
1/4000
∗
0.023
1.76
] x 1.76 𝑥 (
1
4000
)
= 1.016 m/sec >> 𝑉0 [Not Ok]
In order to increase the velocity 𝑉0 we have to increase the depth.
Let, y = 2.7
𝑉0 =1.142 m/sec
A = 43.78 𝑚2
V = 1.140 m/sec ≈ 𝑉0 [Ok]
Hence use the depth = 2.7 and base width 14.86 m with slope
1
2
H : 1 V and the
section will be trapezoidal.
b = 14.86 m
P = 20.9 m
R = 2.09 m](https://image.slidesharecdn.com/ce461-200329164810/85/Irrigation-Flood-Control-158-320.jpg)

![Design Procedure of Lacey’s Regime Channel:
Design velocity, V = [
𝑄𝑓2
140
]
1
6
Where, Q = Discharge in cumec.
V = Velocity in m/sec.
f = Silt factor = 1.76 𝑑 𝑚𝑚
𝑑 𝑚𝑚 = Average particle size in mm
Hydraulic mean depth, R =
5
2
x
𝑉2
𝑓
Area, A =
𝑄
𝑉
Perimeter, P = 4.75 𝑄
Bed slope, S =
𝑓
5
3
3340 𝑥 𝑄
1
6](https://image.slidesharecdn.com/ce461-200329164810/85/Irrigation-Flood-Control-161-320.jpg)
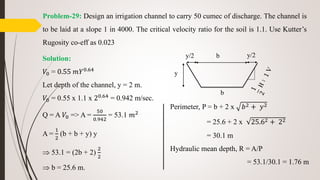
![Problem-30: Design a regime channel for a discharge of 50 cumec and silt factor 1.1
using Lacey’s theory.
Solution:
V = [
𝑄𝑓2
140
]
1
6 = 0.87 m/sec
R =
5
2
x
𝑉2
𝑓
= 1.72 m.
A =
𝑄
𝑉
= 57.5 𝑚2
P = 4.75 𝑄 = 33.6 m
S =
𝑓
5
3
3340 𝑥 𝑄
1
6
=
1
5469
Consider a trapezoidal channel section
with depth y, bed b and slope
1
2
H : 1 V.
y/2 b
b
y/2
y
Perimeter, P = b + 2 x 𝑦2 + (
𝑦
2
)2= b + 5 y
=> b = 33.6 - 5 y
A =
1
2
(b + b +
𝑦
2
+
𝑦
2
) * y = by +
𝑦2
2
57.5 = (33.6 - 5 y) y +
𝑦2
2
y = 1.89 m.
b = 29.37 m](https://image.slidesharecdn.com/ce461-200329164810/85/Irrigation-Flood-Control-162-320.jpg)


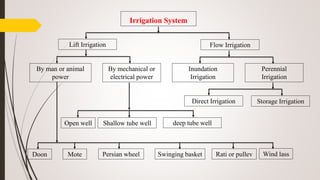
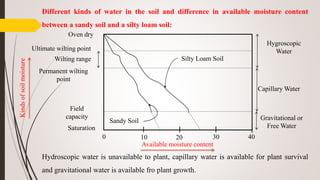
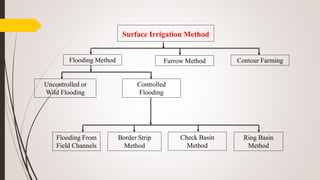
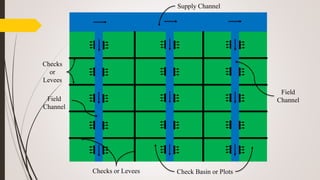
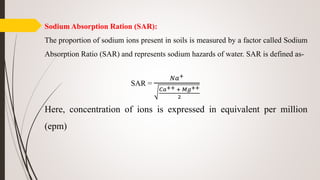
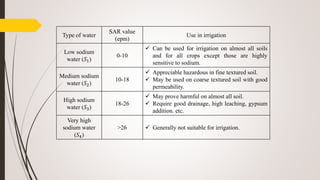
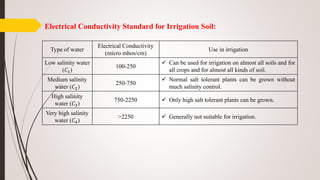
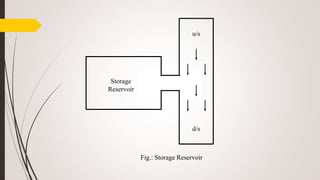
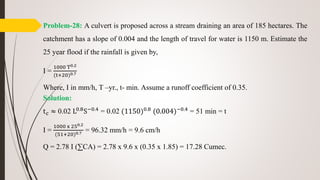
The document discusses the importance and methods of irrigation, highlighting its necessity due to insufficient and non-uniform rainfall, and the benefits of controlled water supply for crop yield. Various irrigation systems are explained, including flow and lift irrigation, along with the relationship between soil, water, and plants, emphasizing ideal soil conditions for optimal water retention and extraction. Additionally, it provides numerous problem sets related to calculating field capacity, available moisture, and irrigation water requirements based on soil characteristics.