Download to read offline
![International Research Journal of Engineering and Technology (IRJET) e-ISSN: 2395-0056
Volume: 05 Issue: 06 | June 2018 www.irjet.net p-ISSN: 2395-0072
© 2018, IRJET | Impact Factor value: 6.171 | ISO 9001:2008 Certified Journal | Page 244
7. CONCLUSION:
Long Term ST Database with Manually corrected beat
annotations with sampling frequency of 250 Hz (row 9 in
table 1).
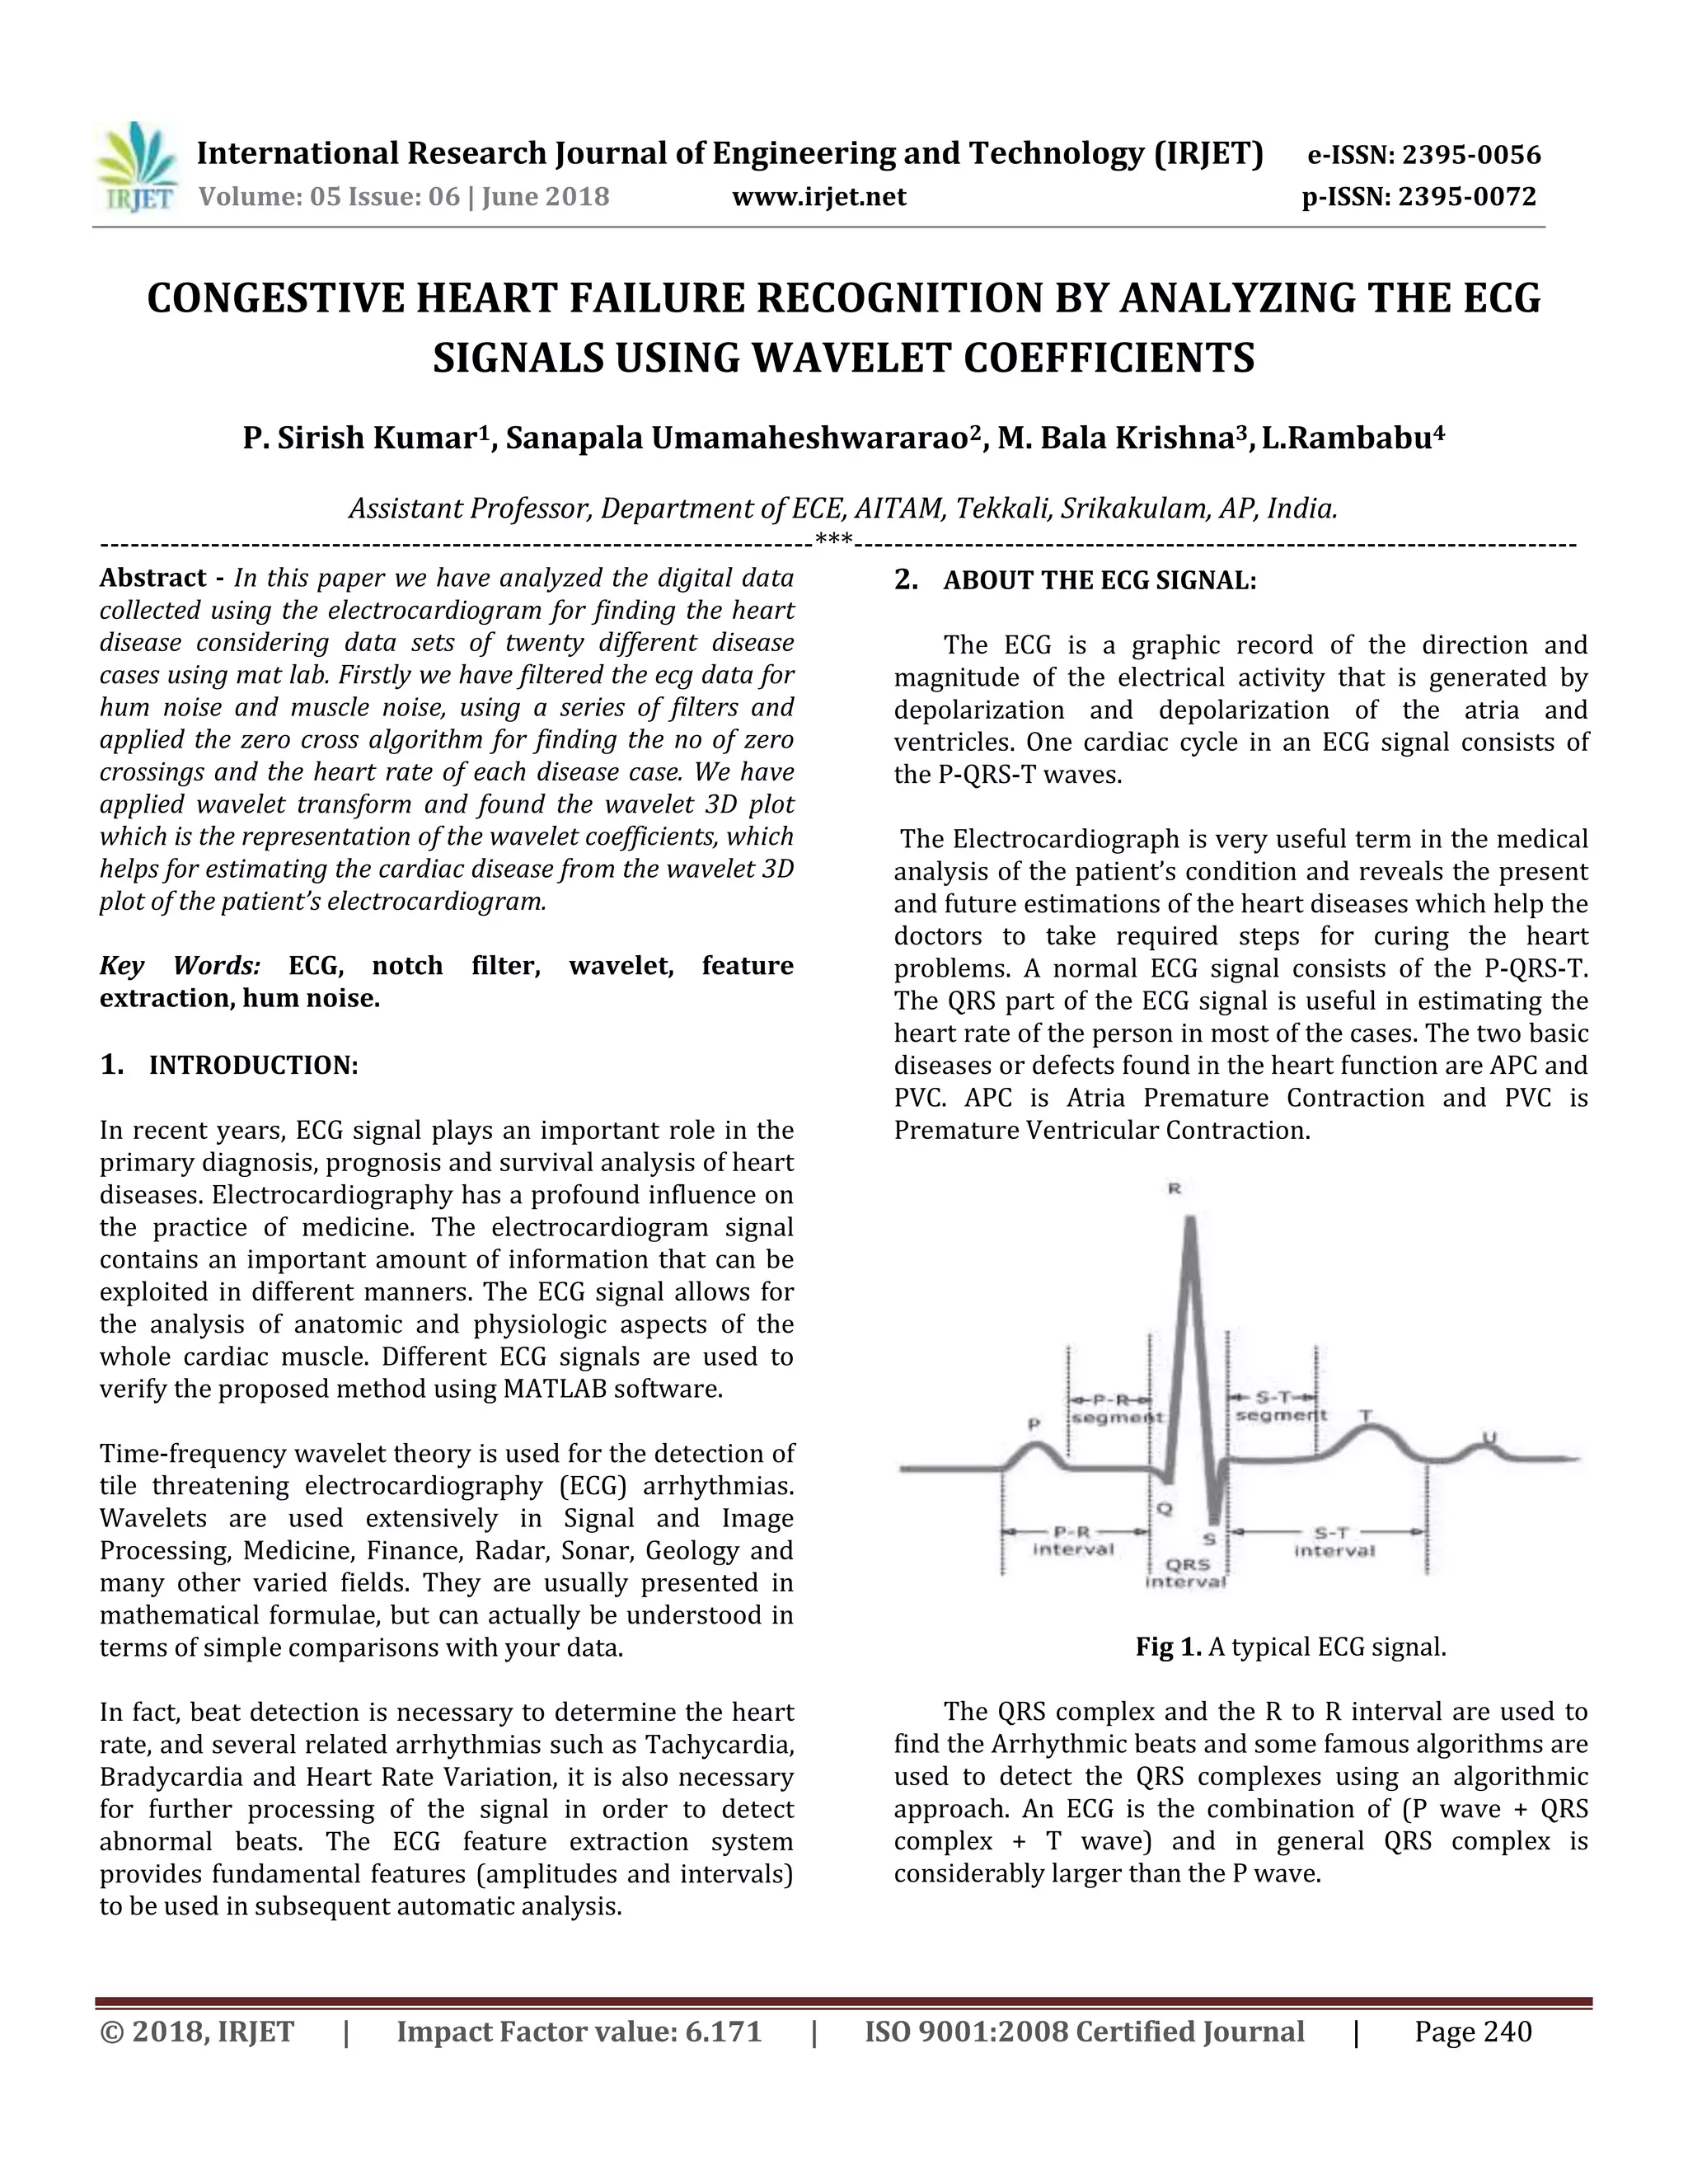
Fig7. Actual ECG signal
Fig8. ECG signal filtered for hum noise and muscle noise.
Fig9. Wavelet 3D plot for the above ECG.
Output of the Algorithm:
1) No of Zero Crossings = 14.
2) Heart Rate in (Beats/Min) = 17.
We conclude that the above implementation helps for
the detailed analysis of the biomedical data for finding the
diseases and severity.
7. REFERENCES:
[1] Juan Pablo Martínez, Rute Almeida, Salvador Olmos,
Ana Paula Rocha, and Pablo Laguna, A Wavelet-Based ECG
Delineator: Evaluation on Standard Databases, IEEE
[2] Digital Signal Processing Fundamentals by Li Tan
Copyright 2008.
[3] Thakor N.V, Webster, J.G. and Tompkins W.J.
1984.Estimation of QRS complex power spectra for design
of QRS filter, IEEE Trans. Biomed. Eng. 31: 702-706.
[4] Karel J.M.H., Peeters R.L.M., Westra R.L., Moermans
K.M.S., Haddad S.A.P. and Serdijn W.A. 2005.Optimal
discrete wavelet design for cardiac signal processing,
Proceedings of the IEEE, Engineering in Medicine and
Biology 27th Annual Conference.
[5] Soman K.P., Ramachandran K.I. 2004. Insight into
wavelets from theory to practice. Prentice-Hall of India.
[6] Cuiwei Li, Chongxun Zheng, and Changfeng Tai.1995.
Detection of ECG characteristic points using wavelet
transforms.IEEETrans. Biomed. Eng. 42(1):21-28, January.
[7] MiniMed website:
http://www.minimed.com/doctors/md_products_cgms_o
v_completepic.shtml](https://image.slidesharecdn.com/irjet-v5i651-180717065804/75/IRJET-Congestive-Heart-Failure-Recognition-by-Analyzing-The-ECG-Signals-using-Wavelet-Coefficients-5-2048.jpg)

This document summarizes a study that analyzed ECG signals to recognize congestive heart failure using wavelet coefficients. ECG data from 20 different disease cases were collected and filtered to remove noise. A wavelet transform was applied to obtain wavelet coefficients, which were used to estimate cardiac diseases from the 3D wavelet plot. The zero crossing algorithm was also used to calculate heart rate from the number of zero crossings in the ECG signal. Results found that wavelet coefficients and 3D plots provided useful information for analyzing ECG signals and recognizing different heart conditions and diseases.