This paper presents a new method for real-time QRS complex detection in ECG signals using wavelet transform and a Savitzky-Golay filter for denoising. The proposed algorithm achieved high sensitivity of 99.97% and positive predictivity of 99.99% over 109,092 heartbeats tested from the MIT-BIH Arrhythmia Database. The method effectively addresses challenges in detecting ECG signals affected by noise and various arrhythmias, enhancing reliability in cardiac diagnostics.
![International Journal of Electrical and Computer Engineering (IJECE)
Vol. 8, No. 5, October 2018, pp. 2857~2863
ISSN: 2088-8708, DOI: 10.11591/ijece.v8i5.pp2857-2863 2857
Journal homepage: http://iaescore.com/journals/index.php/IJECE
Detection of Real Time QRS Complex Using Wavelet
Transform
Fatima Yasmeen1
, M. A Mallick2
, Y. U. Khan3
1,2
Department of Electrical Engineering, Integral University, India
3
Department of Electrical Engineering, Aligarh Muslim University, India
Article Info ABSTRACT
Article history:
Received Dec 21, 2017
Revised Apr 13, 2018
Accepted May 8, 2018
This paper presents a novel method for QRS detection. To accomplish this
task ECG signal was first filtered by using a third order Savitzky Golay filter.
The filtered ECG signal was then preprocessed by a Wavelet based denoising
in a real-time fashion to minimize the undefined noise level. R-peak was then
detected from denoised signal after wavelet denoising. Windowing
mechanism was also applied for finding any missing R-peaks. All the 48
records have been used to test the proposed method. During this testing,
99.97% sensitivity and 99.99% positive predictivity is obtained for QRS
complex detection.
Keyword:
Electrocardiogram
QRS complex
RR interval
Wavelet transform
Copyright © 2018 Institute of Advanced Engineering and Science.
All rights reserved.
Corresponding Author:
Fatima Yasmeen,
Department of Electrical Engineering,
Integral University, Lucknow, India.
Email: has.fys@gmail.com
1. INTRODUCTION
Globally, various studies based on the incidence of cardiac failure are being conducted and
according to an estimate one person dies every 33 seconds in India due to heart attack. The situation is quite
alarming as the incidence of this disease is way high in India as compared to the developed nations.
According to a study, an average Indian has to be on alert as the failure of the cardiac system is now more
commonly observed in youngsters; and the figures show that more than two million heart attack cases are
reported in a year [1].
The recording of bioelectrical activities of the cardiac system is known as the electrocardiogram
(ECG) signals. It is an important source of information about the functional aspects of heart and
cardiovascular system [2]-[6]. Timely detection of cardiovascular abnormalities and heart diseases not only
reduces mortality rate but also increases life span with appropriate medication and recommended precautions.
In this regard, various studies have been performed on the ECG signals [2]-[9]. The pattern of ECG and heart
rate variability signal is indeed an important diagnostic parameter. However, as ECG monitoring is a lengthy
and time consuming task, this increases the chances of error creeping in during data collection. Thus, in order
to maximise the accuracy of analysis and further classification of the disease, a computerized approach is
much more helpful in diagnostics. In conventional methods, monitoring and diagnosing electrocardiographic
variation for appearance of specific signals depends on the reliability of human observation. Though this may
be reliable when less number of samples are analysed, but for analysis of large number of patients in Cardiac
Intensive Care Units (CICU) and Coronary Care units (CCU) of hospitals, this method would be inconsistent
as conditions in such cases are critical and a thorough and minute observation is needed continuously.
Therefore, there is an urgent need to develop a more reliable computerised method to detect
electrocardiographic changes. A reliable and specific quantitative signal feature classification problem is](https://image.slidesharecdn.com/v25910421dec1713apr18editlia-201117082413/75/Detection-of-Real-Time-QRS-Complex-Using-Wavelet-Transform-1-2048.jpg)
![ ISSN: 2088-8708
Int J Elec & Comp Eng, Vol. 8, No. 5, October 2018 : 2857 - 2863
2858
obtained through such automated techniques by transforming mostly qualitative diagnostic criteria. In some
approach, the analysis of the ECG signals for detection of electrocardiographic changes is performed by
using the autocorrelation function, principal component analysis, frequency domain features, time frequency
analysis and empirical mode decomposition techniques [2]-[11]. In fact no matter how appropriate results are
obtained by adopting such automatic techniques, there is a restriction with limited amount of information on
electrocardiographic signal feature because of limitation of the underlying nonlinear signal dynamics [10]. In
the recent past, considerable growth has been seen in application of nonlinear domain analysis and chaos
theory in exploring the behaviour of a dynamical system from ECG signals in an experimental time series
[10]-[16]. To remove the interference without deteriorating the original signal is not an easy task due to
nonlinear signal dynamics. This can be overcome by using the modified variational mode decomposition and
power line interference is removed satisfactorily [17]. The system performance for diagnosis of coronary
heart disease was improved by using hybrid system of tiered multivariate analysis and artificial neural
network and achieved an accuracy of 86.3% [18]. Still processing of ECG signal needs a lot of improvement,
most of all accurate detection of QRS complex. In this research paper, a novel computing method has been
devised based on windowing mechanism to verify peak position combined with wavelet based de-noising for
real time QRS detection.
2. METHODOLOGY
In this work R-peak has been detected from MIT BIH Arrhythmia data base. To carry out this task,
raw ECG is first filtered by using third order Savitzky golay filter and then pre-processed by a wavelet based
denoising in a real-time fashion to minimize the undefined noise level. R-peak is then detected from denoised
signal after wavelet denoising. Windowing mechanism is also applied for finding the missing R-peaks if
there is any. Descriptive data detailing of the above discussed signal processing stages are mentioned in
following sections.
2.1. Database Description
The database of MIT-BIH Arrhythmia is incorporated in this work for the analysis of ECG signal.
Beth Israel Hospital Arrhythmia Laboratory obtained a set of over 4000 long-term Holter recordings in the
era of 1975 and 1979. To obtain these recordings, mainly the inpatients were analysed. There are 23 records
in this database (ranges from 100 to 124 inclusive with some missing numbers data) chosen arbitrarily from
this set, and 25 records (ranges from 200 to 234 inclusive, again with some numbers missing) selected from
the same set to include a variety of rare but clinically important phenomena that would not be well-
represented by a small random sample of Holter recordings. Each of the 48 records is slightly over 30
minutes long.
The first group is intended to serve as a representative sample of the variety of waveforms and
artefact that an arrhythmia detector might encounter in routine clinical use. An arbitrary numbers were used
for tapes selection, and then to select them for a segment of half-hour. If neither of the two ECG signals were
of adequate quality for analysis by manual expertise are excluded in this approach.
The second group had chosen the records to include complicated supraventricular, junctional and
ventricular arrhythmias and major abnormalities in conduction. Mostly, these records were selected because
of QRS morphology variation, rhythm features or quality of signal might be expected to present difficulty to
arrhythmia detectors in a significant manner; and considerable notoriety have recorded by database analyser.
The study was conducted on 25 men aged 32 to 89 years, and 22 women aged 23 to 89 years. (Records 201
and 202 obtained from the same male subject).
2.2. ECG Lead Configuration
The electrodes are to be placed on chest for getting the upper signal which is a modified limb lead II
(MLII). While a modified lead V1 (occasionally V2 or V5, and in one instance V4); in lower signals. In this
case also, the electrodes are placed on the chest. BIH Arrhythmia Laboratory is using this configuration on
regular basis. In the upper signals indications are generally prominent when QRS complex is normal. Mean
cardiac electrical axis and the lead axis may be nearly orthogonal for the lower signal, however (i.e., normal
beats are usually biphasic and may be nearly isoelectric). Thus ectopic beats are more illustrious in the lower
signal, whereas normal beats are frequently difficult to perceive (see, for example, record 106).Reversed
signals in record 114 making it a peculiar case for arrhythmia detectors as it often occurs in clinical practice.
So arrhythmia analysers should be prepared to deal with such records. Modified lead V5 was used for the
upper signal in records 102 and 104, as there was surgical dressings on the patients in these records so it was
not advisable to use modified lead II [19].](https://image.slidesharecdn.com/v25910421dec1713apr18editlia-201117082413/75/Detection-of-Real-Time-QRS-Complex-Using-Wavelet-Transform-2-2048.jpg)
![Int J Elec & Comp Eng ISSN: 2088-8708
Detection of Real Time QRS Complex Using Wavelet Transform (Fatima Yasmeen)
2859
2.3. Wavelet Based Denoising Stage
Along with the actual cardiac activity electrocardiogram signals are also comprised of several noise
sources such as power-line interference, motion artifacts and baseline drifts. Initially, an appropriate signal
pre-processing procedure for noise reduction is required for enhancement of QRS detection rate [20]. In this
regard one of the most famous and common approach applied for this purpose is band pass filtering. But
sometimes bandpass filtering could demolish intense features in electrocardiogram signal such as QRS
complexes. For this reason researchers adopted wavelet based methods for biomedical signal processing.
Temporal characteristics of a biomedical signal can be represented by unique components in frequency
domain in wavelet transforms. Since wavelet transform based technique can also be used for signal
denoising. In this preview of using application, a new method was developed by Donoho and johnstone
which was named as wavelet shrinkage to denoise the signal with unknown noise characteristics while the
intense features of the signal can be well maintained [21]. Since the QRS complex is an impulse-like
waveform, however postulation might be possible in applying wavelet de-noising technique at the
preprocessing stage for its viability and accuracy to the following stage of QRS detection.
We have also discussed in brief about procedure of de-noising scheme in our project. First of all
ECG signal is filtered using a third order savitzky golay filter. These smoothing filters (also called digital
smoothing polynomial filters or least-squares smoothing filters) are categorically used to "smooth out" a
noisy signal where frequency span of signal (without noise) is large. The performance of Savitzky-Golay
smoothing filters are far better than standard averaging FIR filters in such type of applications, which tend to
filter out a remarkable portion of the signal's high frequency content along with the noise [22]
B=sgolay (k,f,w)
Equation specifies a weighting vector w with length f, which contains the real, positive-valued weights to be
used during the least-squares minimization. Then, a Haar wavelet transform was performed with four-level
decomposition in the measured ECG signal that has been filtered by Savitzky Golay filter. The Haar
wavelet's mother wavelet function can be described as
Ѱ(t) = 1 0 ≤ t ≤
1
2
,
= -1
1
2
≤ t ≤ 1,
= 0 otherwise,
Scaling function of Haar Wavelet can be described as
Φ(t) = 1 0 ≤ t ≤ 1,
= 0 otherwise.
2.4. R-Peak Detection
After denoising stage, the denoised signal is taken for R-peak detection and then
detected R-peaks verified by considering three peaks window at a time. In window, the
amplitude of second peak has been compared with other 2 peaks if its amplitude is less
than 25%, ignore the considered peak. If R2 ≥ 25% of R1 or R3, then R2 is considered as
peak where R2 is the middle peak of the window, R1 and R3 are peaks on either side of the
window.
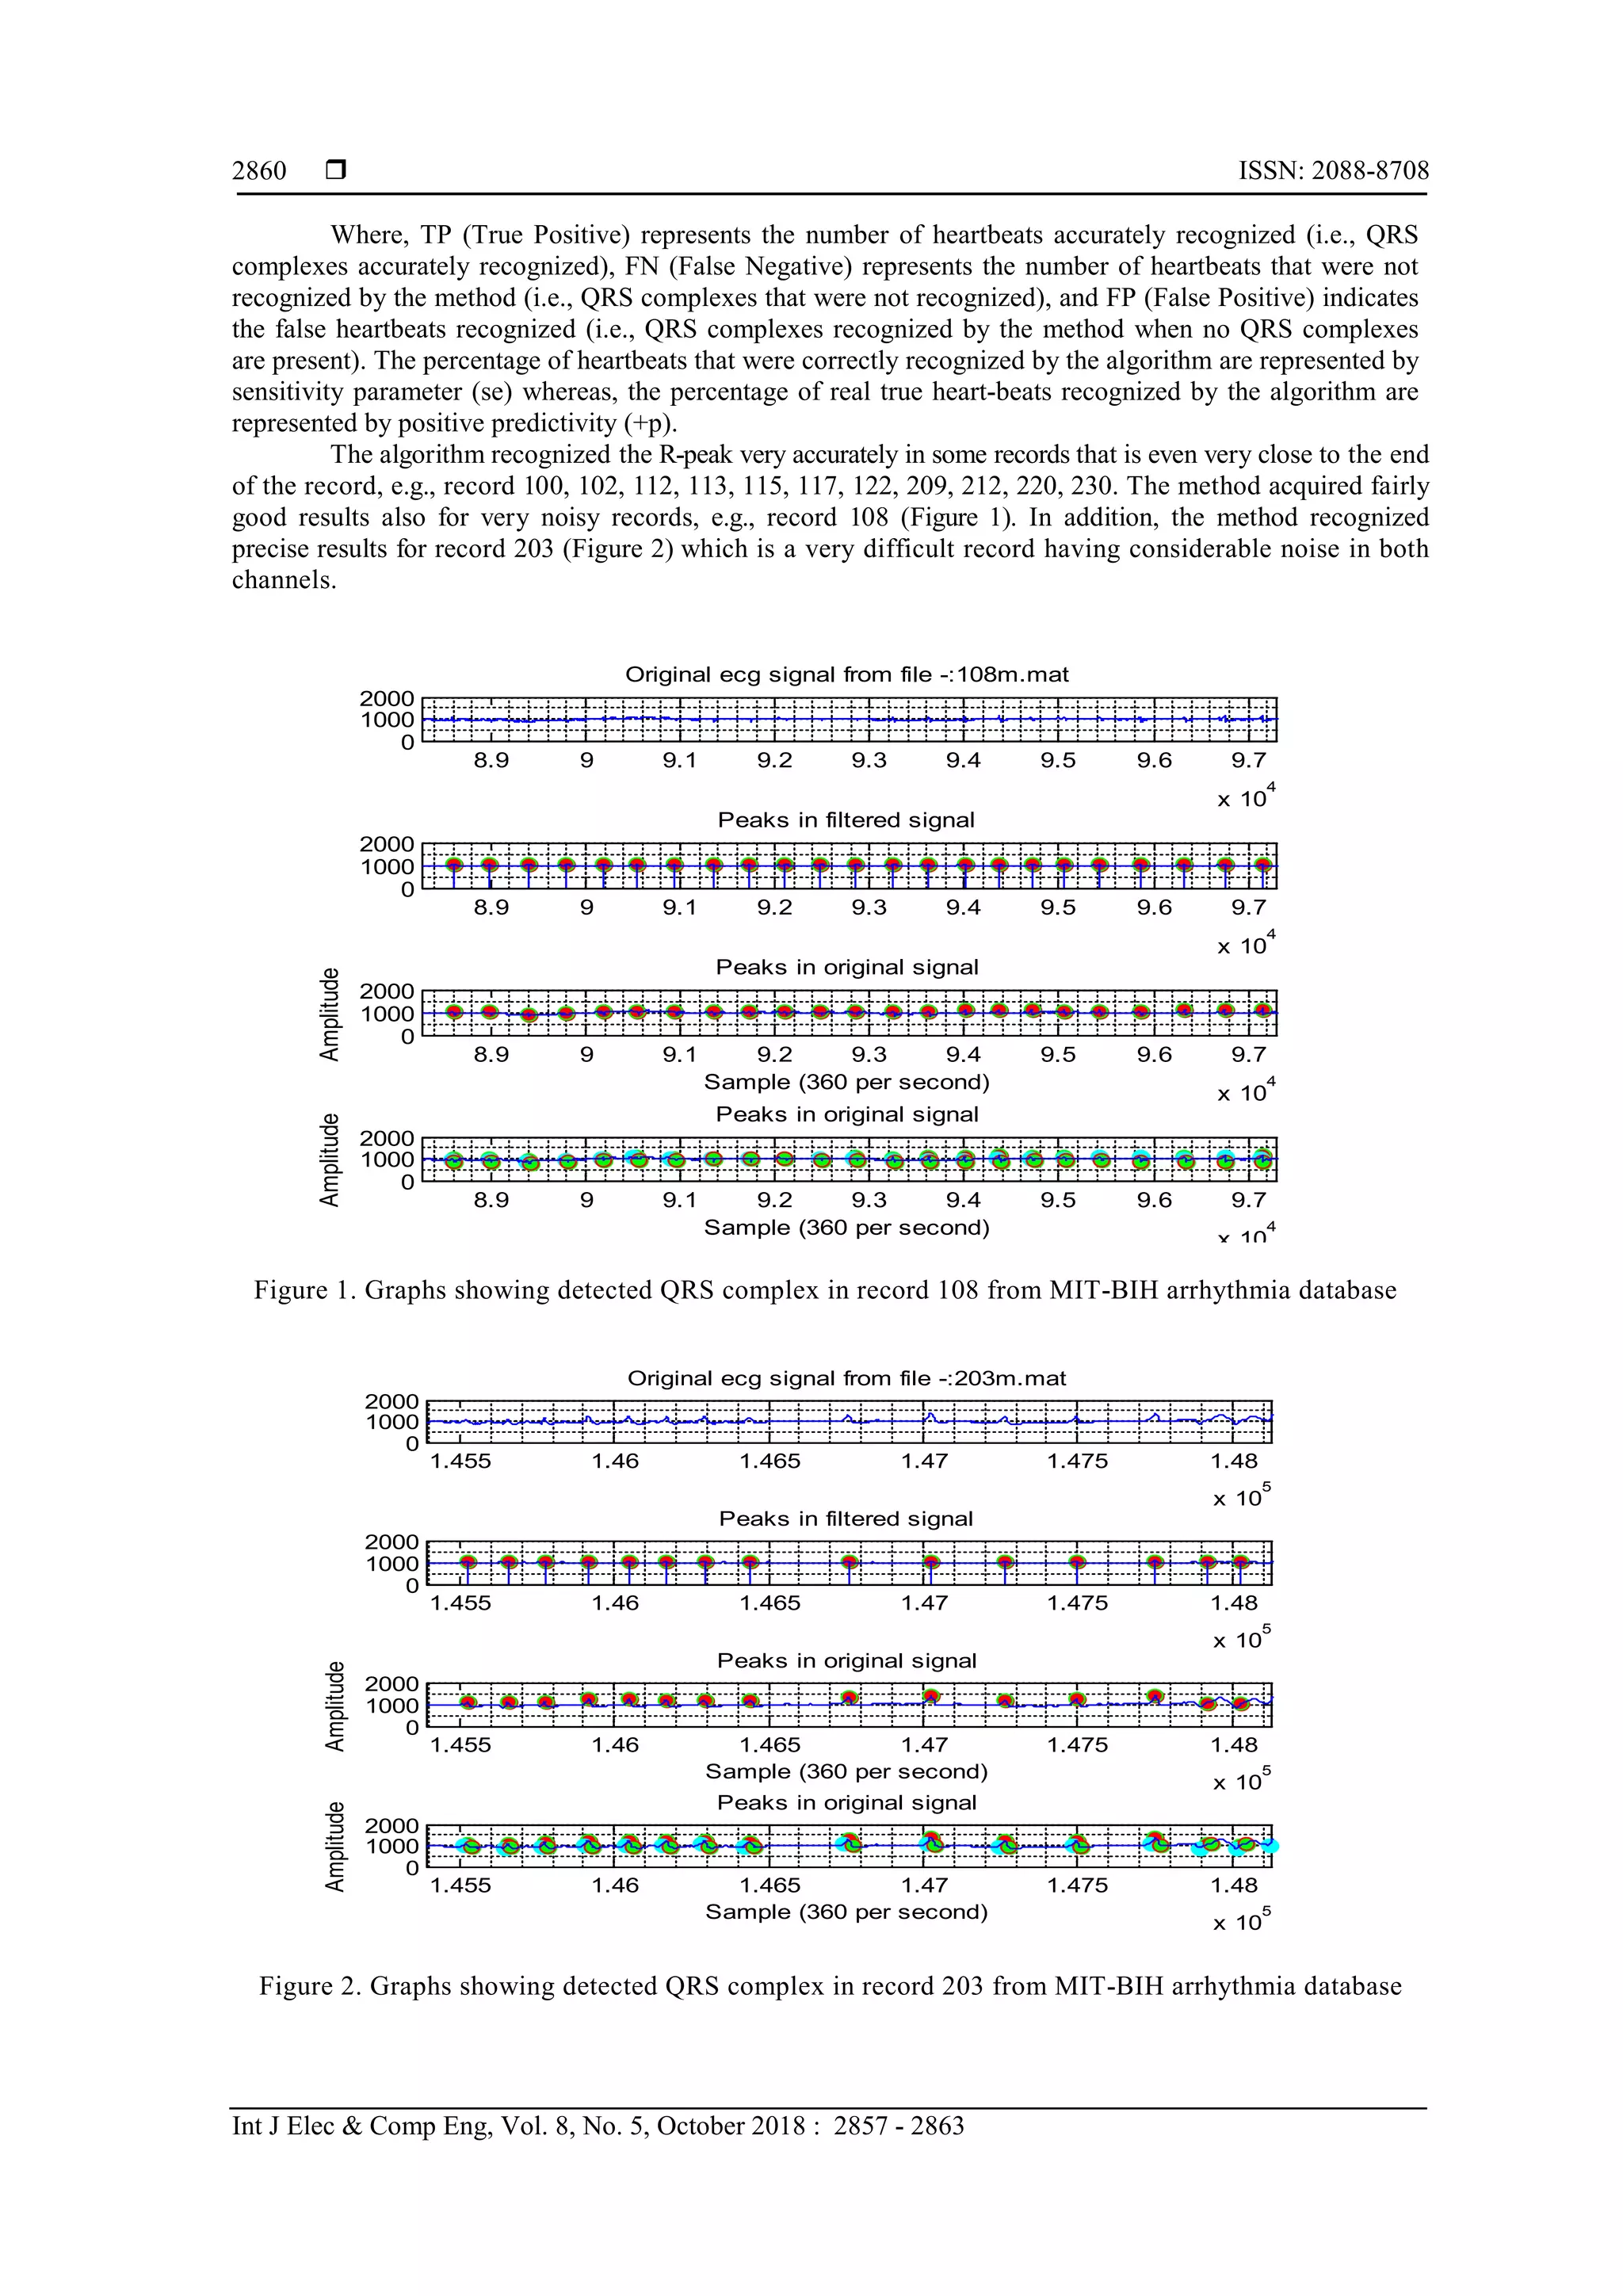
3. RESULTS AND DISCUSSION
The proposed algorithm was tested on MIT BIH arrhythmia database using MATLAB codes. The
sampling frequency of each recording in the database is fs = 360 Hz, with 11-bit resolution over 5 mV range.
The duration of each record is 30 min with 5.556s. Only the first channel of all 48 records has been
considered for QRS detection. These records contain inverted QRS polarity, low amplitude QRS, ventricular
ectopic beats with low SNR, premature ventricular beats, and premature atrial beats etc. The actual
performance of the proposed algorithm has been evaluated by adopting two parameters: Sensitivity (Se), and
positive predictivity (+P), given below.
Se (%)=
𝑇𝑃
𝑇𝑃+𝐹𝑁
× 100
+P (%)=
𝑇𝑃
𝑇𝑃+𝐹𝑃
× 100](https://image.slidesharecdn.com/v25910421dec1713apr18editlia-201117082413/75/Detection-of-Real-Time-QRS-Complex-Using-Wavelet-Transform-3-2048.jpg)
![ ISSN: 2088-8708
Int J Elec & Comp Eng, Vol. 8, No. 5, October 2018 : 2857 - 2863
2862
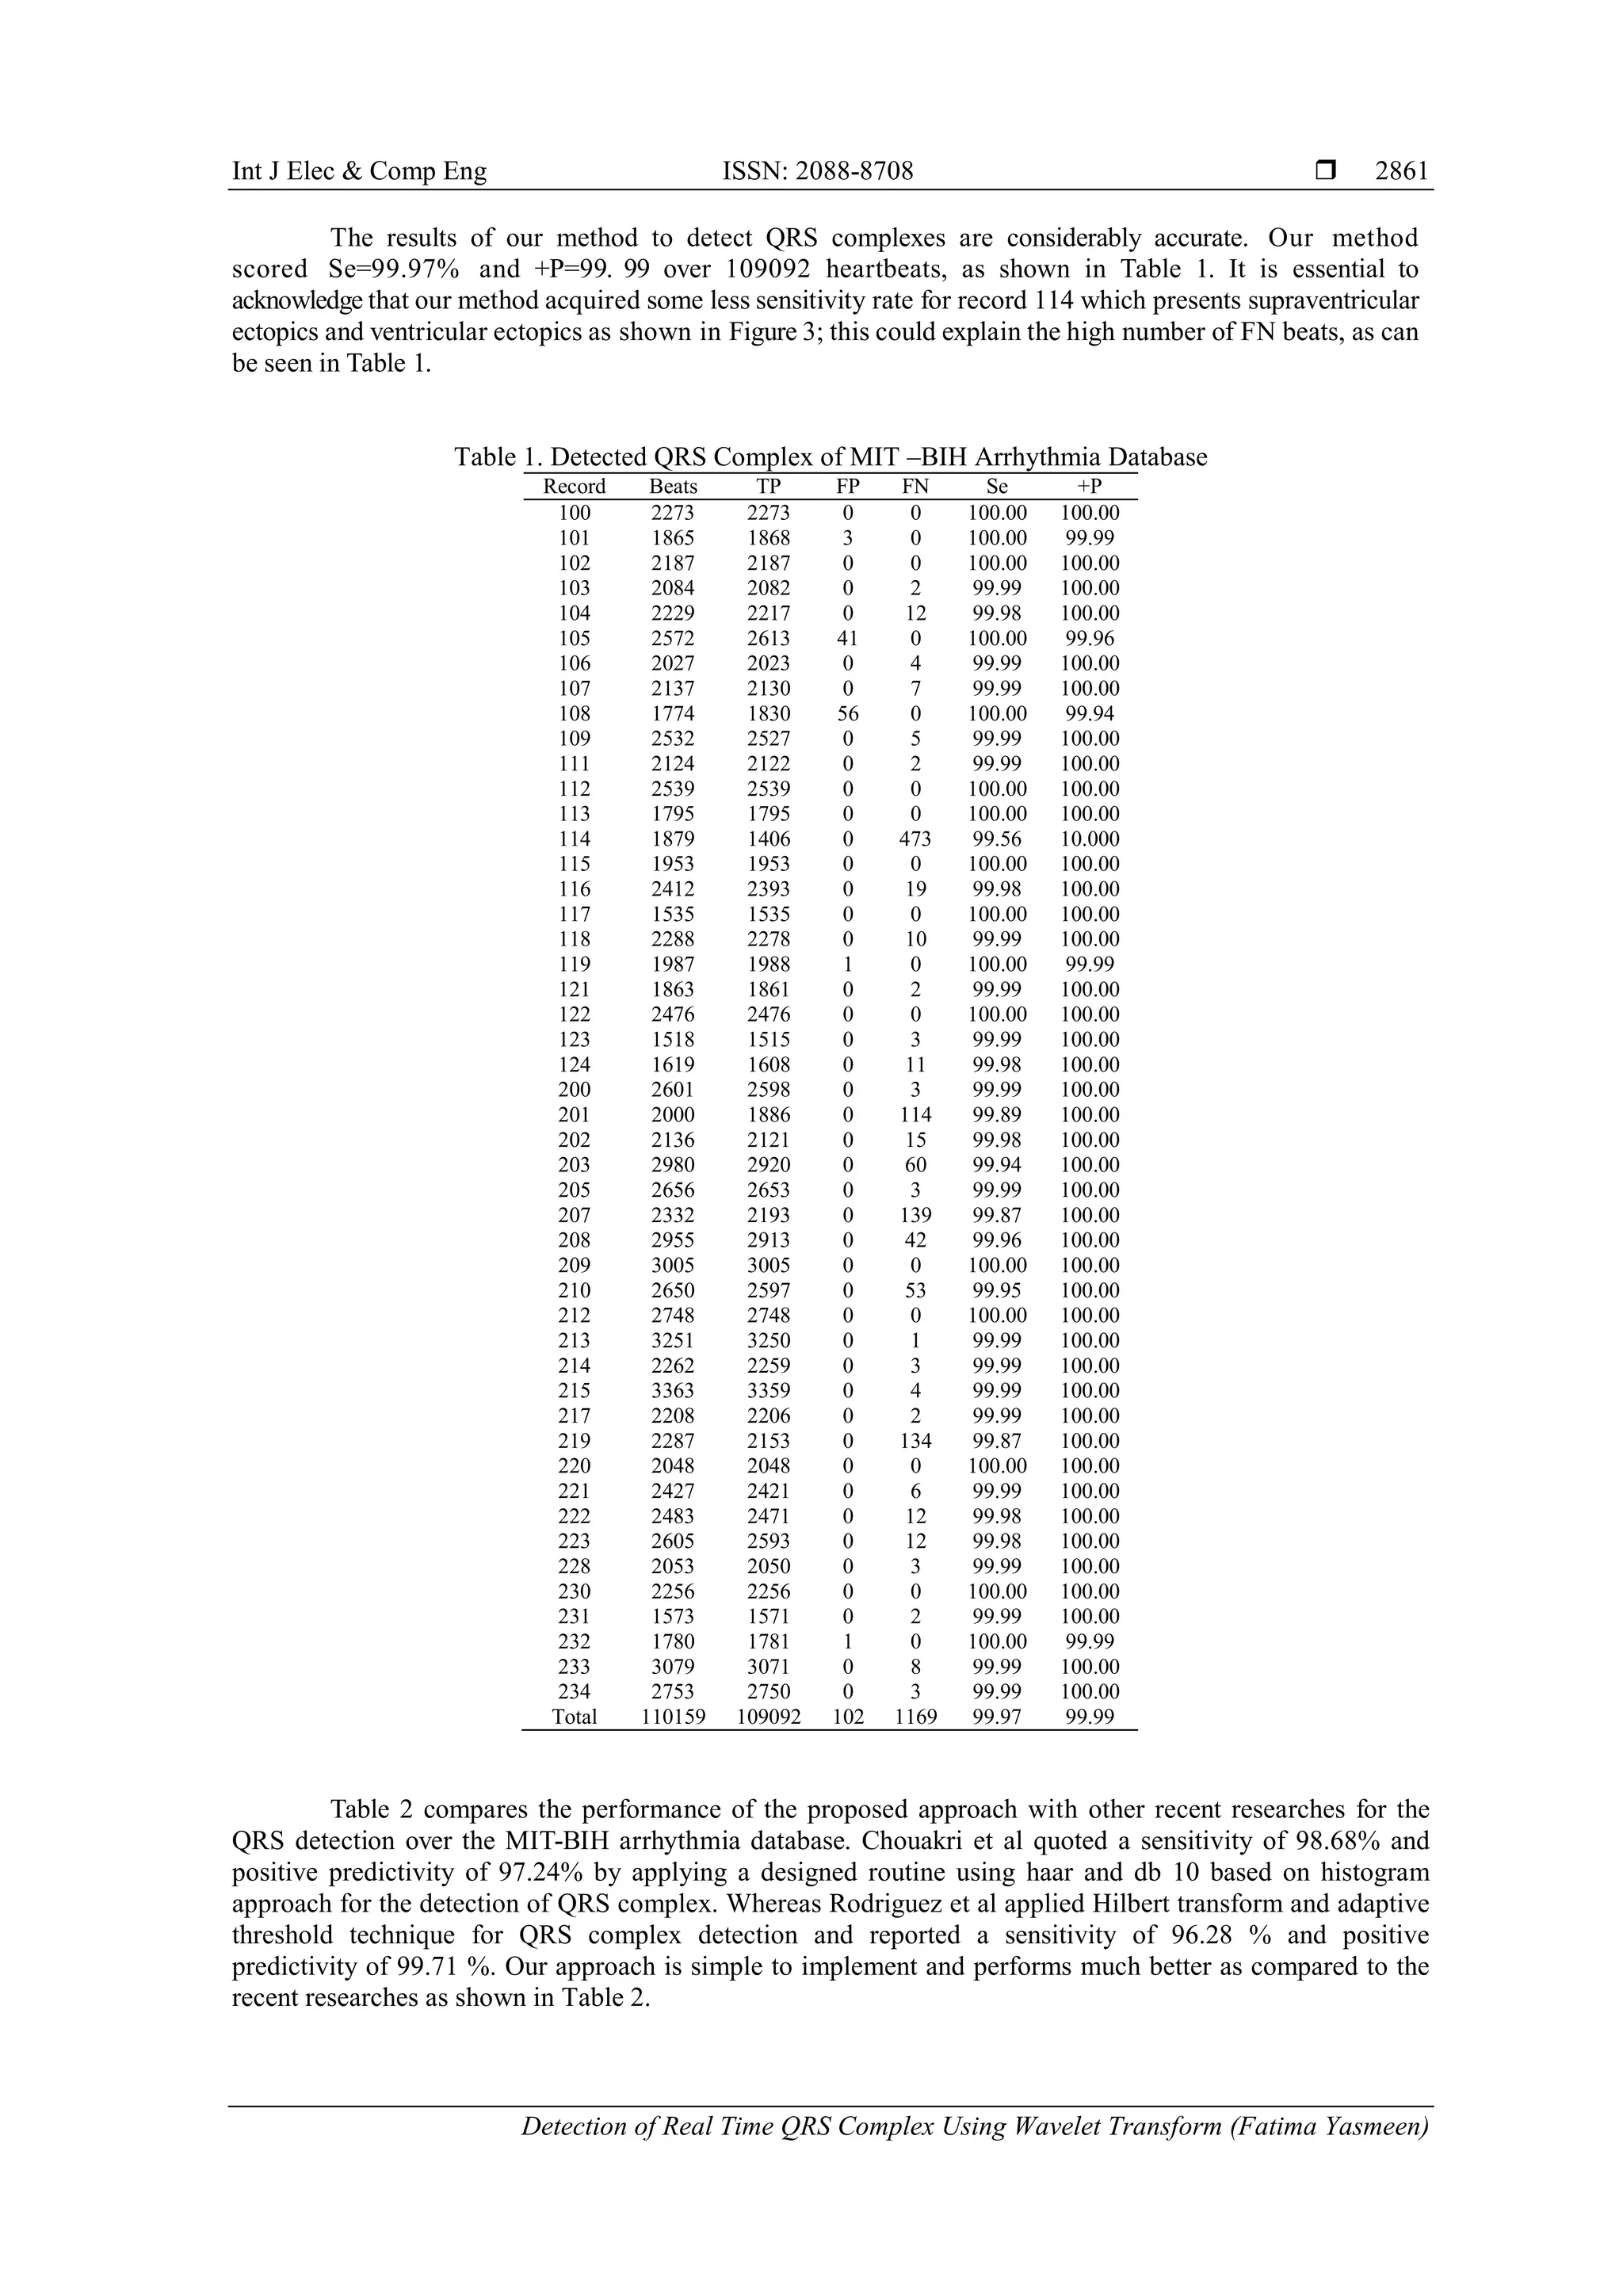
Figure 3. Graphs showing detected QRS Complex in record 114from MIT-BIH arrhythmia database
Table 2. Comparison of QRS Detection Performance on MIT-BIH Arrhythmia Database
Work Peaks Se(%) +P (%)
Proposed
Rodriguez et al (2015)
Chouakri et al (2011)
109,092
44,715
109,488
99.97
96.28
98.68
99.99
99.71
97.24
4. CONCLUSION
This paper has presented a novel approach for QRS detection of electrocardiogram signals by
applying the wavelet transform and windowing technique. Our approach improves the accuracy of QRS
Complexes detection in records with different types of arrhythmias like Ventricular ectopics,
Supraventricular ectopics, negative QRS Polarities, low signal to noise ratio etc. Our proposed approach
achieves precise detection rates with an overall positive predictivity of 99.99% and a sensitivity of 99.97%.
ACKNOWLEDGEMENT
The authors are thankful to Integral University for providing the infrastructure and manuscript
communication number (IU/R&D/2017-MCN000155) for this study. The authors are also thankful to Aligarh
Muslim University.
REFERENCES
[1] A. Mehta, senior consultant cardiologist at Sir Ganga Ram Hospital, 2009.
[2] S. C. Saxena, et al., “Feature extraction from ECG signals using wavelet transforms for disease diagnostics,”
International Journal of Systems Science, vol/issue: 33(13), pp. 1073-1085, 2002.
[3] S. A. Chouakri, et al., “QRS complex detection based on multi wavelet packet decomposition,” Applied
Mathematics and Computation, vol. 217, pp. 9508-9525, 2011.
[4] S. Y. Foo, et al., “Neural network-based EKG pattern recognition,” Engineering Applications of Artificial
Intelligence, vol. 15, pp. 253-260, 2002.
[5] R. Rodriguez, et al., “Feature Extraction of Electrocardiogram Signalsby applying adaptive threshold and principal
component analysis,” Journal of Applied Research and Technology, vol. 13, pp. 261-269, 2015.
[6] N. Maglaveras, et al., “ECG pattern recognition and classification using non linear transformations and neural
networks:a review,” International Journal of Medical Informatics, vol. 52, pp. 191-208, 1998.
[7] M. Kundu, et al., “Knowledge-based ECG interpretation: a critical review,” Pattern Recognition, vol. 33, pp. 351-
373, 2000.
[8] K. Sternickel, “Automatic pattern recognition in ECG time series,” Computer Methods and Programs in
Biomedicine, vol. 68, pp. 109-115, 2002.
0 1 2 3 4 5 6 7
10
5
0
1000
2000
Original ecg signal from file -:114m.mat
0 1 2 3 4 5 6 7
10
5
0
1000
2000
Peaks in filtered signal
0 1 2 3 4 5 6 7
Sample (360 per second) 10
5
0
1000
2000
Amplitude
Peaks in original signal
0 1 2 3 4 5 6 7
Sample (360 per second) 10
5
0
1000
2000
Amplitude
QRS Complex in original signal](https://image.slidesharecdn.com/v25910421dec1713apr18editlia-201117082413/75/Detection-of-Real-Time-QRS-Complex-Using-Wavelet-Transform-6-2048.jpg)
![Int J Elec & Comp Eng ISSN: 2088-8708
Detection of Real Time QRS Complex Using Wavelet Transform (Fatima Yasmeen)
2863
[9] E. D. Übeyli, “Detection of electrocardiogram beats using a fuzzy similarity index,” Expert Systems, vol/issue:
24(2), pp. 87-96, 2007.
[10] E. D. Übeyli, “Usage of eigenvector methods in implementation of automated diagnostic systems for ECG beats,”
Digital Signal Processing, vol/issue: 18(1), pp. 33-48, 2008.
[11] Fatima, et al., “Data Driven Approach for R-Peak Detection in Electrocardiogram (ECG) Signal,” International
journal of advance Electrical and Electronics Engineering, pp. 2278-8948, 2015.
[12] M. I. Owis, et al., “Study of features based on nonlinear dynamical modeling in ECG arrhythmia detection and
classification,” IEEE Transactions on Biomedical Engineering, vol/issue: 49(7), pp. 733-736, 2002.
[13] J. Fell, et al., “Nonlinear analysis of continuous ECG during sleep II. Dynamical measures,” Biological
Cybernetics, vol. 82, pp. 485-491, 2000.
[14] R. B. Govindan, et al., “On the evidence of deterministic chaos in ECG: surrogate and predictability analysis,”
Chaos, vol/issue: 8(2), pp. 495-502, 1998.
[15] R. Silipo, et al., “Dynamics extraction in multivariate biomedical time series,” Biological Cybernetics, vol. 79, pp.
15-27, 1998.
[16] A. Casaleggio and S. Braiotta, “Estimation of Lyapunov exponents of ECG time series—the influence of
parameters,” Chaos, Solitons & Fractals, vol/issue: 8(10), pp. 1591-1599, 1997.
[17] N. Mohan, “Modified Variational Mode Decomposition For Power Line Interference Removal in ECG Signals,”
IJECE, vol/issue: 6(1), 2016.
[18] Wiharto, et al., “Hybrid System of Tiered Multivariate Analysis and Artificial Neural Network for Coronary Heart
Disease Diagnosis,” IJECE, vol/issue: 7(2), 2017.
[19] www.physionet.org
[20] S. W. Chen, et al., “A real-time QRS detection method based on moving-averaging incorporating with wavelet
denoising,” computer methods and programs in Biomedicine, vol. 82, pp. 187-195, 2006.
[21] D. L. Donoho and I. M. Johnstone, “Ideal spatial adaptation via wavelet shrinkage,” Biometrika, pp. 425-455, 1994.
[22] S. J. Orfanidis, “Introduction to Signal Processing,” Prentice-Hall, Englewood Cliffs, NJ, 1996.](https://image.slidesharecdn.com/v25910421dec1713apr18editlia-201117082413/75/Detection-of-Real-Time-QRS-Complex-Using-Wavelet-Transform-7-2048.jpg)