
Recommended
More Related Content
Similar to satatistics Presentation.pptx
Similar to satatistics Presentation.pptx (20)
Recently uploaded
Recently uploaded (20)
satatistics Presentation.pptx
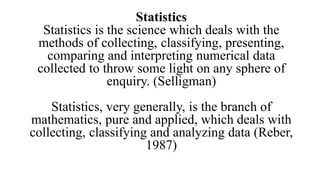
- 1. Statistics Statistics is the science which deals with the methods of collecting, classifying, presenting, comparing and interpreting numerical data collected to throw some light on any sphere of enquiry. (Selligman) Statistics, very generally, is the branch of mathematics, pure and applied, which deals with collecting, classifying and analyzing data (Reber, 1987)
- 2. Type of Statistics On the basis of function On the basis of data distribution
- 3. On the basis of function 1. Descriptive statistic (Mean, Median, Mode, SD, range, Frequency) 2. Correlation Statistics 3. Inferential statistics
- 4. On the basis of data distribution 1. Parametric statistics 2. Non- parametric statistics Population: The term population and universe mean all the members of any well defined class of people , events or objects(Kerlinger 1986) Sample: Sample is a part of population selected (usually according to some procedure and some purpose in mind) such that it is considered to be representation of the population as a whole.
- 5. Parametric statistics: • Normal distribution • Independence of samples • Arithmetic operation • Method of random sampling • Size of sample • Interval data (Mean, t- test, F test ,Standard deviation pearson correlation)
- 6. Non parametric statistics • Distribution free • Unbiased observation • Sample size • Ordinal data, Nominal data (chi square, Mann Whitney U-test, Spearman’s Rank difference method of correlation, Two way ANOVA etc.)
- 7. • Definition of Skewness The term ‘skewness’ is used to mean the absence of symmetry from the mean of the dataset. It is characteristic of the deviation from the mean, to be greater on one side than the other, i.e. attribute of the distribution having one tail heavier than the other. Skewness is used to indicate the shape of the distribution of data. In a skewed distribution, the curve is extended to either left or right side. So, when the plot is extended towards the right side more, it denotes positive skewness, wherein mode < median < mean. On the other hand, when the plot is stretched more towards the left direction, then it is called as negative skewness and so, mean < median < mode.
- 8. • Definition of Kurtosis In statistics, kurtosis is defined as the parameter of relative sharpness of the peak of the probability distribution curve. It ascertains the way observations are clustered around the centre of the distribution. It is used to indicate the flatness or peakedness of the frequency distribution curve and measures the tails or outliers of the distribution. Positive kurtosis represents that the distribution is more peaked than the normal distribution, whereas negative kurtosis shows that the distribution is less peaked than the normal distribution. There are three types of distributions: • Leptokurtic: Sharply peaked with fat tails, and less variable. • Mesokurtic: Medium peaked • Platykurtic: Flattest peak and highly dispersed.
- 9. Significant of the difference between means: t- test t-test is a statistical test that is used to compare the means of two groups. It is often used in hypothesis testing to determine whether a process or treatment actually has an effect on the population of interest, or whether two groups are different from one another. When to use a t-test A t-test can only be used when comparing the means of two groups (a.k.a. pairwise comparison). If you want to compare more than two groups, or if you want to do multiple pair wise comparisons, use an ANOVA test or a post-hoc test. The t-test is a parametric test of difference, meaning that it makes the same assumptions about your data as other parametric tests. The t-test assumes your data: • are independent • are (approximately) normally distributed. • have a similar amount of variance within each group being compared (a.k.a. homogeneity of variance) • If your data do not fit these assumptions, you can try a nonparametric alternative to the t-test, such as the Wilcoxon Signed-Rank test for data with unequal variances.
- 10. 1 – One-Sample T-Test While performing this test, the mean or average of one group is compared against the set average, which is either the theoretical value or means of the population. For example, a teacher wishes to figure out the average height of the students of class 5 and compare the same against a set value of more than 45 kgs. The teacher first randomly selects a group of students and records individual weights to achieve this. Next, she finds out the mean weight for that group and checks if it meets the standard set value of 45+. The formula used to obtain one-sample t-test results is: • Where, • T = t-statistic • m = mean of the group • = theoretical mean value of the population • s = standard deviation of the group • n = sample size
- 11. • 2 – Independent Two-Sample T-Test This is the test conducted when samples from two different groups, species, or populations are studied and compared. It is also known as an independent T-test. For example, if a teacher wants to compare the height of male students and female students in class 5, she would use the independent two-sample test. The T-test formula used to calculate this is: Where, • mA – mB = means of samples from two different groups or populations • nA – nB = respective sample sizes • s2 = standard deviation or common variance of two samples
- 12. • 3 – Paired Sample T-Test This hypothesis testing is conducted when two groups belong to the same population or group. The groups are studied either at two different times or under two varied conditions. The formula used to obtain the t-value is: Where, • T = t-statistic • m = mean of the group • = theoretical mean value of the population • s = standard deviation of the group • n = sample size
- 13. Correlation: Correlation means association - more precisely it is a measure of the extent to which two variables are related. There are three possible results of a correlational study: a positive correlation, a negative correlation, and no correlation. A scattergraph indicates the strength and direction of the correlation between the co- variables
- 14. Some uses of Correlations Prediction • If there is a relationship between two variables, we can make predictions about one from another. Validity • Concurrent validity (correlation between a new measure and an established measure). Reliability • Test-retest reliability (are measures consistent). • Inter-rater reliability (are observers consistent). • Theory verification • Predictive validity
- 15. Correlation Coefficients: Determining Correlation Strength Instead of drawing a scattergram a correlation can be expressed numerically as a coefficient, ranging from -1 to +1. When working with continuous variables, the correlation coefficient to use is Pearson’s r.
- 16. 1.The product moment correlation coefficient 2. The Rank difference correlation method 3. The Biserial correlation method 4. The point Biserial correlation method 5. The Tetrachoric correlation method 6. The Phi- coefficient method 7. The coefficient of contingency method 8. The partial correlation method 9. The multiple correlation method