Download as PDF, PPTX


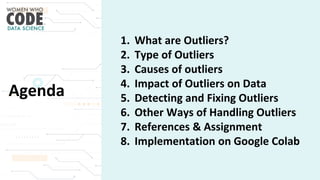

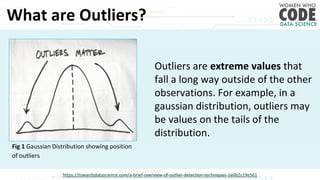


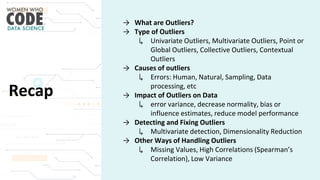
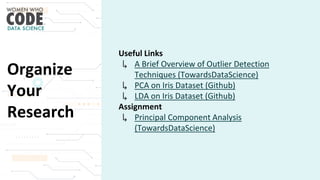


The document outlines a presentation on outliers, defining them as extreme values that deviate significantly from the main data points. It discusses types of outliers, their causes, their impact on data analysis, and methods for detection and handling, including visualization and dimensionality reduction techniques like PCA and LDA. Additionally, it emphasizes the importance of addressing outliers to maintain the integrity of statistical analyses and model performance.