Downloaded 379 times


![34
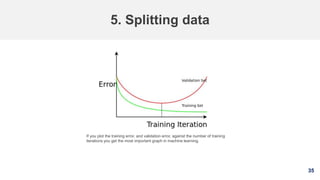
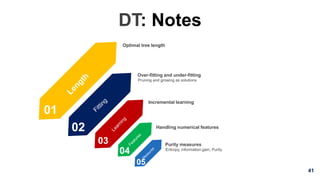
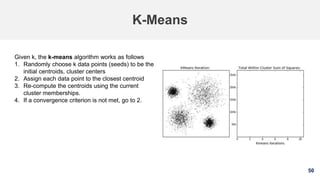
5. Splitting data
Training set: A set of examples used for learning, that is to fit
the parameters [i.e., weights] of the classifier.
Validation set: A set of examples used to avoid overfitting or
tune the hyperparameters [i.e., architecture, not weights] of a
classifier, for example to choose the number of hidden units in
a neural network.
Test set: A set of examples used only to assess the
performance [generalization] of a fully specified classifier.](https://image.slidesharecdn.com/machinelearning-191005133446/85/Machine-Learning-A-Fast-Review-34-320.jpg)
![42
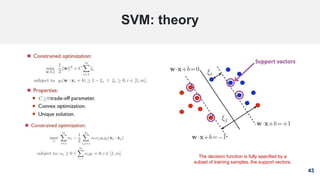
SVM: the story
This line represents
the decision
boundary:
ax + by − c = 0
Lots of possible solutions for a, b, c.
• Some methods find a separating hyper plane, but
not the optimal one [according to some criterion of
expected goodness].
• SVM (A.k.a. large margin classifier) maximizes the
margin around the separating hyperplane.
• Solving SVMs is a quadratic programming problem](https://image.slidesharecdn.com/machinelearning-191005133446/85/Machine-Learning-A-Fast-Review-42-320.jpg)

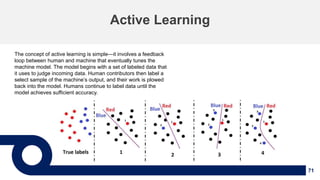
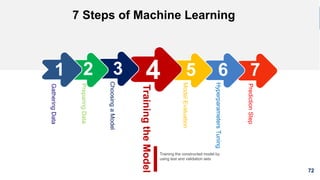
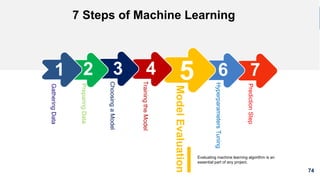
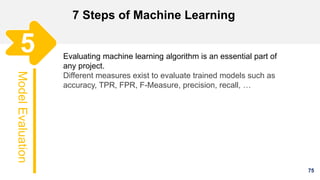
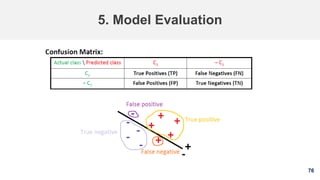
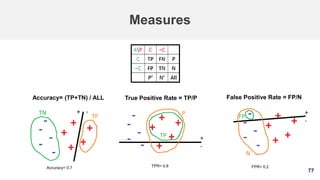
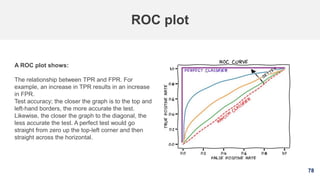

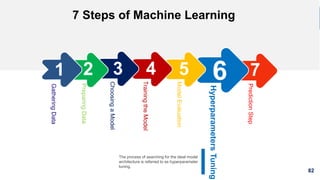
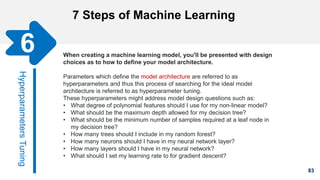
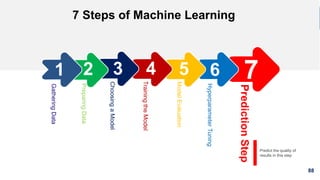
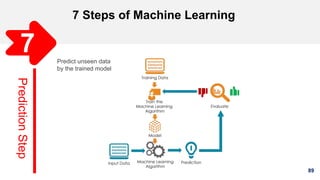


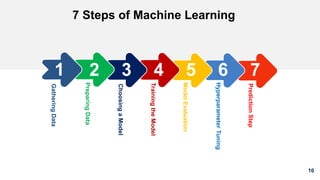
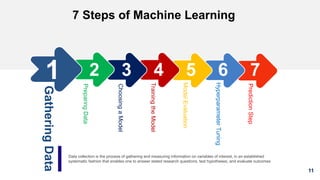
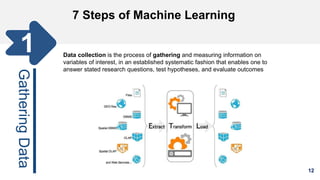
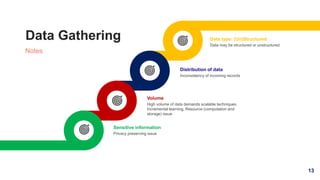
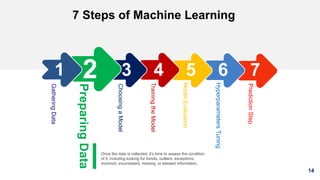
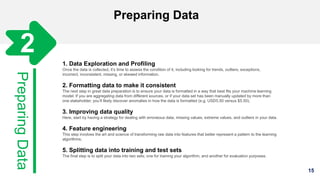
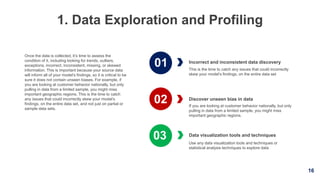
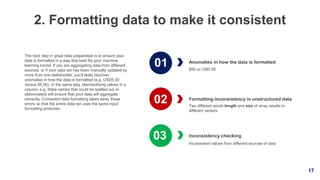
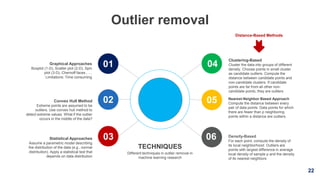
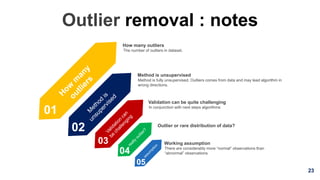
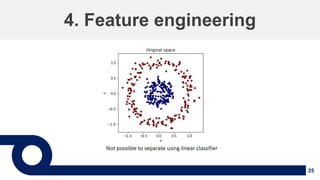
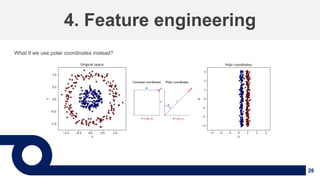
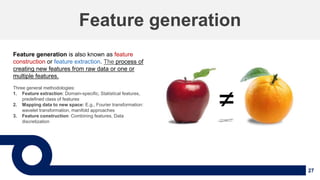
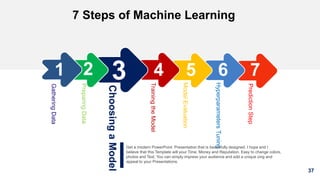
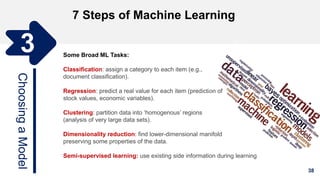
1. The document discusses machine learning and provides an overview of the seven steps of machine learning including gathering data, preparing data, choosing a model, training the model, evaluating the model, tuning hyperparameters, and making predictions. 2. It describes tips for data preparation such as exploring data for trends and issues, formatting data consistently, and handling missing values, outliers, and imbalanced data. 3. Techniques for outlier removal are discussed including clustering-based, nearest-neighbor based, density-based, graphical, and statistical approaches. Limitations and challenges of outlier removal are noted.


![[DSC Europe 25] Gordana Milutinovic Dumbelovic - From Insight to Oversight: A...](https://cdn.slidesharecdn.com/ss_thumbnails/t7dkjsfxqwwzceropjv4-gordana-milutinovicdumbelovic-from-insight-to-oversight-ai-driven-power-bi-moni-260119121559-9e0bf11b-thumbnail.jpg?width=640&height=640&fit=bounds)
![[DSC Europe 25] Paula Garcia Esteban -Building the Future: The Role of Data S...](https://cdn.slidesharecdn.com/ss_thumbnails/9ld1r1bsqpwve8qfvphy-paula-garcia-esteban-building-the-future-260122103838-4171f5cb-thumbnail.jpg?width=640&height=640&fit=bounds)
![[DSC Europe 25] Andrzej Kowalczyk - AI - how to start small and grow in the f...](https://cdn.slidesharecdn.com/ss_thumbnails/oy1zmo94qv6vpcqjvno2-andrzej-kowalczyk-ai-how-to-start-small-and-grow-in-the-future-1-260119121559-cf093b23-thumbnail.jpg?width=640&height=640&fit=bounds)

![[DSC Europe 25] Tali Fulman - Guild Meetings, Then What? Building Data Commun...](https://cdn.slidesharecdn.com/ss_thumbnails/fgohhi33rwmhqdowdj5k-tali-fulman-guild-meetings-then-what-building-data-communities-that-actually-ch-260120105855-528492c3-thumbnail.jpg?width=640&height=640&fit=bounds)
![[DSC Europe 25] Harshvardhan Jain - From Pre-Trained to Purpose-Built: Fine-T...](https://cdn.slidesharecdn.com/ss_thumbnails/zru4zmiseku5tgvu2dgw-harshvardhan-jain-from-pre-trained-to-purpose-built-fine-tuning-llms-for-high-i-260119101520-8335585f-thumbnail.jpg?width=640&height=640&fit=bounds)

![[DSC Europe 25] Josip Saban - Career building for data professionals.pptx](https://cdn.slidesharecdn.com/ss_thumbnails/zroflcttkm1vmli0txea-josip-saban-career-building-for-data-professionals-260123083019-587cdb8c-thumbnail.jpg?width=640&height=640&fit=bounds)

![[DSC Europe 25] Milovan Jovicic - Beyond AI's Reach: The Enduring Value of Ev...](https://cdn.slidesharecdn.com/ss_thumbnails/pyeij0hurgwq5jugmtnv-2-milovan-jovicic-beyond-ais-reach-the-enduring-value-of-evergreen-design-v2-260120105856-d6ee57e5-thumbnail.jpg?width=640&height=640&fit=bounds)


![[DSC Europe 25] Bojan Djuricic - Predictive Design Process.pdf](https://cdn.slidesharecdn.com/ss_thumbnails/5awdrbedqdek3gqu2ezy-4-the-predictive-design-bojan-djuricic-260120105856-6c399e9b-thumbnail.jpg?width=640&height=640&fit=bounds)
![[DSC Europe 25] Jovan Sumarac - Real-World Applications of Computer Vision in...](https://cdn.slidesharecdn.com/ss_thumbnails/fiksms22smcpopvvld03-jovan-sumarac-real-life-applications-of-computer-vision-in-automotive-systems-260120105855-de622abb-thumbnail.jpg?width=640&height=640&fit=bounds)


