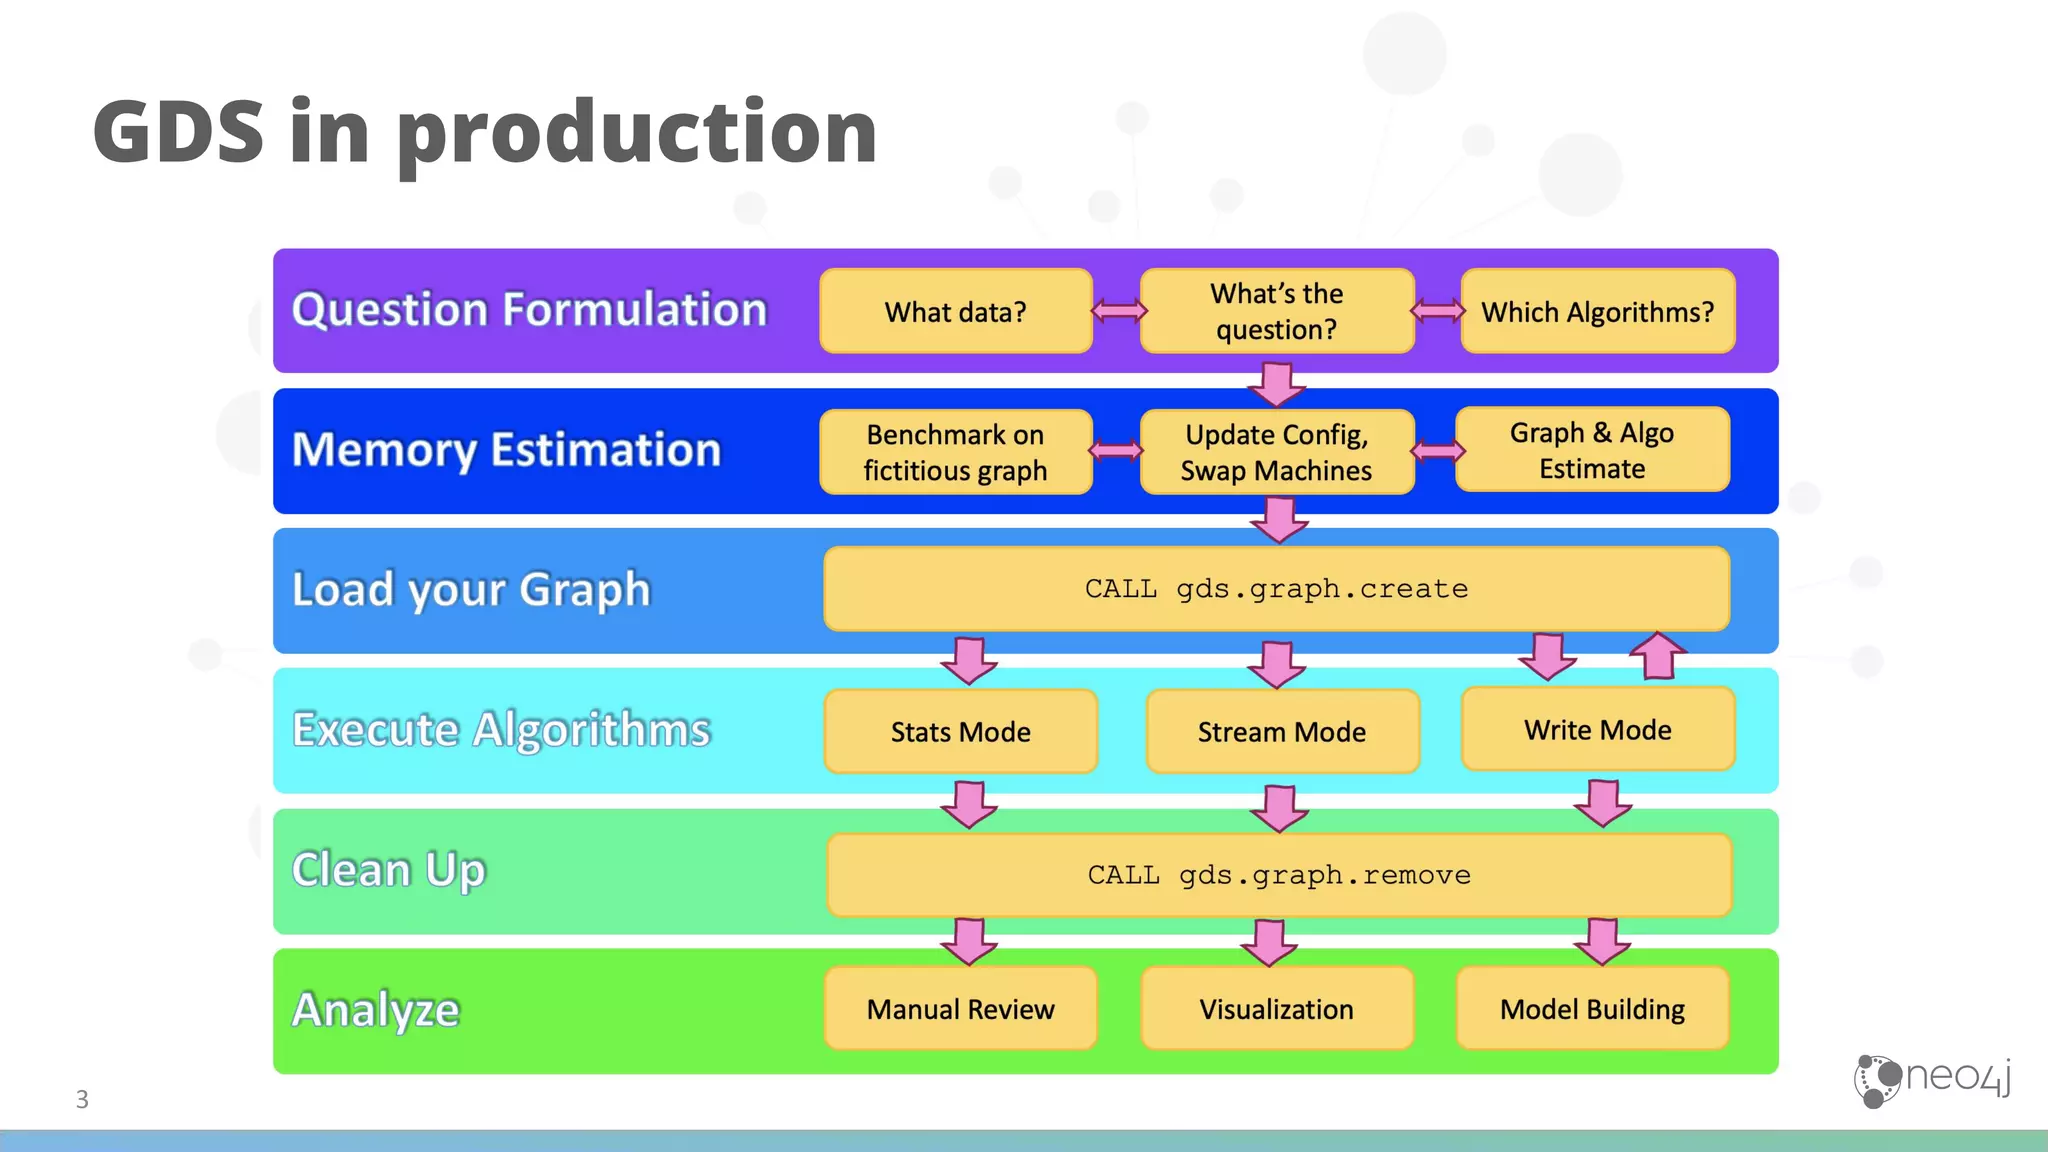
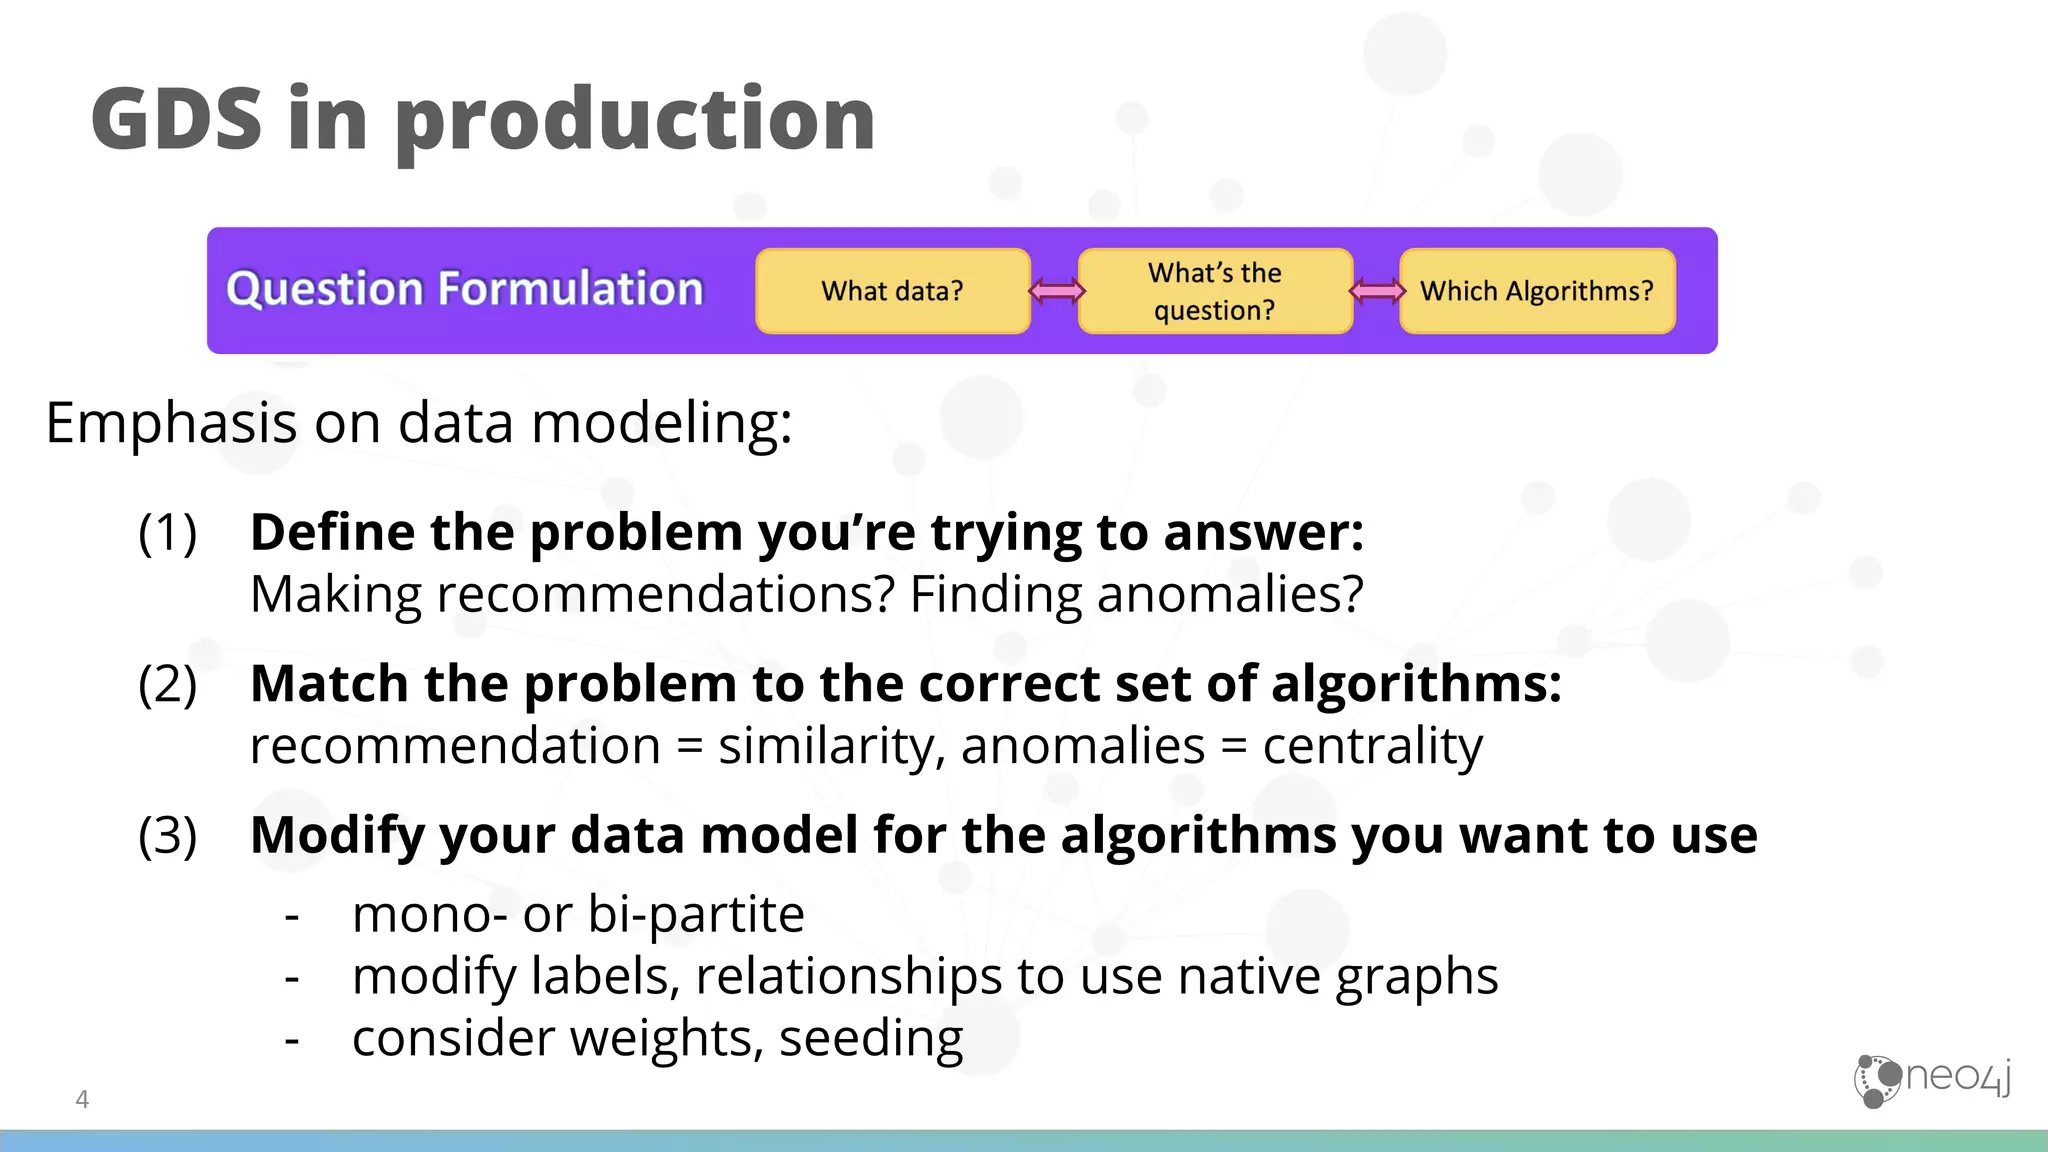
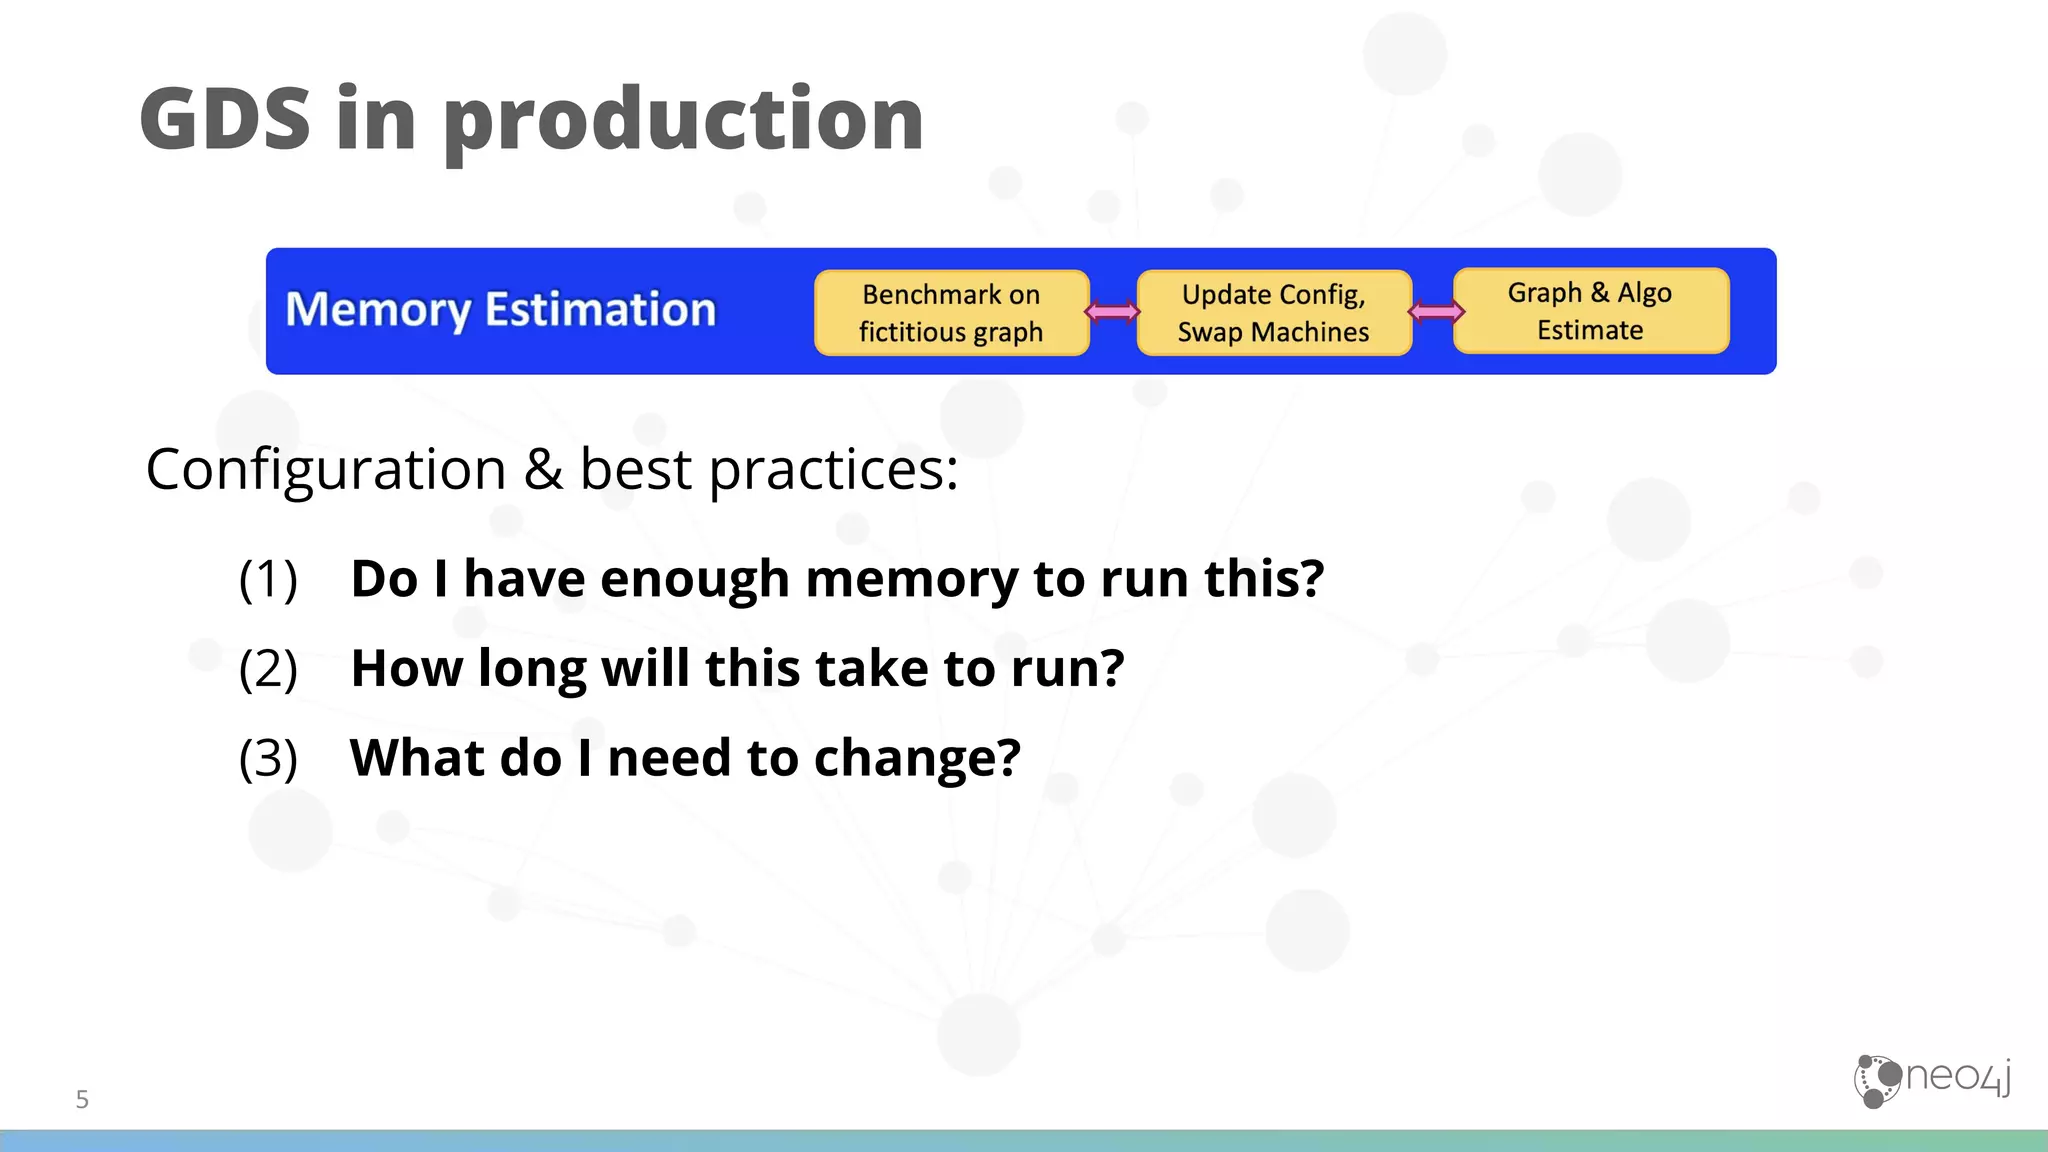
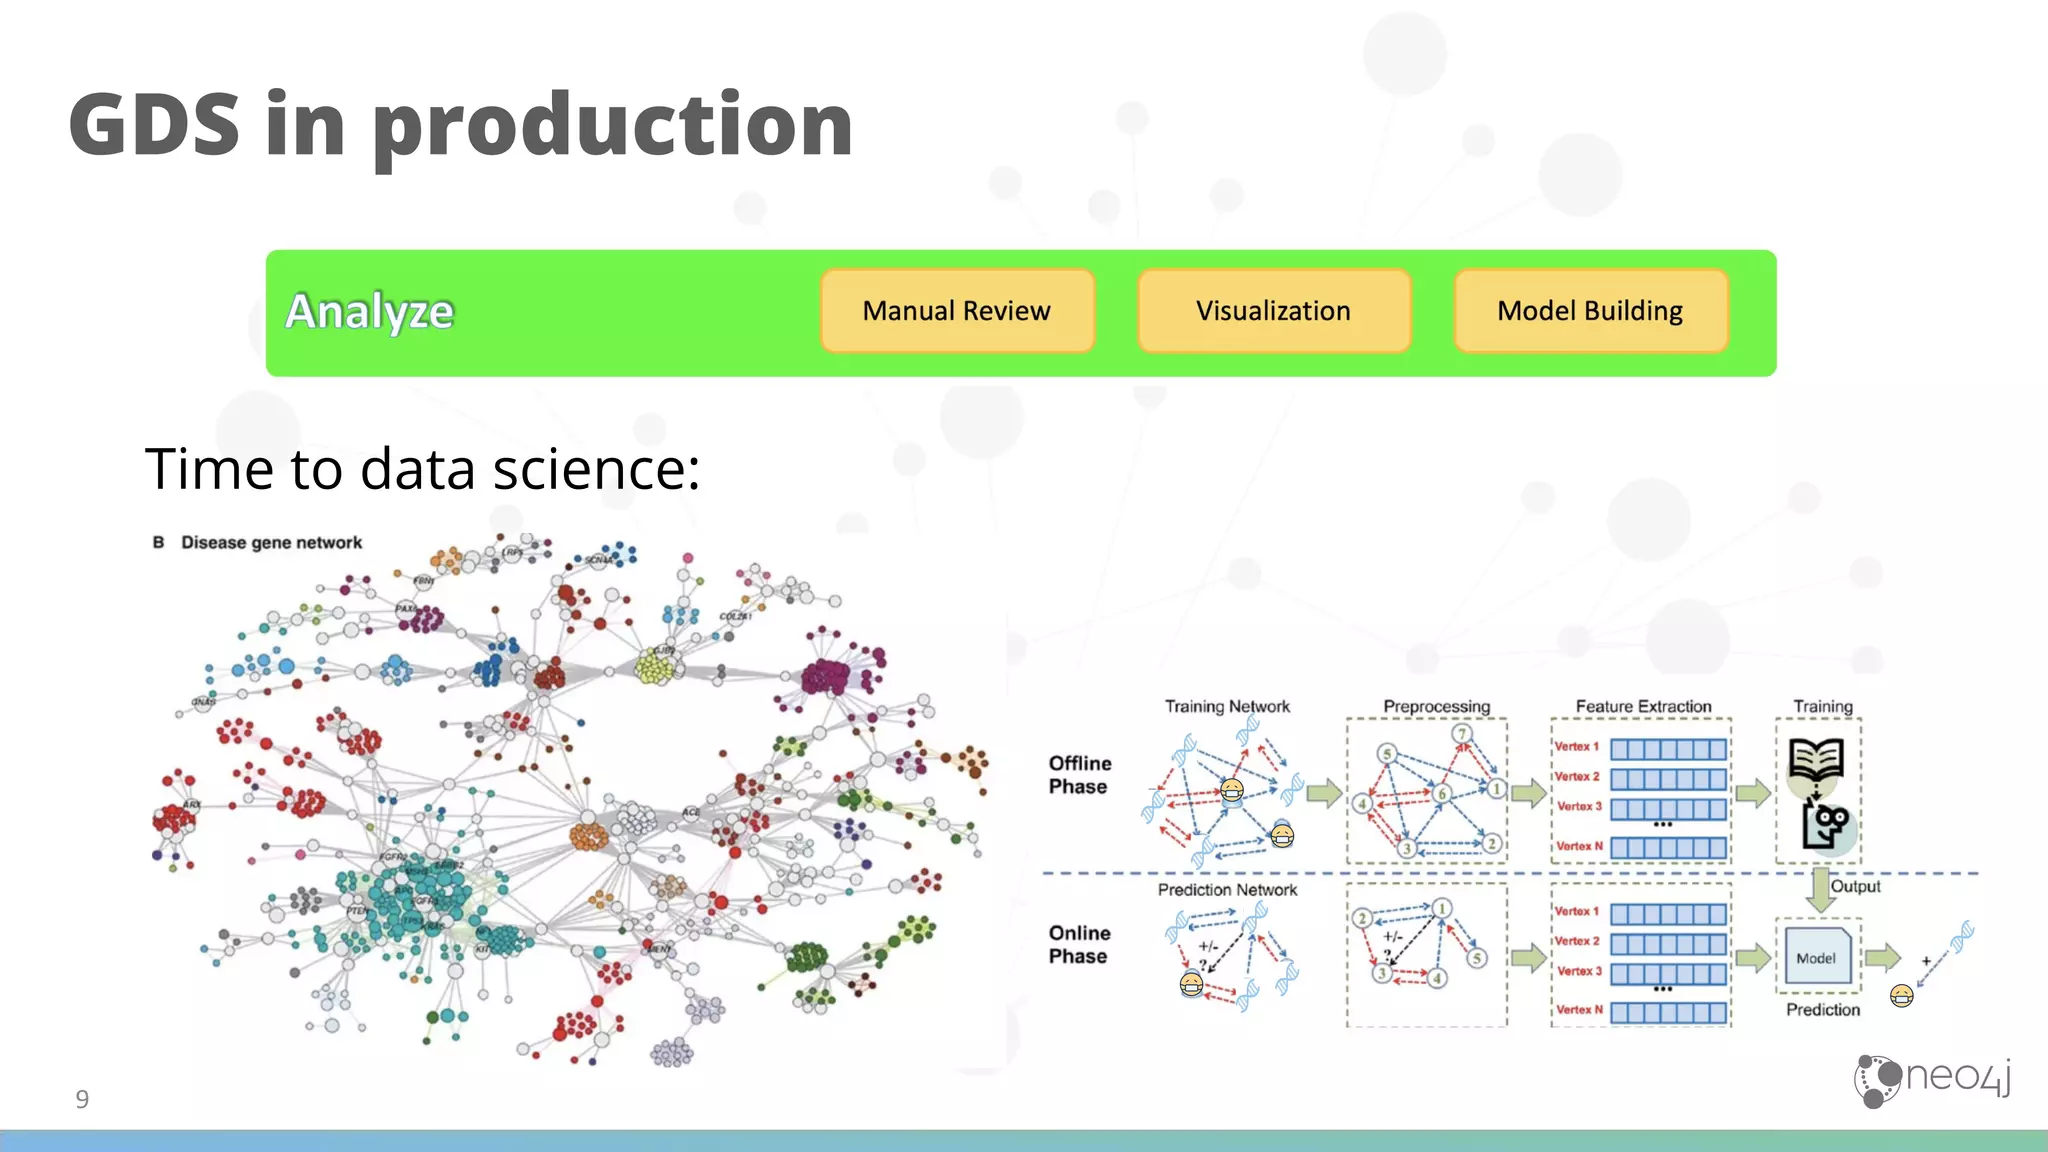
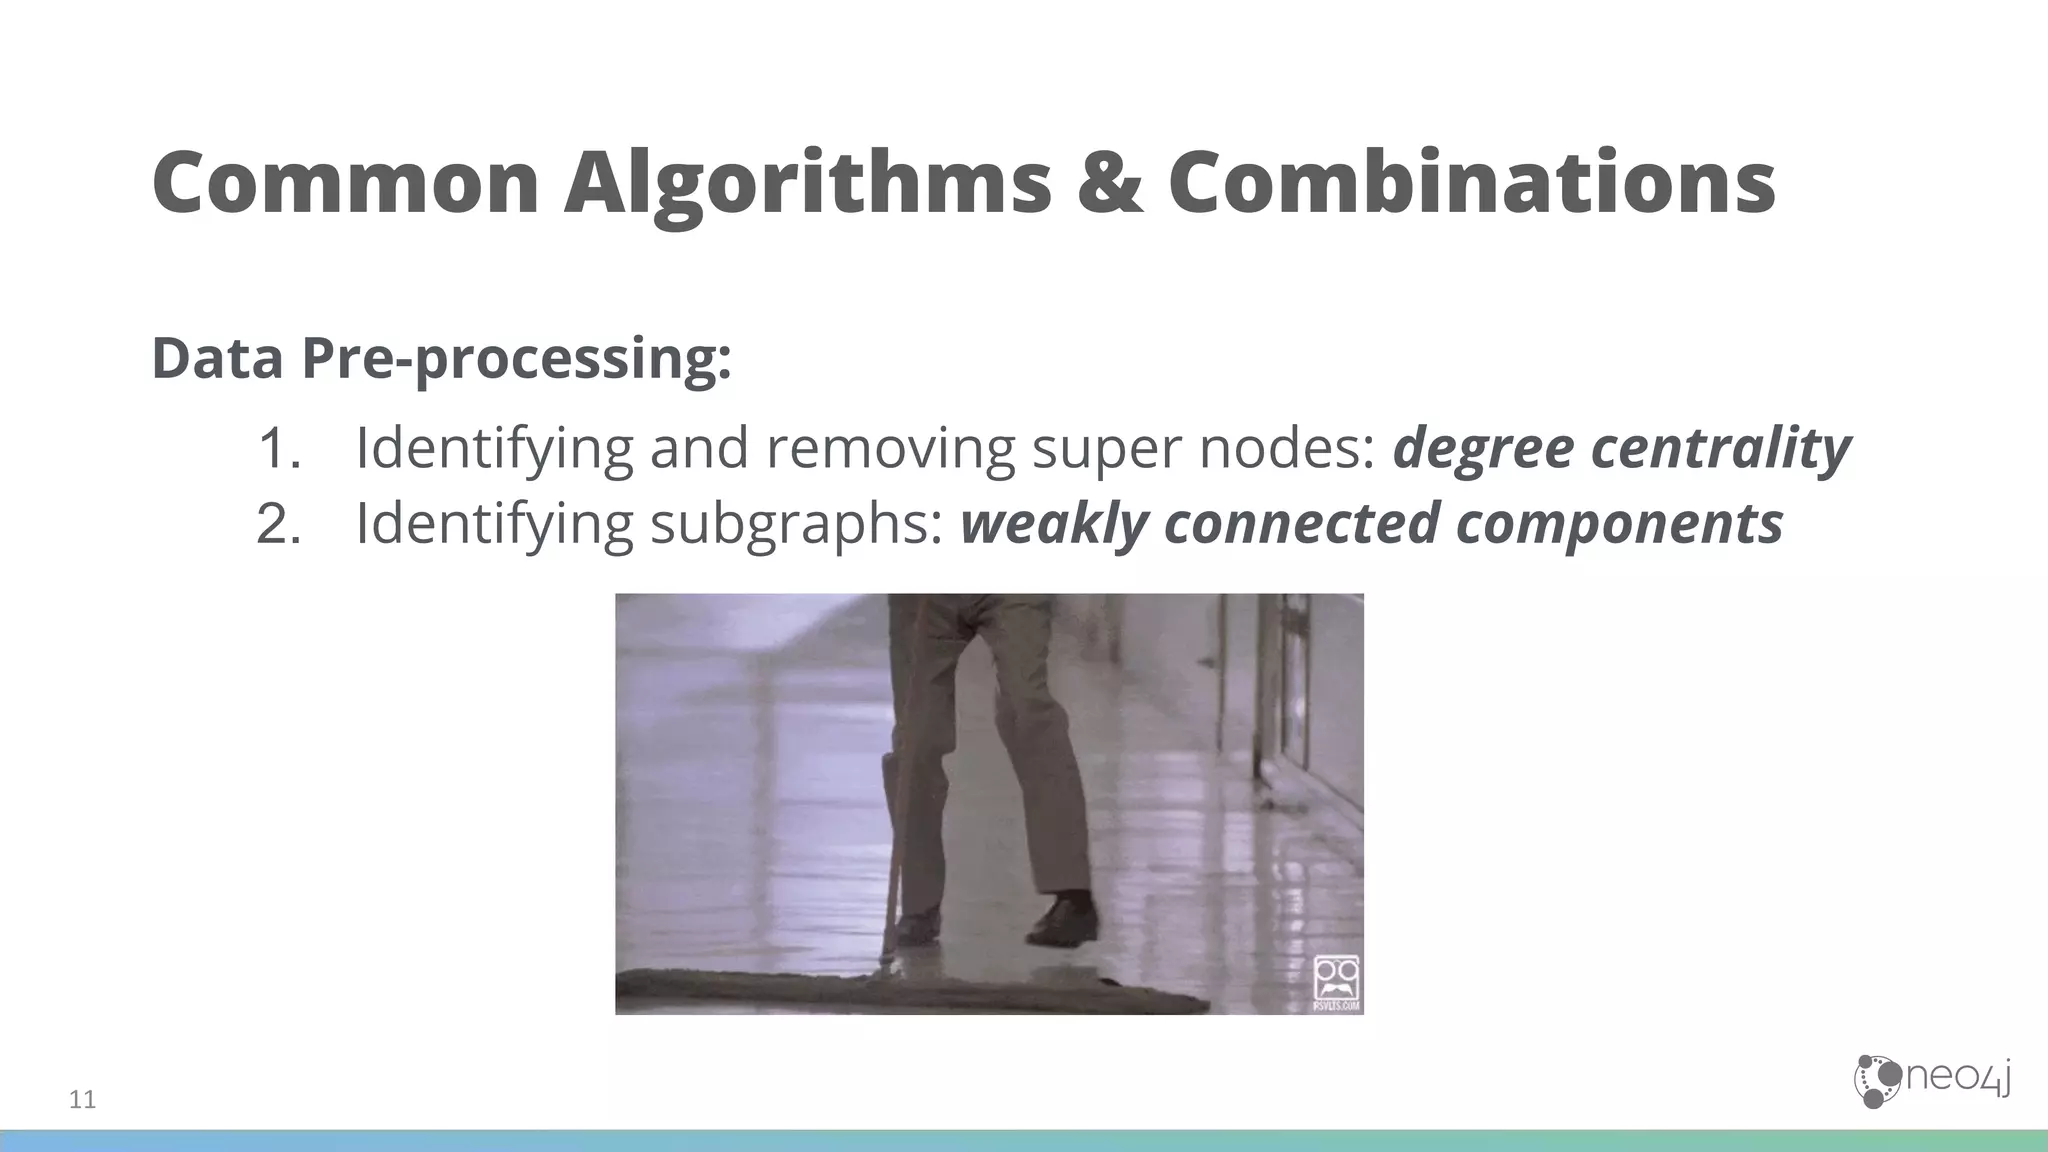
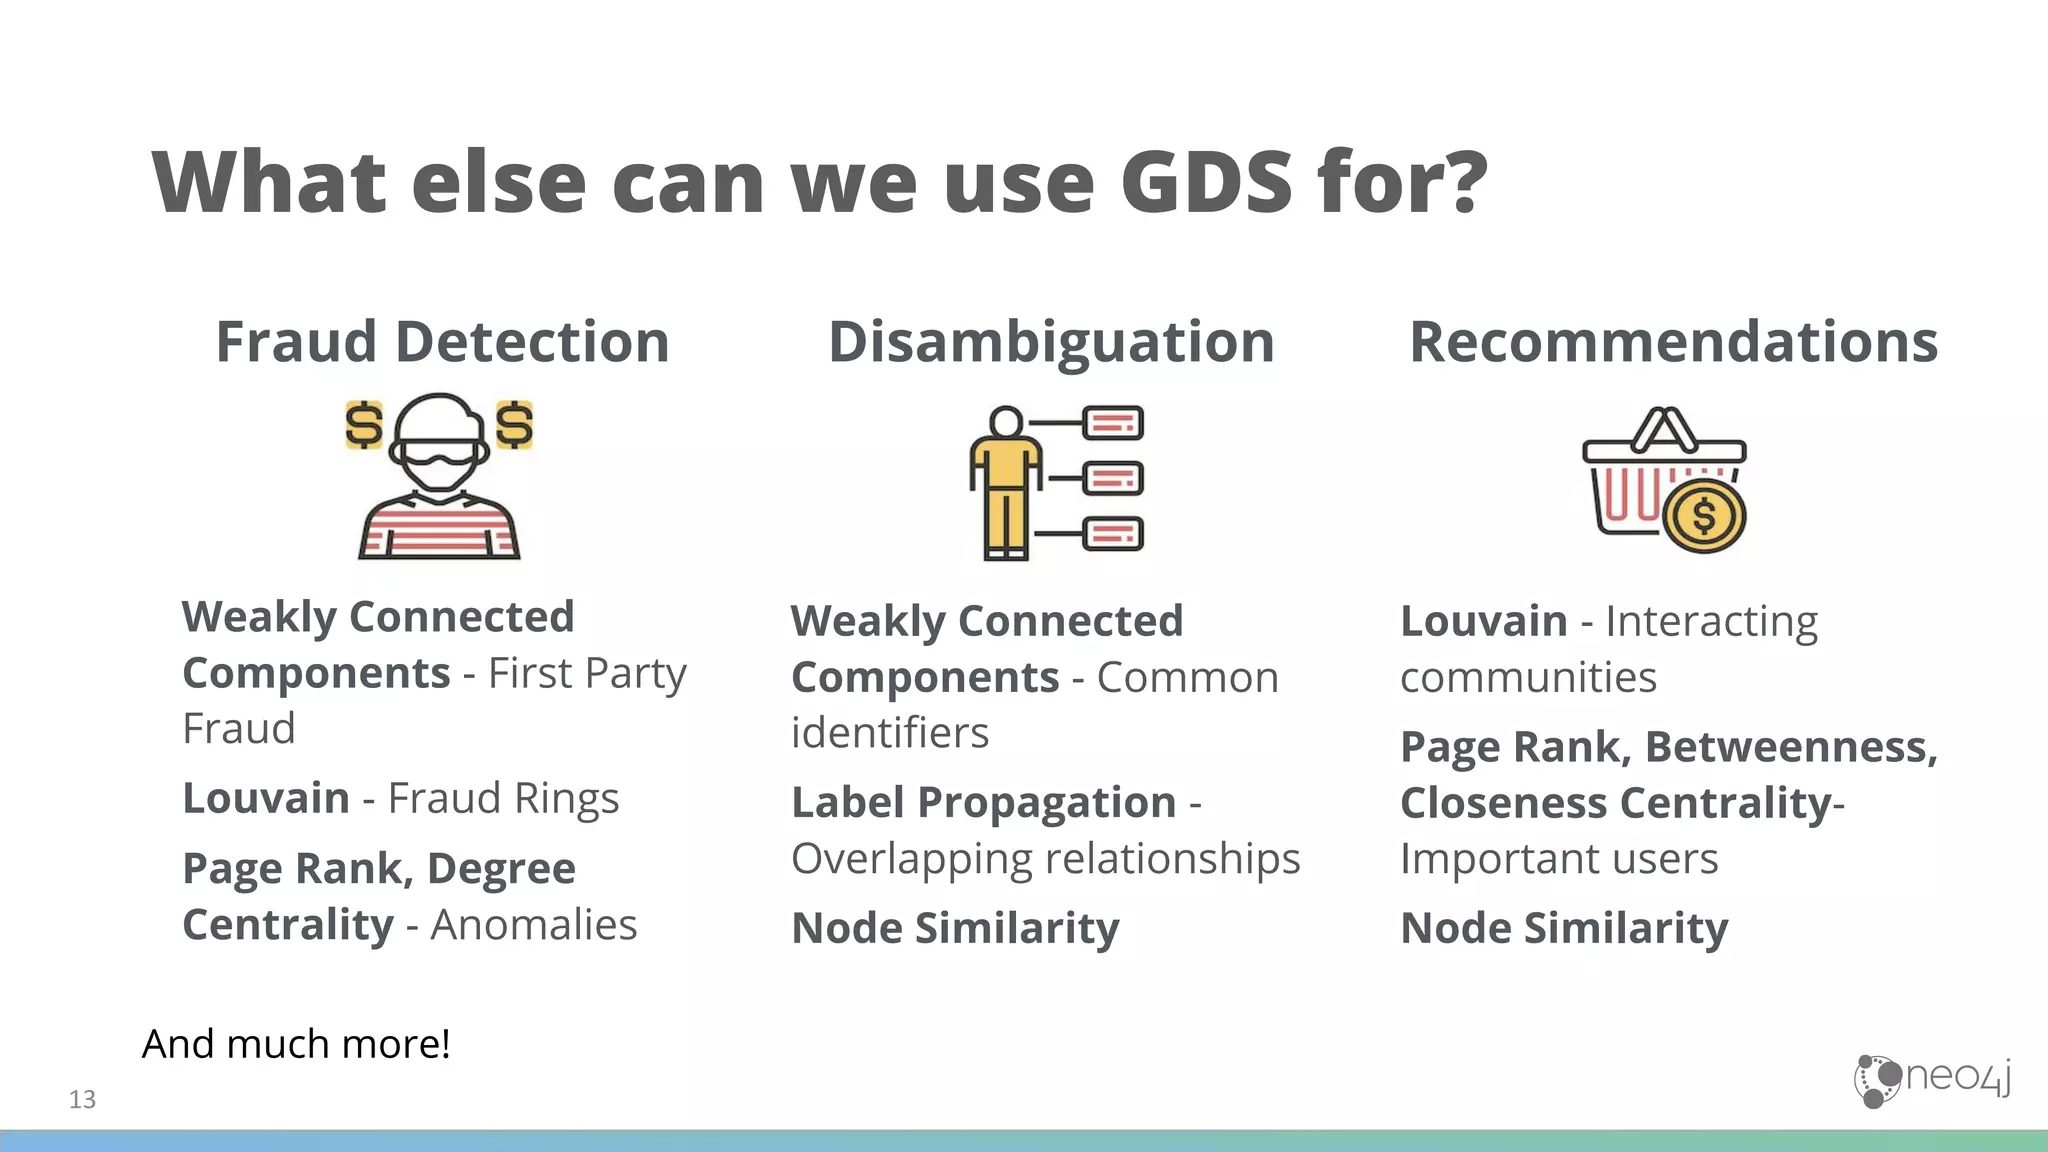
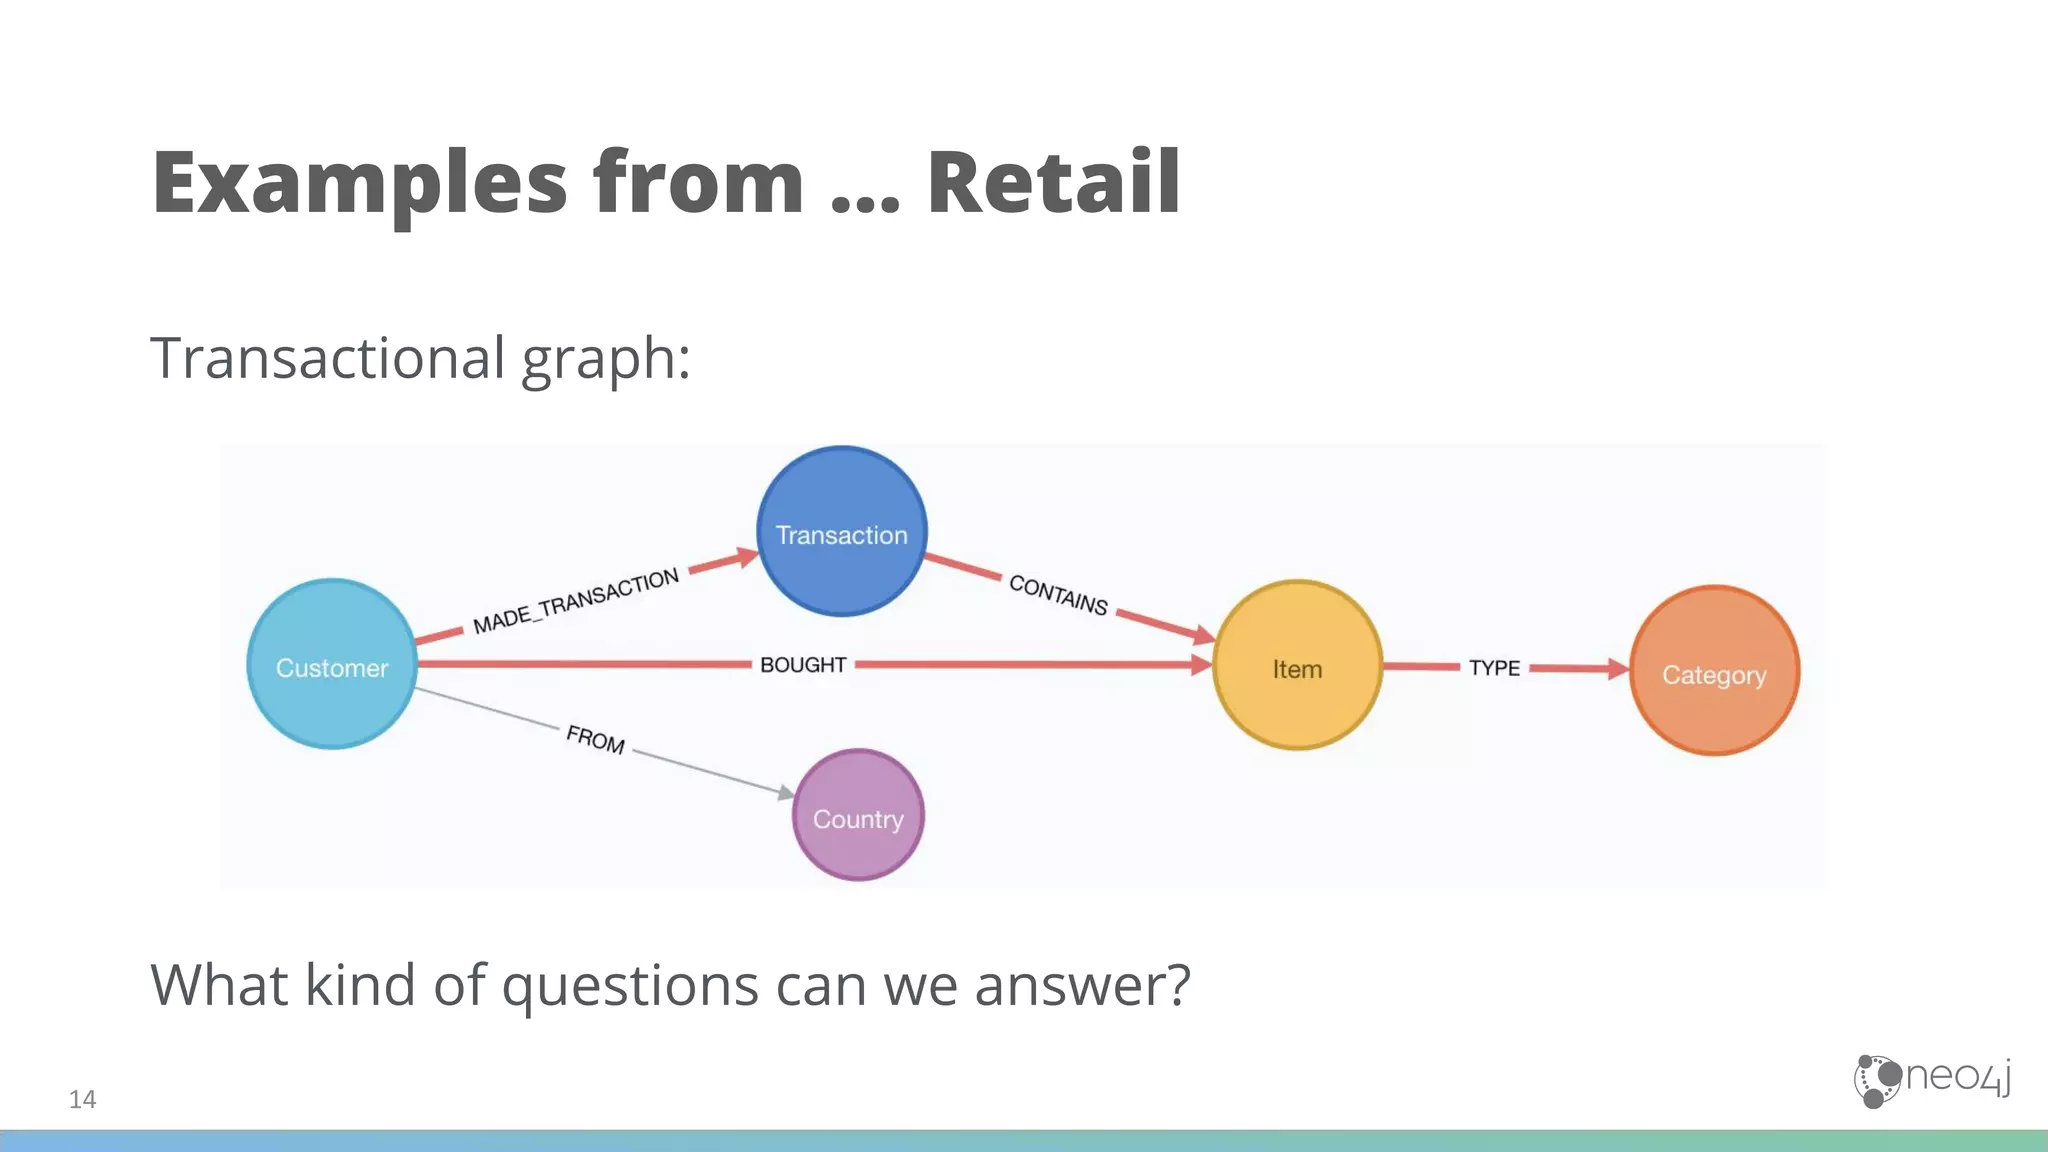
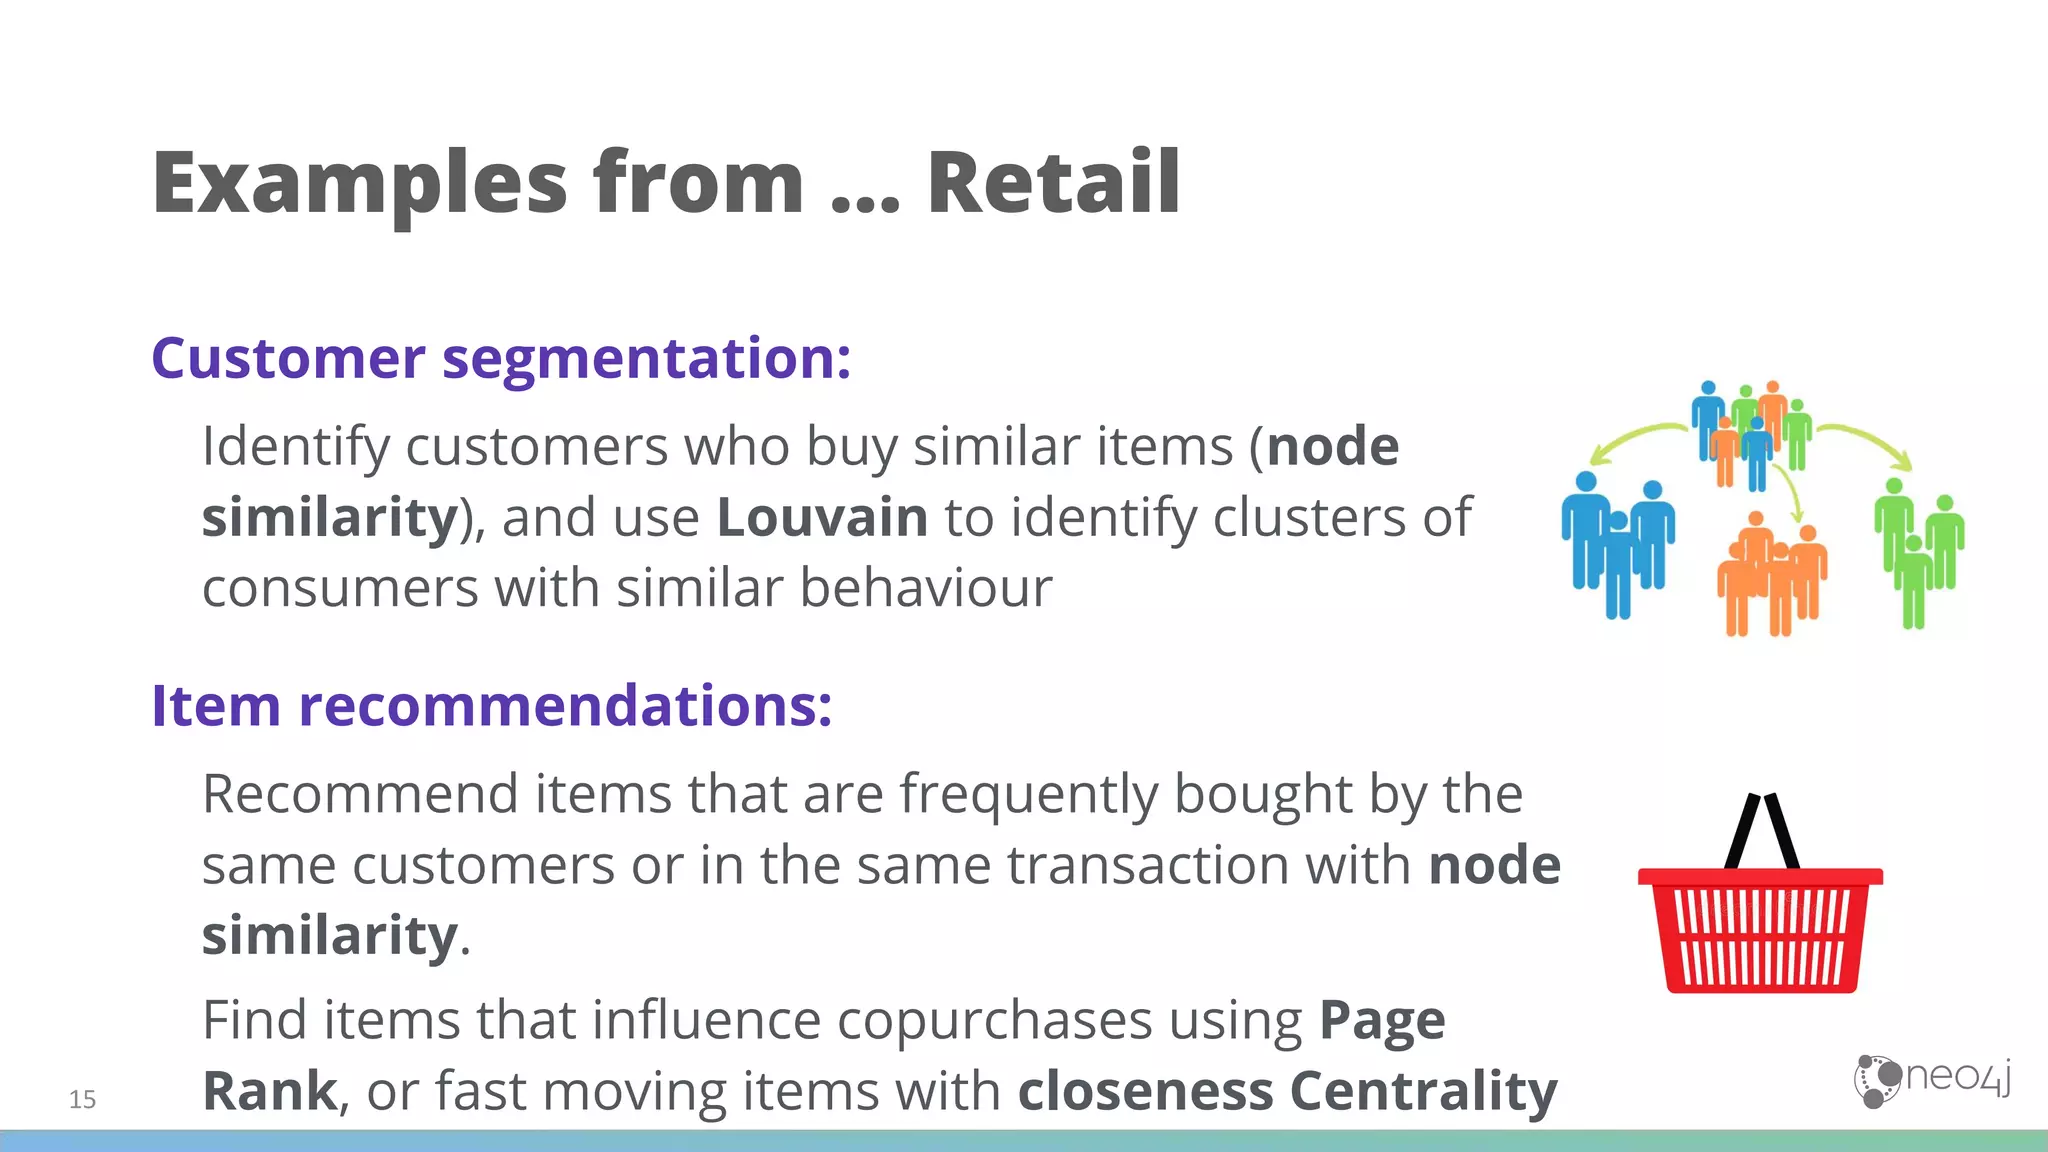
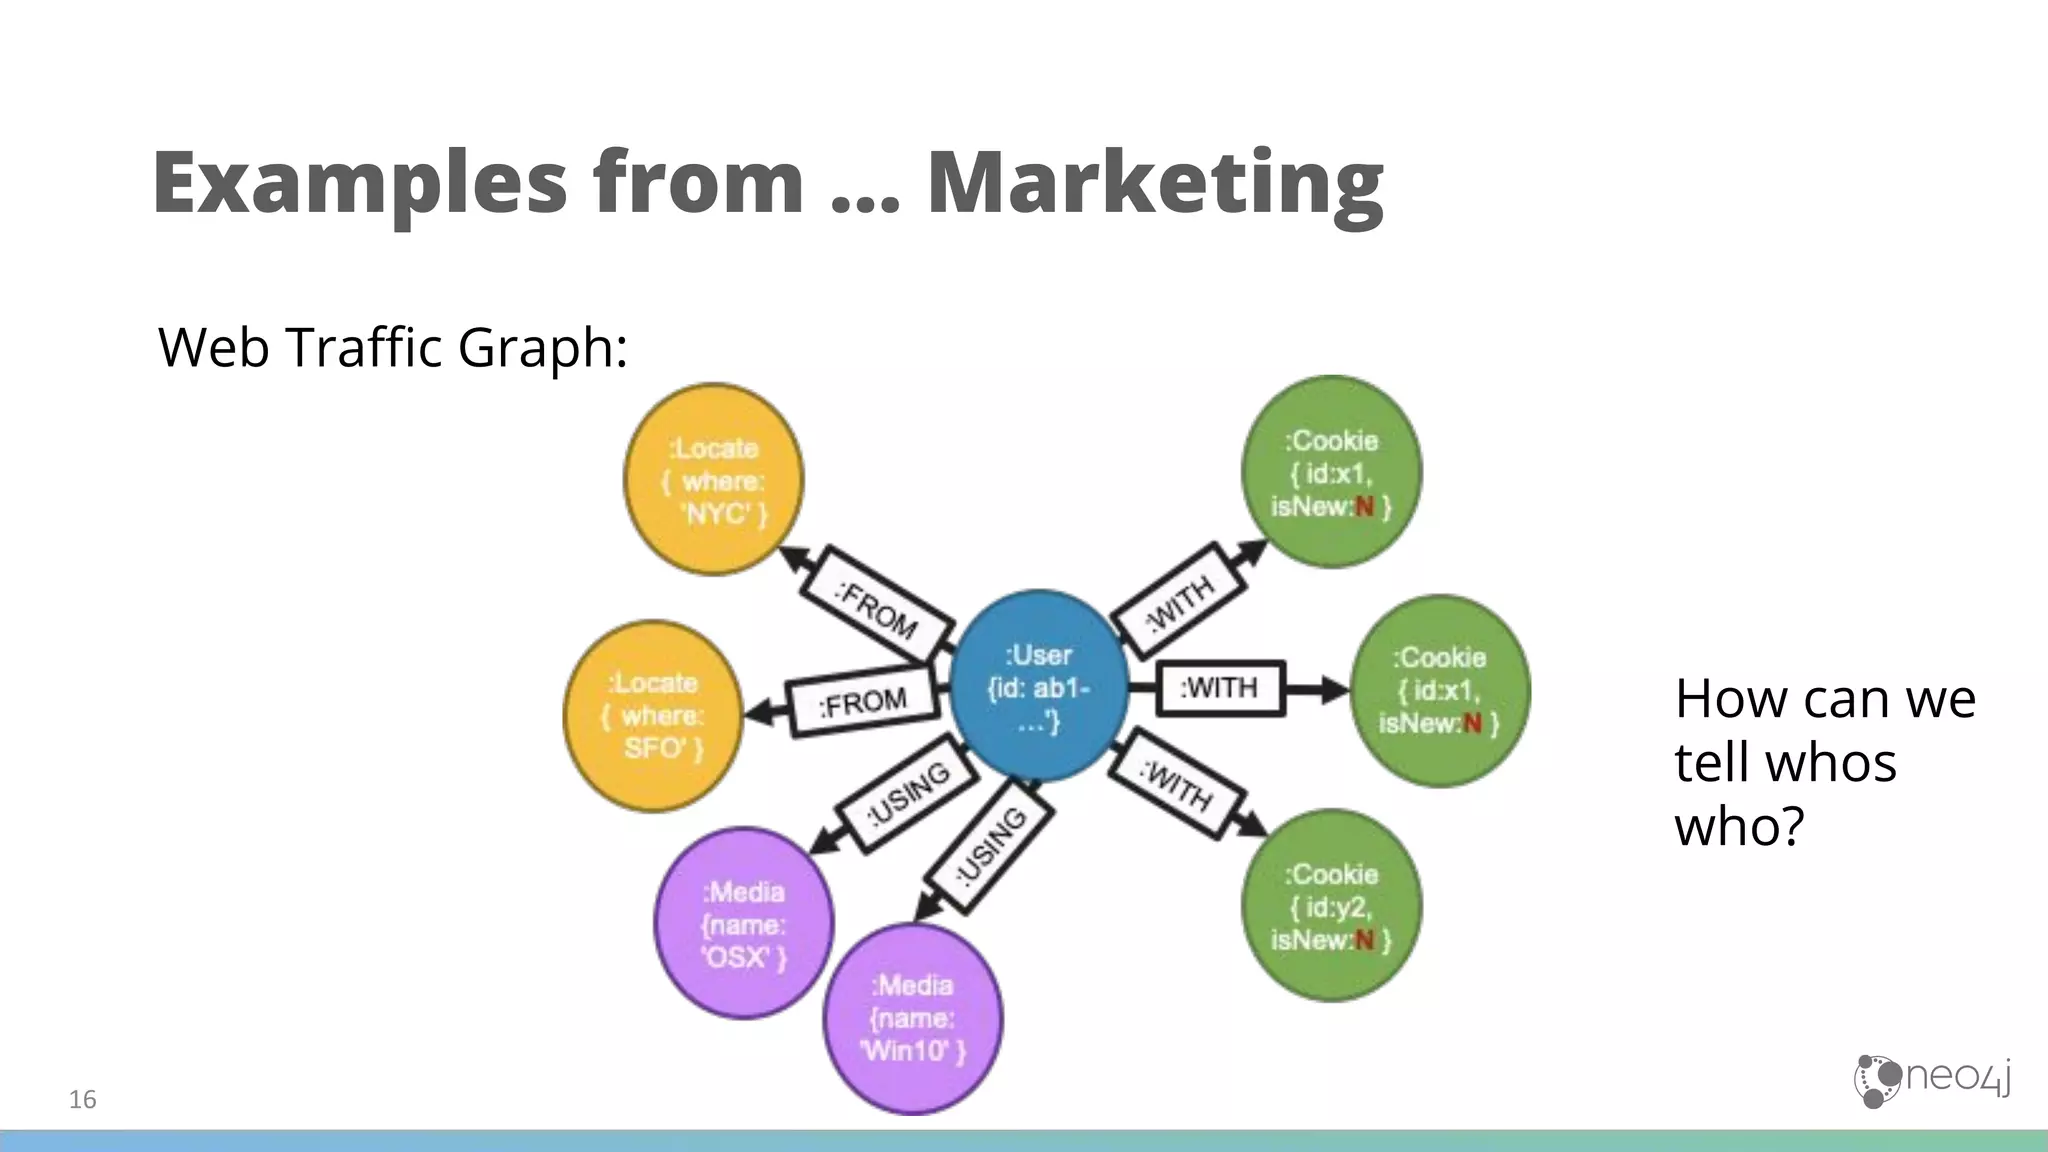
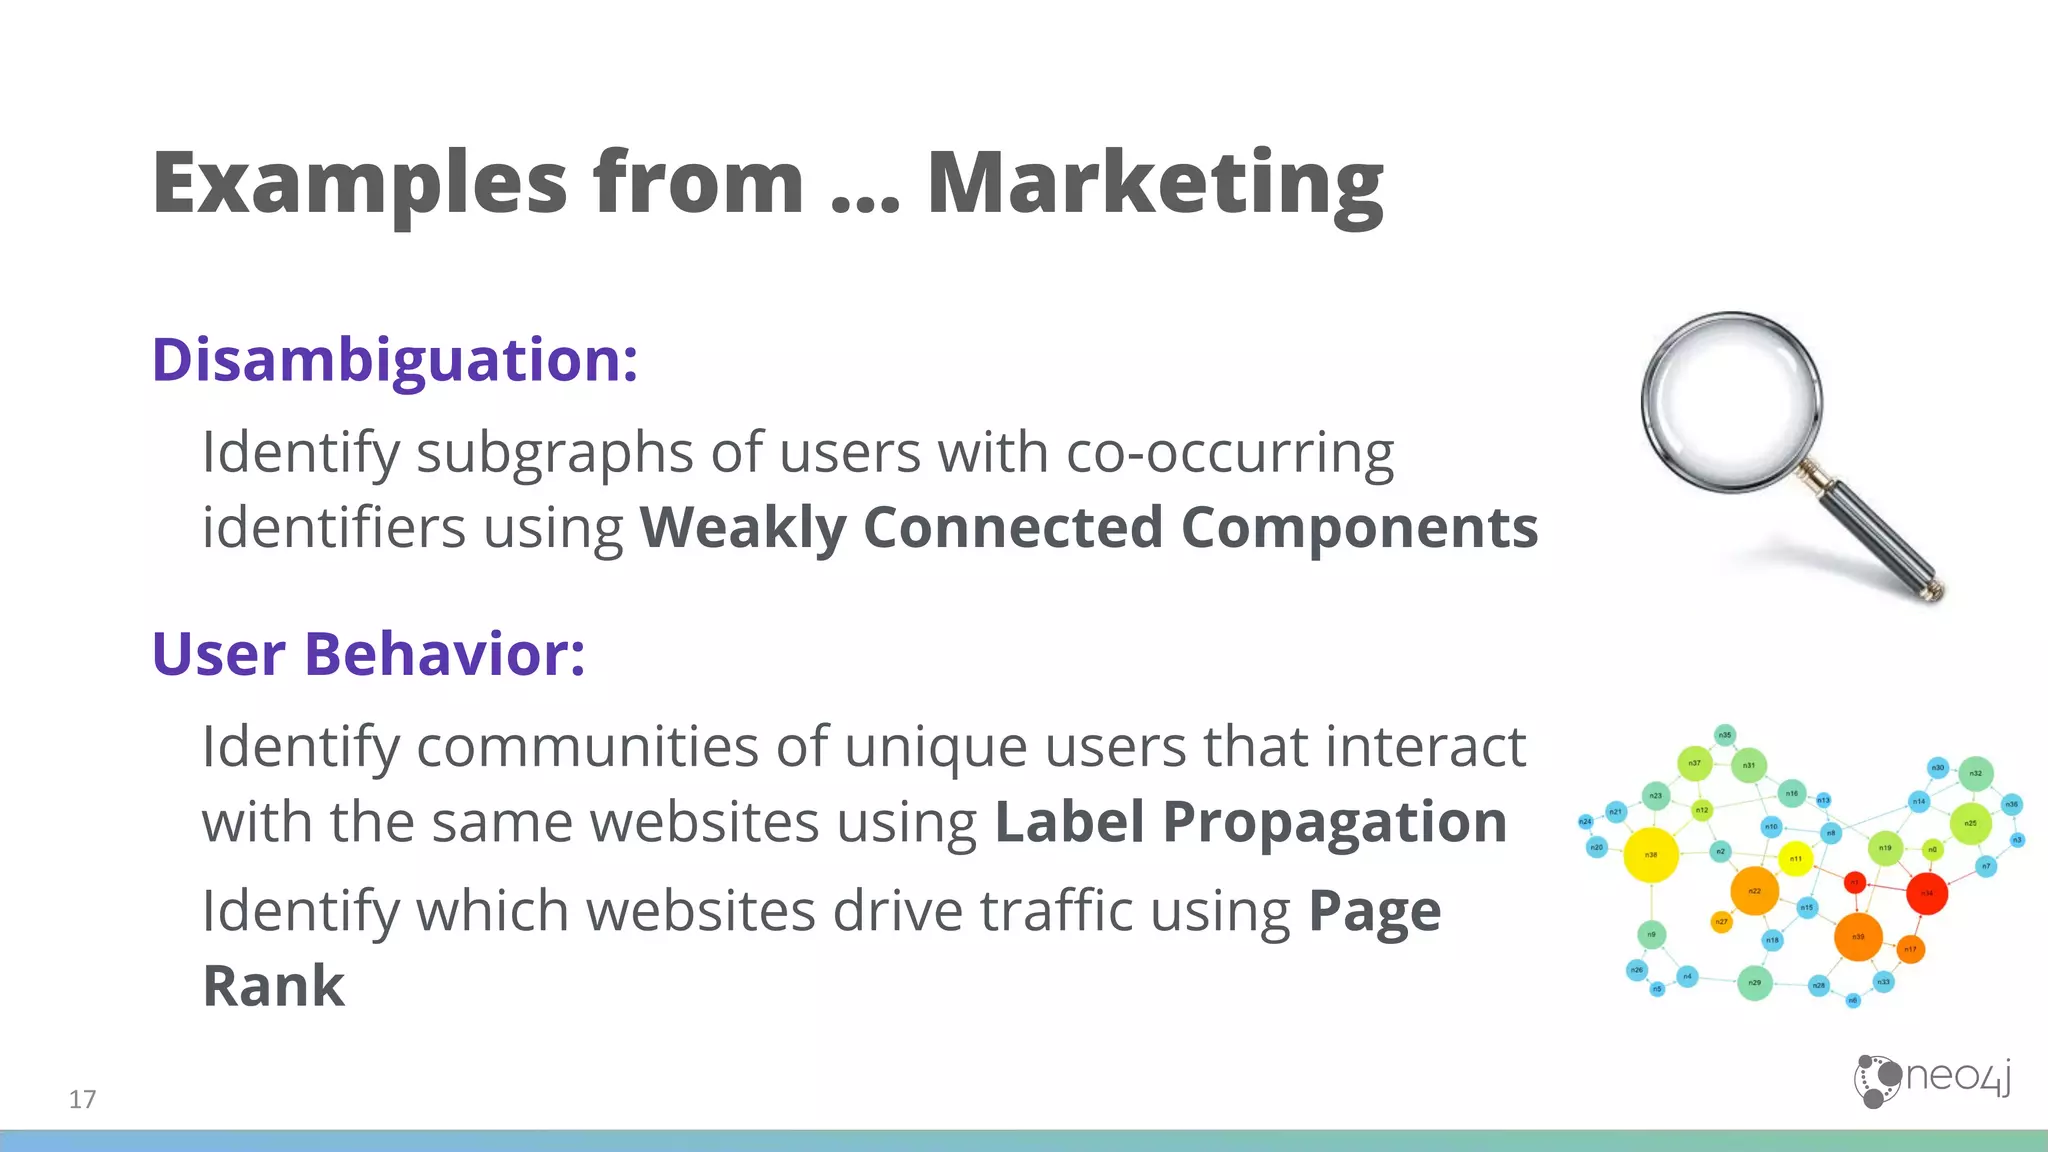
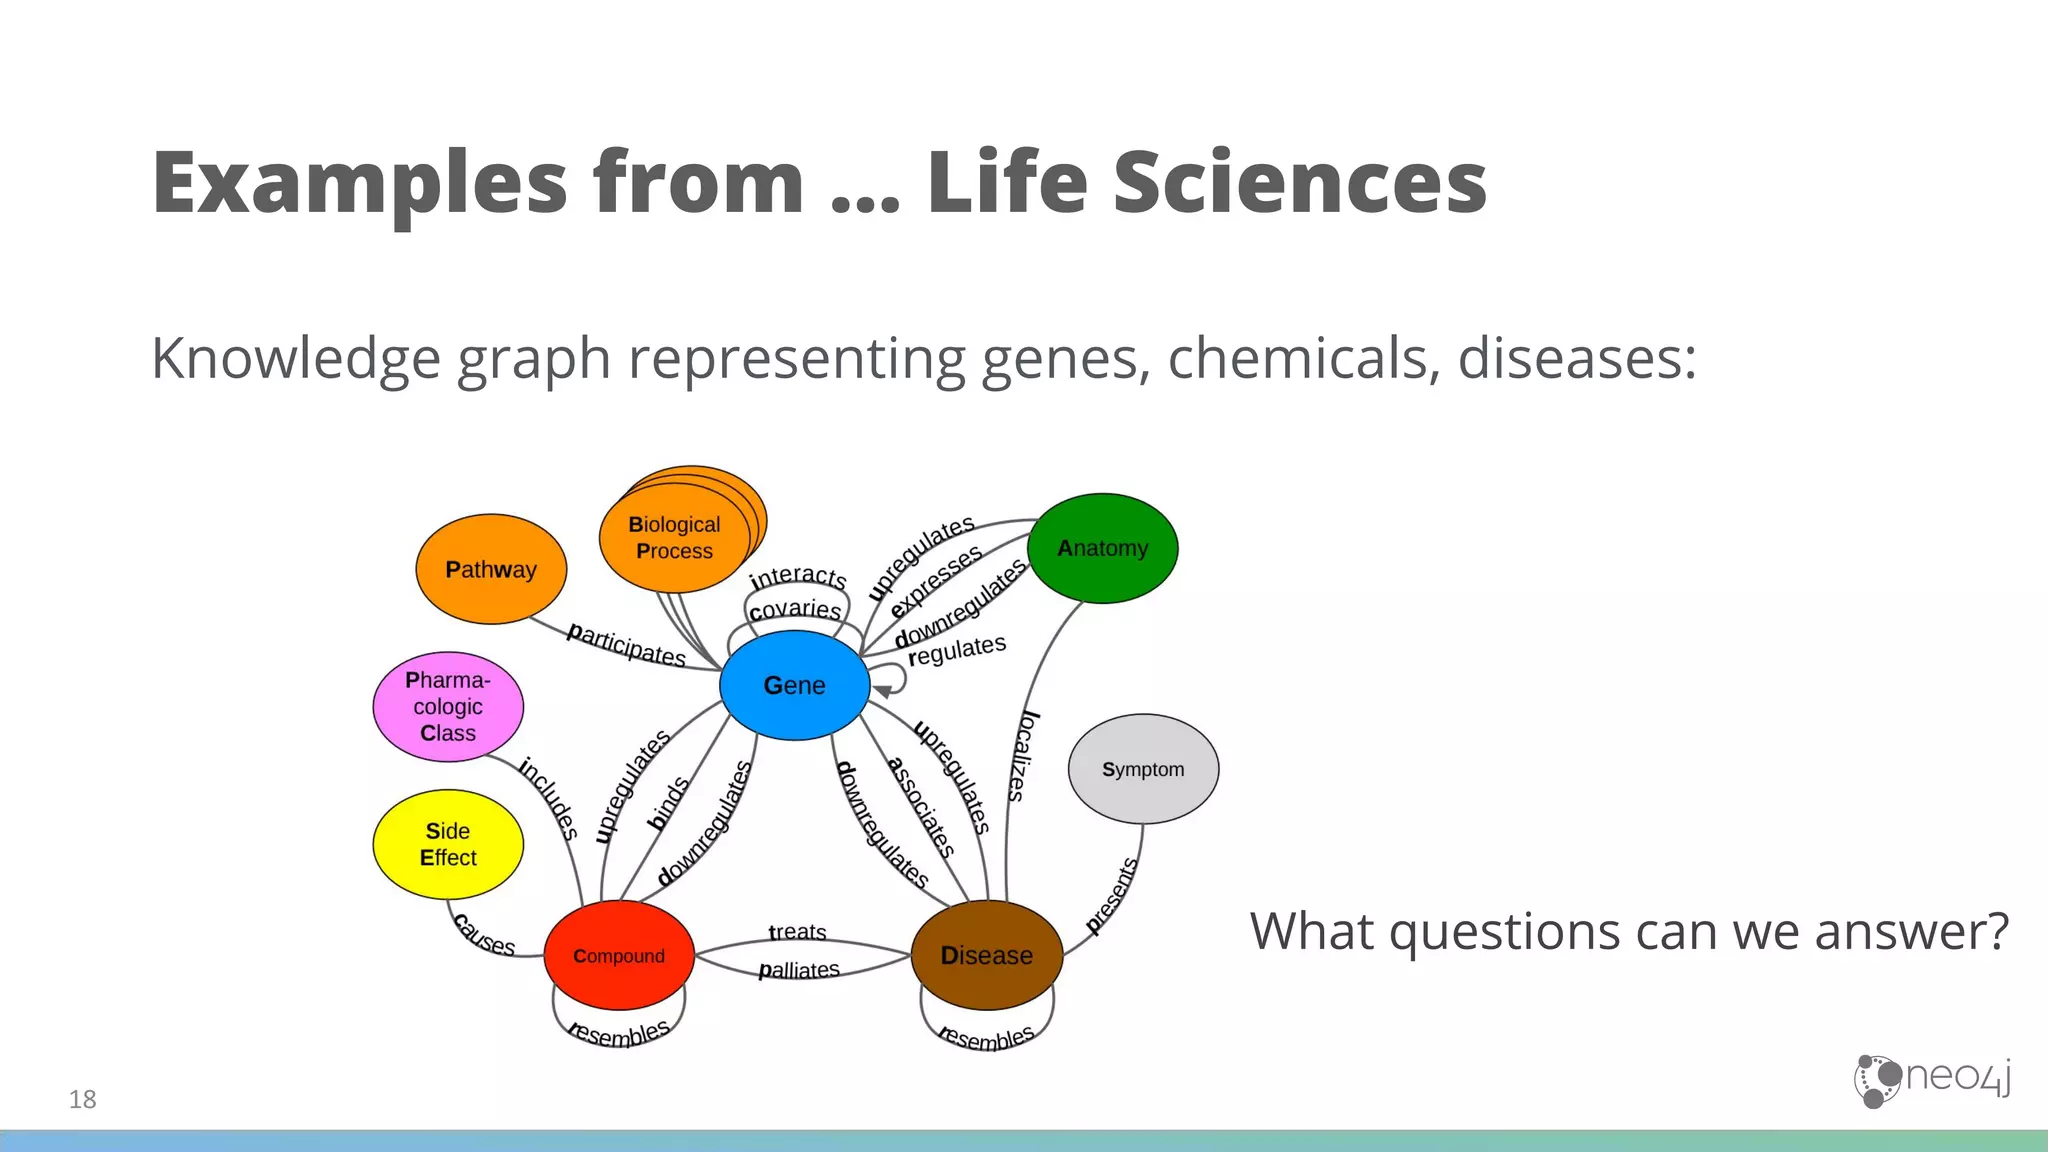
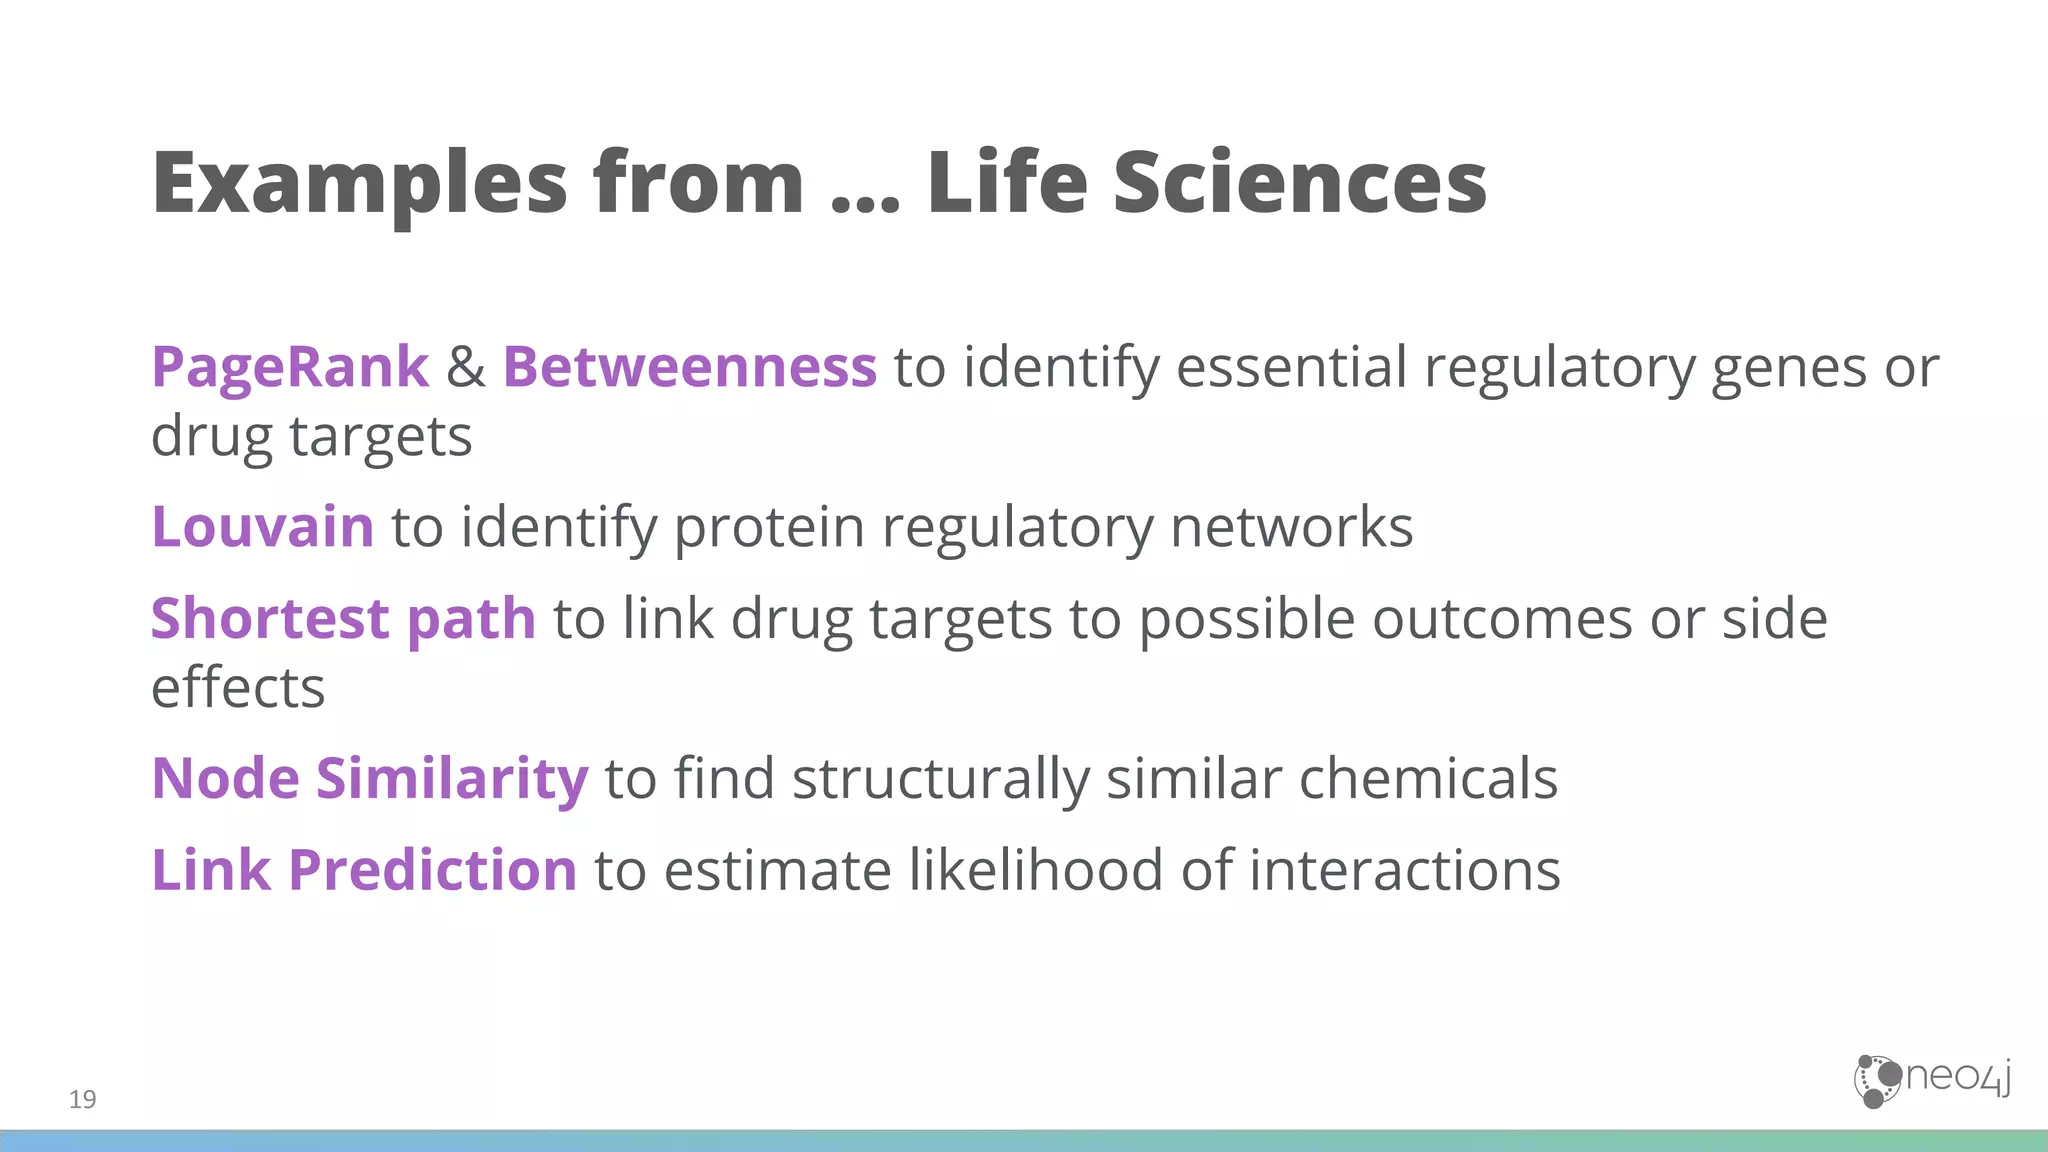
Neo4j GDS Best Practices
Graph Data Science Workflow
Objective
Know how to put together the right workflow
for your project, and how to combine
algorithms effectively.
GDS in production
GDS in production
Emphasis on data modeling:
(1) Define the problem you’re trying to answer:
Making recommendations? Finding anomalies?
(2) Match the problem to the correct set of algorithms:
recommendation = similarity, anomalies = centrality
(3) Modify your data model for the algorithms you want to use
- mono- or bi-partite
- modify labels, relationships to use native graphs
- consider weights, seeding
GDS in production
Configuration & best practices:
(1) Do I have enough memory to run this?
(2) How long will this take to run?
(3) What do I need to change?
GDS in production
Loading the analytics graph:
● This is one of the slowest steps, unavoidable, and takes up the
most memory so we want to minimize the number of graphs
we load
● Is it possible for us to load data for all the algorithms into a
single graph?
GDS in production
Running your algorithms:
- .stats returns summary statistics about the results of the algorithm
without writing to the database. Run this first to check if the calculations
make sense!
- .stream returns all the results as a stream - use this if you’re extracting
them for use elsewhere (eg. Python)
- .mutate writes to the in-memory graph. Output from the first
algorithm are written before moving onto the next one in the sequence
- .write writes to the Neo4j database. This is the slowest, so only run it
once you know your algos make sense!
GDS in production
Don’t forget this step:
CALL gds.graph.drop('Similarity-Graph');d
CALL gds.graph.drop('Monopartite-Graph');
Double check that you’ve got all of them:
CALL gds.graph.list();
GDS in production
Time to data science:
GDS is general purpose!
Data Pre-processing:
1. Identifying and removing super nodes: degree centrality
2. Identifying subgraphs: weakly connected components
Common Algorithms & Combinations
Community Detection + ???? = Profit
Community detection algorithms break up your graph into smaller
subgraphs based on edges. Use community detection to downscope
problems on large graphs and focus on the important parts.
- Speed up calculations: Community detection + node similarity
- Focus on the important stuff: Community detection + centrality
- Aggregate your graph: Treat communities as nodes and run centrality,
similarity, etc
Common Algorithms & Combinations
What else can we use GDS for?
Fraud Detection
Weakly Connected
Components - First Party
Fraud
Louvain - Fraud Rings
Page Rank, Degree
Centrality - Anomalies
Disambiguation
Weakly Connected
Components - Common
identifiers
Label Propagation -
Overlapping relationships
Node Similarity
Recommendations
Louvain - Interacting
communities
Page Rank, Betweenness,
Closeness Centrality-
Important users
Node Similarity
And much more!
Transactional graph:
What kind of questions can we answer?
Examples from … Retail
Customer segmentation:
Identify customers who buy similar items (node
similarity), and use Louvain to identify clusters of
consumers with similar behaviour
Item recommendations:
Recommend items that are frequently bought by the
same customers or in the same transaction with node
similarity.
Find items that influence copurchases using Page
Rank, or fast moving items with closeness Centrality
Examples from … Retail
Examples from … Marketing
Web Traffic Graph:
How can we
tell whos
who?
Examples from … Marketing
Disambiguation:
Identify subgraphs of users with co-occurring
identifiers using Weakly Connected Components
User Behavior:
Identify communities of unique users that interact
with the same websites using Label Propagation
Identify which websites drive traffic using Page
Rank
Knowledge graph representing genes, chemicals, diseases:
Examples from … Life Sciences
What questions can we answer?
PageRank & Betweenness to identify essential regulatory genes or
drug targets
Louvain to identify protein regulatory networks
Shortest path to link drug targets to possible outcomes or side
effects
Node Similarity to find structurally similar chemicals
Link Prediction to estimate likelihood of interactions
Examples from … Life Sciences
What are your use
cases? Let’s brainstorm!
Questions?

Neo4j Graph Data Science Training - June 9 & 10 - Slides #7 GDS Best Practices

  • 1.
    Neo4j GDS BestPractices Graph Data Science Workflow
  • 2.
    Objective Know how toput together the right workflow for your project, and how to combine algorithms effectively.
  • 3.
  • 4.
    GDS in production Emphasison data modeling: (1) Define the problem you’re trying to answer: Making recommendations? Finding anomalies? (2) Match the problem to the correct set of algorithms: recommendation = similarity, anomalies = centrality (3) Modify your data model for the algorithms you want to use - mono- or bi-partite - modify labels, relationships to use native graphs - consider weights, seeding
  • 5.
    GDS in production Configuration& best practices: (1) Do I have enough memory to run this? (2) How long will this take to run? (3) What do I need to change?
  • 6.
    GDS in production Loadingthe analytics graph: ● This is one of the slowest steps, unavoidable, and takes up the most memory so we want to minimize the number of graphs we load ● Is it possible for us to load data for all the algorithms into a single graph?
  • 7.
    GDS in production Runningyour algorithms: - .stats returns summary statistics about the results of the algorithm without writing to the database. Run this first to check if the calculations make sense! - .stream returns all the results as a stream - use this if you’re extracting them for use elsewhere (eg. Python) - .mutate writes to the in-memory graph. Output from the first algorithm are written before moving onto the next one in the sequence - .write writes to the Neo4j database. This is the slowest, so only run it once you know your algos make sense!
  • 8.
    GDS in production Don’tforget this step: CALL gds.graph.drop('Similarity-Graph');d CALL gds.graph.drop('Monopartite-Graph'); Double check that you’ve got all of them: CALL gds.graph.list();
  • 9.
    GDS in production Timeto data science:
  • 10.
  • 11.
    Data Pre-processing: 1. Identifyingand removing super nodes: degree centrality 2. Identifying subgraphs: weakly connected components Common Algorithms & Combinations
  • 12.
    Community Detection +???? = Profit Community detection algorithms break up your graph into smaller subgraphs based on edges. Use community detection to downscope problems on large graphs and focus on the important parts. - Speed up calculations: Community detection + node similarity - Focus on the important stuff: Community detection + centrality - Aggregate your graph: Treat communities as nodes and run centrality, similarity, etc Common Algorithms & Combinations
  • 13.
    What else canwe use GDS for? Fraud Detection Weakly Connected Components - First Party Fraud Louvain - Fraud Rings Page Rank, Degree Centrality - Anomalies Disambiguation Weakly Connected Components - Common identifiers Label Propagation - Overlapping relationships Node Similarity Recommendations Louvain - Interacting communities Page Rank, Betweenness, Closeness Centrality- Important users Node Similarity And much more!
  • 14.
    Transactional graph: What kindof questions can we answer? Examples from … Retail
  • 15.
    Customer segmentation: Identify customerswho buy similar items (node similarity), and use Louvain to identify clusters of consumers with similar behaviour Item recommendations: Recommend items that are frequently bought by the same customers or in the same transaction with node similarity. Find items that influence copurchases using Page Rank, or fast moving items with closeness Centrality Examples from … Retail
  • 16.
    Examples from …Marketing Web Traffic Graph: How can we tell whos who?
  • 17.
    Examples from …Marketing Disambiguation: Identify subgraphs of users with co-occurring identifiers using Weakly Connected Components User Behavior: Identify communities of unique users that interact with the same websites using Label Propagation Identify which websites drive traffic using Page Rank
  • 18.
    Knowledge graph representinggenes, chemicals, diseases: Examples from … Life Sciences What questions can we answer?
  • 19.
    PageRank & Betweennessto identify essential regulatory genes or drug targets Louvain to identify protein regulatory networks Shortest path to link drug targets to possible outcomes or side effects Node Similarity to find structurally similar chemicals Link Prediction to estimate likelihood of interactions Examples from … Life Sciences
  • 20.
    What are youruse cases? Let’s brainstorm!
  • 21.