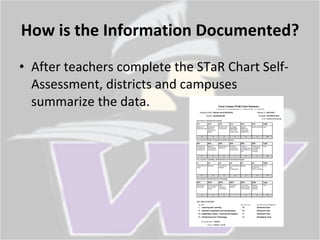
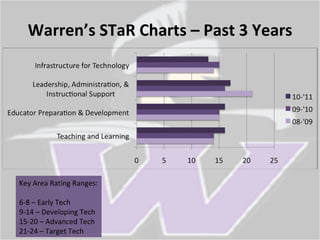
Introduction to: The Texas STaR Chart By: Julie Salinas L20270426 Lamar University EDLD 352 – EA1263 January 2012
Agenda What is the STaR Chart? The importance of the STaR Chart How is the Information Documented? Key Area STaR Classifications Warren’s STaR Charts – Past 3 Years We Can Improve!
What is the STaR Chart? STaR stands for “ S chool  T echnology  a nd  R eadiness.” STaR Assessments are a teacher tool used as for Planning and Self-Assessing aligned with the   Long-Range Plan for Technology, 2006-2020. Click for more information about the STaR Chart
The Importance of the STaR Chart The STaR Chart allows teachers to provide a self-assessment of their classroom and campus technological integration in the following four areas:
The Importance of the Star Chart The STaR Chart allows teachers to provide a self-assessment of their classroom and campus technological integration in the following four areas: Teaching and Learning Educator Preparation & Development Leadership, Administration and Instructional Support Infrastructure for Technology
How is the Information Documented? After teachers complete the STaR Chart Self-Assessment, districts and campuses summarize the data.
Key Area STaR Classifications Every year, the campus levels of performance are provided on the campus STaR Chart. This allows educators to determine areas that need improvement.
Key Area STaR Classifications The campus’ progress is assessed by using the following scale: Early Tech Developing Tech Advanced Tech Target Tech
Key Area STaR Classifications The campus’ progress is assessed by using the following scale: Early Tech Developing Tech Advanced Tech Target Tech  This is where we strive to be
Warren’s STaR Charts – Past 3 Years Key Area Rating Ranges: 6-8 – Early Tech 9-14 – Developing Tech 15-20 – Advanced Tech 21-24 – Target Tech
What Can We Do To Improve? To achieve Target Tech, we can: Become familiar with the Texas Long Range Plan for Technology Integrate technology into lessons Provide students with opportunities to use technology to achieve higher education Pursue technology professional development
Together, We Make a Difference!
Still Have Questions??? Northside ISD is prepared to answer ALL of your questions regarding STaR Charts and the advancement of technology. Feel free to contact any of your campus  administrators with questions  or concerns. Thank you!

Introduction to the STaR Chart

  • 1.
    Introduction to: TheTexas STaR Chart By: Julie Salinas L20270426 Lamar University EDLD 352 – EA1263 January 2012
  • 2.
    Agenda What isthe STaR Chart? The importance of the STaR Chart How is the Information Documented? Key Area STaR Classifications Warren’s STaR Charts – Past 3 Years We Can Improve!
  • 3.
    What is theSTaR Chart? STaR stands for “ S chool T echnology a nd R eadiness.” STaR Assessments are a teacher tool used as for Planning and Self-Assessing aligned with the   Long-Range Plan for Technology, 2006-2020. Click for more information about the STaR Chart
  • 4.
    The Importance ofthe STaR Chart The STaR Chart allows teachers to provide a self-assessment of their classroom and campus technological integration in the following four areas:
  • 5.
    The Importance ofthe Star Chart The STaR Chart allows teachers to provide a self-assessment of their classroom and campus technological integration in the following four areas: Teaching and Learning Educator Preparation & Development Leadership, Administration and Instructional Support Infrastructure for Technology
  • 6.
    How is theInformation Documented? After teachers complete the STaR Chart Self-Assessment, districts and campuses summarize the data.
  • 7.
    How is theInformation Documented? After teachers complete the STaR Chart Self-Assessment, districts and campuses summarize the data.
  • 8.
    Key Area STaRClassifications Every year, the campus levels of performance are provided on the campus STaR Chart. This allows educators to determine areas that need improvement.
  • 9.
    Key Area STaRClassifications The campus’ progress is assessed by using the following scale: Early Tech Developing Tech Advanced Tech Target Tech
  • 10.
    Key Area STaRClassifications The campus’ progress is assessed by using the following scale: Early Tech Developing Tech Advanced Tech Target Tech This is where we strive to be
  • 11.
    Warren’s STaR Charts– Past 3 Years Key Area Rating Ranges: 6-8 – Early Tech 9-14 – Developing Tech 15-20 – Advanced Tech 21-24 – Target Tech
  • 12.
    What Can WeDo To Improve? To achieve Target Tech, we can: Become familiar with the Texas Long Range Plan for Technology Integrate technology into lessons Provide students with opportunities to use technology to achieve higher education Pursue technology professional development
  • 13.
    Together, We Makea Difference!
  • 14.
    Still Have Questions???Northside ISD is prepared to answer ALL of your questions regarding STaR Charts and the advancement of technology. Feel free to contact any of your campus administrators with questions or concerns. Thank you!