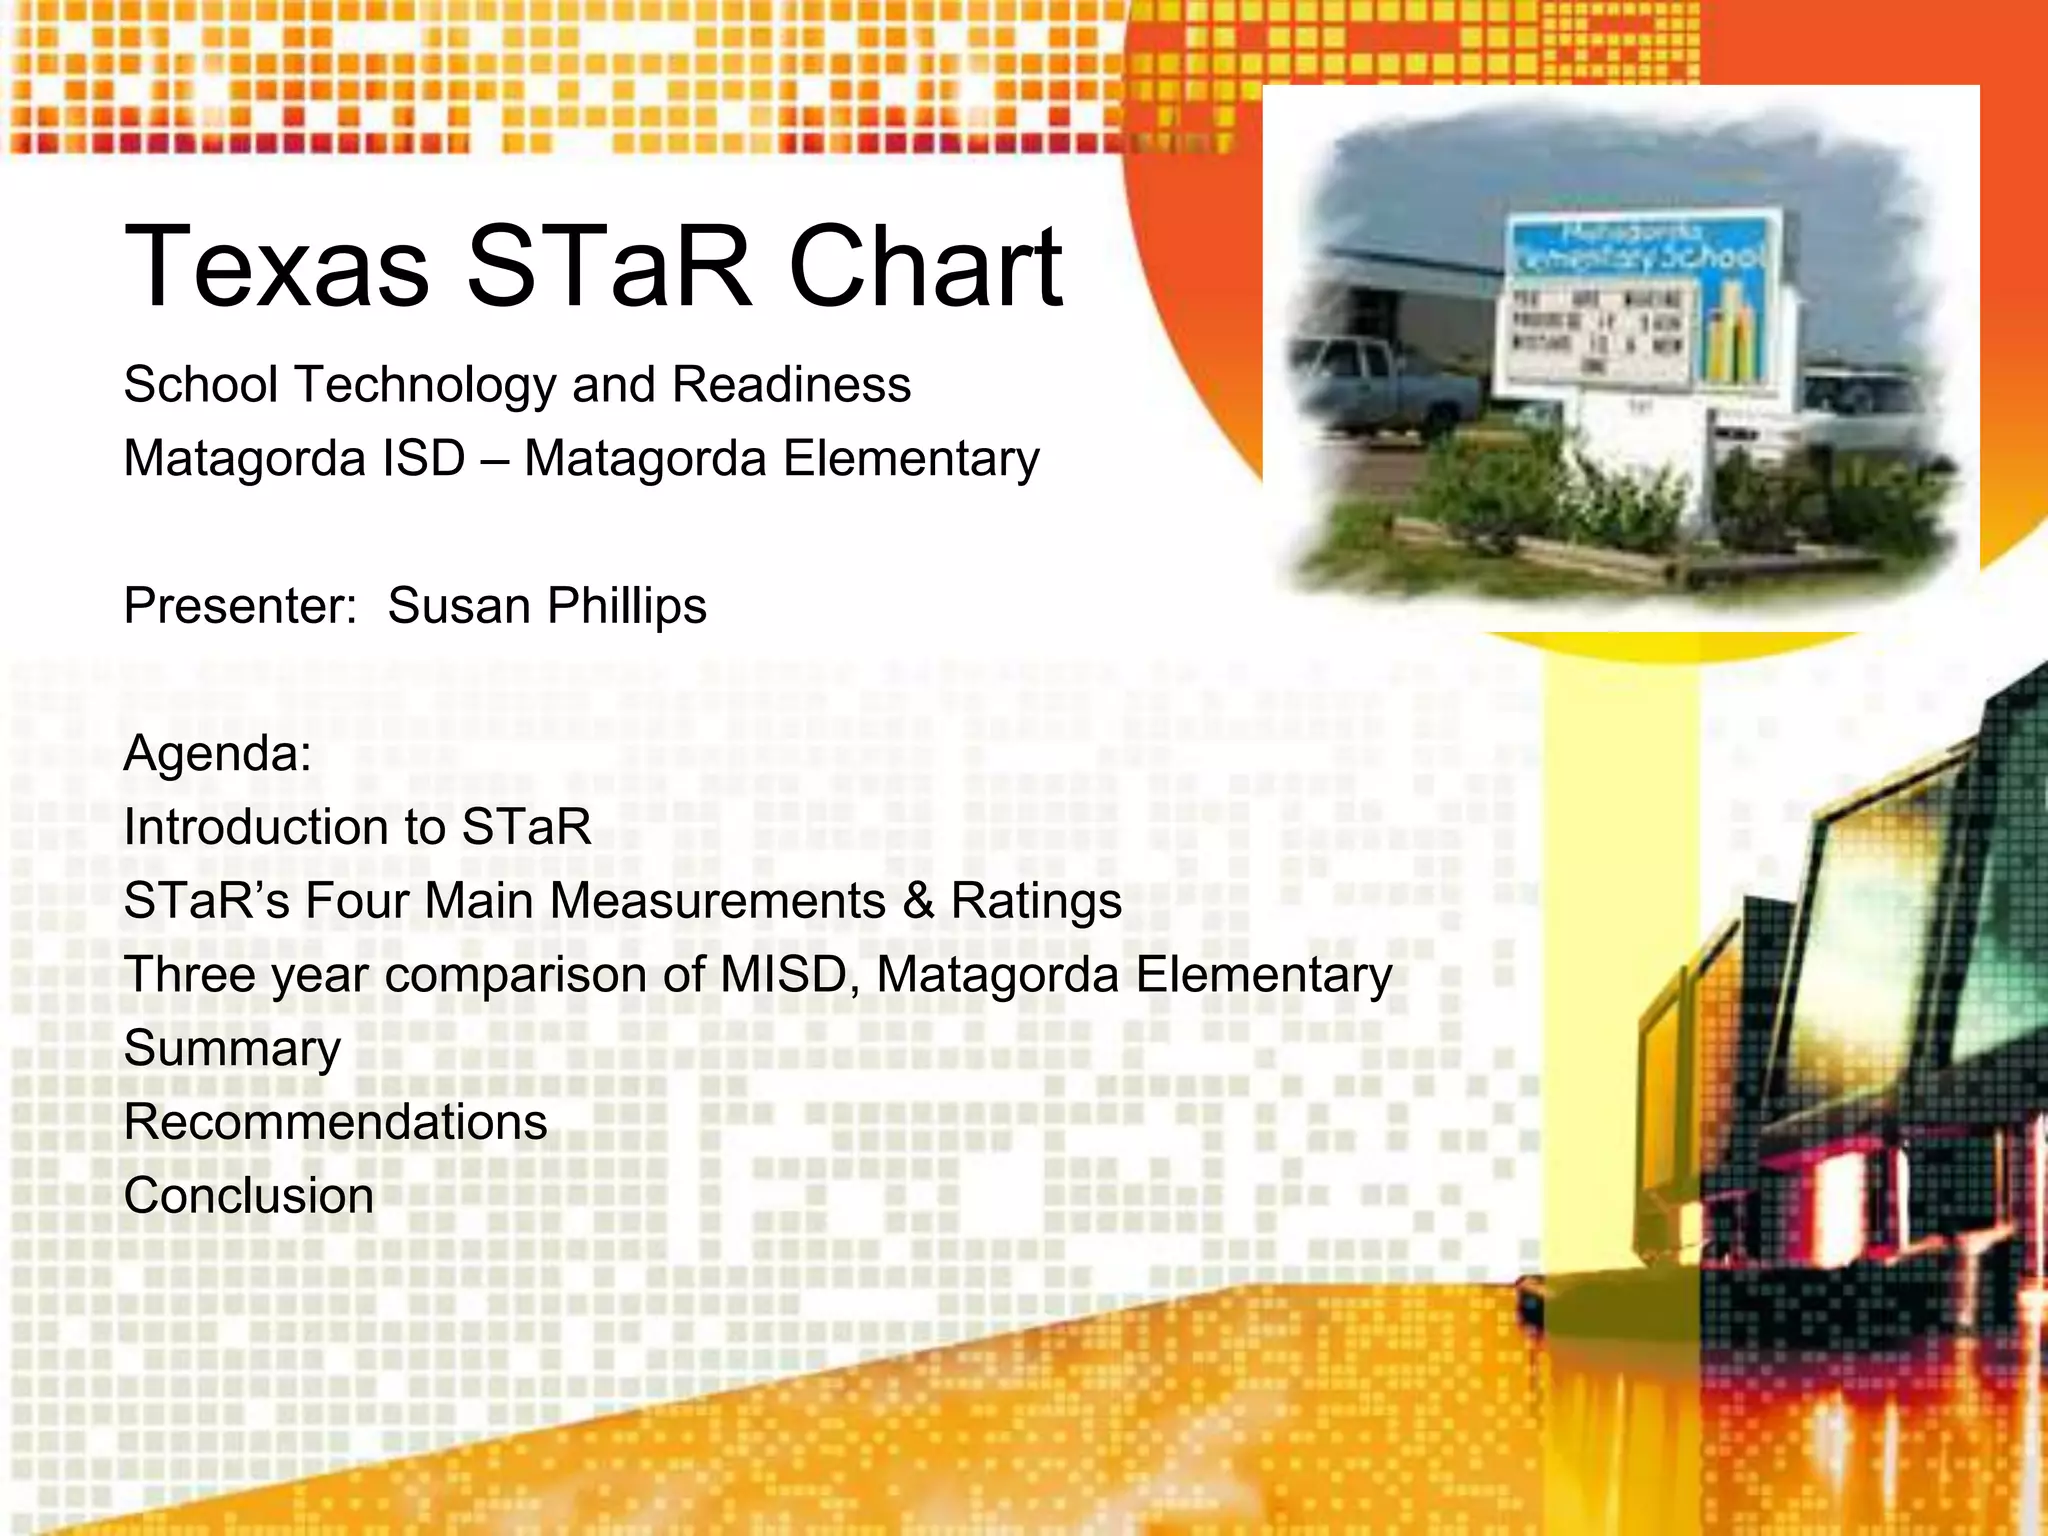
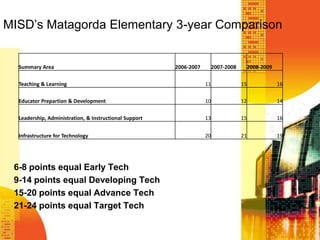
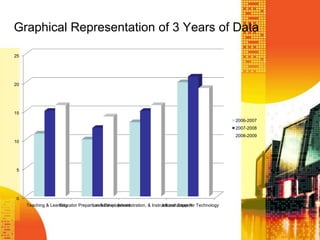
Texas STaR ChartSchool Technology and ReadinessMatagorda ISD – Matagorda ElementaryPresenter:  Susan PhillipsAgenda:Introduction to STaRSTaR’s Four Main Measurements & RatingsThree year comparison of MISD, Matagorda ElementarySummary RecommendationsConclusion
Introduction to the STaR ChartWho?Texas Education Agencys’  EducationalAdvisory Committee (ETAC) developedit in response to the Long-Range Planfor Technology, 2006-2020.
Introduction to the STaR Chart What? An online resource for teachers to selfassess our campus’ and district’sprogress towards integratingtechnology into every classroom and allcurriculum.
Introduction to the STaR  ChartWhere?Online, can be accessed through a shortcuton our website under resourcesSchool or homeAt your preferencewww.tea.state.tx.us/starchart
Introduction to the STaR ChartWhen?Annually, each school yearA requirement as of 2006-2007 yearOn your ownAdministration prefers October
Introduction to the STaR ChartWhy?It provides us with a standard formeasuring our progress toward NCLB’s TitleII, Part Drequirement that all students aretechnological literate by the end of 8thgrade.   It identifies our campus needs!It’s required for funding!
Introduction to the STaR ChartHow?You can complete online training here:..\..\Desktop\Teacher STaR Chart Instructions(2).pdf
Four Key Areas of MeasurementNumber 1:  Teaching and LearningStudent mastery of Tech TEKS (PreK-12)
Technology Applications (TA) implementation
Integration across subjects and curriculum
How often and how is digital content     integrated into the instructional settingPatterns of classroom useFour Key Areas of MeasurementNumber 2 :  Educator Preparation and DevelopmentAccess to Professional Development, including onlineModels for Professional Development, including onlineProfessional Development for online learningContent of Professional DevelopmentCapabilities of Educators  (SBEC)Levels of understanding and patterns
Four Key Areas of MeasurementNumber 3:  Leadership, Administration, andInstructional SupportLeadership and visionPlanning of instructional supportCommunication and collaboration  (PLCs)BudgetLeadership and support for online learning
Four Key Areas of MeasurementNumber 4:  Infrastructure for TechnologyNumber of students per computerInternet access, connectivity, speed, LAN, WANAdditional classroom technology (not overheads)Technical support (repairs, training, timeliness)CapacityDistance learning
Levels of ProgressEarly TechDeveloping TechAdvanced TechTarget Tech
MISD’s Matagorda Elementary 3-year Comparison6-8 points equal Early Tech9-14 points equal Developing Tech15-20 points equal Advance Tech21-24 points equal Target Tech
Graphical Representation of 3 Years of Data
WHERE DO WE GO NOW?We have to work with our PLCs to make our education programs full of technology!We need to align  goals, curriculum, instructional practices, formative and summative assessments, and technology!Learn to understand what it means to live and learn in a digital world and apply those techniques in our learningenvironments so our Matagorda students are prepared for the new look of education.

Texas S Ta R Chart

  • 1.
    Texas STaR ChartSchoolTechnology and ReadinessMatagorda ISD – Matagorda ElementaryPresenter: Susan PhillipsAgenda:Introduction to STaRSTaR’s Four Main Measurements & RatingsThree year comparison of MISD, Matagorda ElementarySummary RecommendationsConclusion
  • 2.
    Introduction to theSTaR ChartWho?Texas Education Agencys’ EducationalAdvisory Committee (ETAC) developedit in response to the Long-Range Planfor Technology, 2006-2020.
  • 3.
    Introduction to theSTaR Chart What? An online resource for teachers to selfassess our campus’ and district’sprogress towards integratingtechnology into every classroom and allcurriculum.
  • 4.
    Introduction to theSTaR ChartWhere?Online, can be accessed through a shortcuton our website under resourcesSchool or homeAt your preferencewww.tea.state.tx.us/starchart
  • 5.
    Introduction to theSTaR ChartWhen?Annually, each school yearA requirement as of 2006-2007 yearOn your ownAdministration prefers October
  • 6.
    Introduction to theSTaR ChartWhy?It provides us with a standard formeasuring our progress toward NCLB’s TitleII, Part Drequirement that all students aretechnological literate by the end of 8thgrade. It identifies our campus needs!It’s required for funding!
  • 7.
    Introduction to theSTaR ChartHow?You can complete online training here:..\..\Desktop\Teacher STaR Chart Instructions(2).pdf
  • 8.
    Four Key Areasof MeasurementNumber 1: Teaching and LearningStudent mastery of Tech TEKS (PreK-12)
  • 9.
  • 10.
  • 11.
    How often andhow is digital content integrated into the instructional settingPatterns of classroom useFour Key Areas of MeasurementNumber 2 : Educator Preparation and DevelopmentAccess to Professional Development, including onlineModels for Professional Development, including onlineProfessional Development for online learningContent of Professional DevelopmentCapabilities of Educators (SBEC)Levels of understanding and patterns
  • 12.
    Four Key Areasof MeasurementNumber 3: Leadership, Administration, andInstructional SupportLeadership and visionPlanning of instructional supportCommunication and collaboration (PLCs)BudgetLeadership and support for online learning
  • 13.
    Four Key Areasof MeasurementNumber 4: Infrastructure for TechnologyNumber of students per computerInternet access, connectivity, speed, LAN, WANAdditional classroom technology (not overheads)Technical support (repairs, training, timeliness)CapacityDistance learning
  • 14.
    Levels of ProgressEarlyTechDeveloping TechAdvanced TechTarget Tech
  • 15.
    MISD’s Matagorda Elementary3-year Comparison6-8 points equal Early Tech9-14 points equal Developing Tech15-20 points equal Advance Tech21-24 points equal Target Tech
  • 16.
  • 17.
    WHERE DO WEGO NOW?We have to work with our PLCs to make our education programs full of technology!We need to align goals, curriculum, instructional practices, formative and summative assessments, and technology!Learn to understand what it means to live and learn in a digital world and apply those techniques in our learningenvironments so our Matagorda students are prepared for the new look of education.

Editor's Notes

  • #13 Early Tech, let’s say under Teaching and Learning would look like this. The instruction style is teacher centered (lecture, perhaps) and student use software mainly for skill and drill for TEKS purposes.Developing Tech, under infrastructure, means that anywhere from 5-9 students are using one computer. Internet connections work in about ½ of the classrooms and library. Advanced Tech, let’s say, under teaching and learning means that the teacher is a facilitator and students are working with classmates to gather information, synthizize it with peers, and solve real-world problems. Technology is embedded in subjects and Tech TEKS are being met.Target Tech, for instance with administration and support would been that our CIP is focused on student success. We’d have campus instructional support staff to help with technology issues, and that several sources of funding, such as E-Rate, Tech allotments, are available.
  • #14 When we complete our teacher surveys, the results are tabulated into key area totals.
  • #15 You are looking at key area totals that I’ve used to create this graph. You can send that there is a consistent, steady growth under “Teaching & Learning.” “Educator Preparation & Development” has remained consistently as a developing technology for us. “Leadership, Administration, & Instructional Support” has increased and remained at an advanced technology stage for the last two years. Interestingly our infrastructure was at the targeted goals in 2007-2008, but decreased a level last year. As we are aware, we have had tremendous problems with infrastructure and have been unable to use Waterford and Voyager online, as well as have working printers