Downloaded 47 times


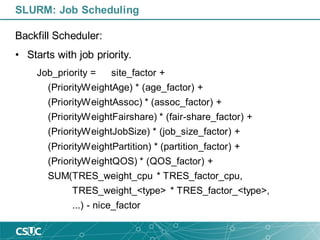
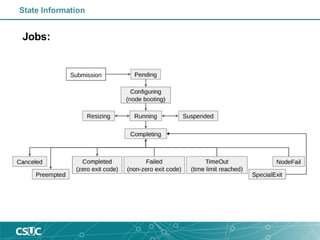
![• sinfo – Report system status (nodes, queues, etc.).
PARTITION AVAIL TIMELIMIT NODES STATE NODELIST
rest up infinite 3 idle~ pirineusgpu[1-2],pirineusknl1
rest up infinite 1 idle canigo2
std* up infinite 11 idle~ pirineus[14,19-20,23,25-26,29-30,33-34,40]
std* up infinite 18 mix pirineus[13,15-16,18,21-22,27-28,35,38-39,41-45,48-49]
std* up infinite 7 alloc pirineus[17,24,31,36-37,46-47]
gpu up infinite 2 alloc pirineusgpu[3-4]
knl up infinite 3 idle~ pirineusknl[2-4]
mem up infinite 1 mix canigo1
class_a up infinite 8 mix canigo1,pirineus[1-7]
class_a up infinite 1 alloc pirineus8
class_b up infinite 8 mix canigo1,pirineus[1-7]
class_b up infinite 1 alloc pirineus8
class_c up infinite 8 mix canigo1,pirineus[1-7]
class_c up infinite 1 alloc pirineus8
std_curs up infinite 5 idle~ pirineus[9-12,50]
gpu_curs up infinite 2 idle~ pirineusgpu[1-2]
SLURM: Commands](https://image.slidesharecdn.com/introductiontoslurm-191009084120/85/Introduction-to-SLURM-16-320.jpg)
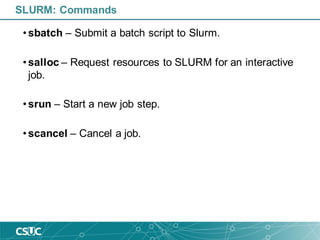
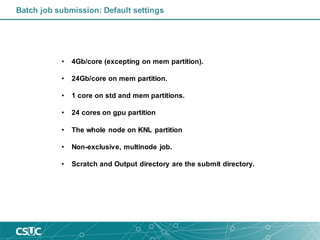
![1193936 std g09d1 upceqt04 PD 0:00 1 16 32G (Priority)
1195916 gpu A2B2_APO_n ubator01 PD 0:00 1 24 3900M (Priority)
1195915 gpu A2B2_APO_n ubator01 PD 0:00 1 24 3900M (Priority)
1195920 gpu A2B2_APO_n ubator01 PD 0:00 1 24 3900M (Priority)
1195927 gpu uncleaved_ ubator02 PD 0:00 1 24 3900M (Priority)
1195928 gpu uncleaved_ ubator02 PD 0:00 1 24 3900M (Priority)
1195929 gpu cleaved_wt ubator02 PD 0:00 1 24 3900M (Priority)
1138005 std U98-CuONN1 imoreira PD 0:00 1 12 3998M (Priority)
1195531 std g09d1 upceqt04 PD 0:00 1 16 32G (Priority)
1195532 std g09d1 upceqt04 PD 0:00 1 16 32G (Priority)
1195533 std g09d1 upceqt04 PD 0:00 1 16 32G (Priority)
1195536 std g09d1 upceqt04 PD 0:00 1 16 32G (Priority)
1195597 std sh gomollon R 20:04:04 4 24 6000M pirineus[31,38,44,47]
1195579 class_a rice crag49366 R 6:44:45 1 8 3998M pirineus5
1195576 class_a rice crag49366 R 6:36:48 1 8 3998M pirineus2
1195578 class_a rice crag49366 R 6:37:53 1 8 3998M pirineus4
• squeue – Report job and job step status.
SLURM: Commands](https://image.slidesharecdn.com/introductiontoslurm-191009084120/85/Introduction-to-SLURM-18-320.jpg)
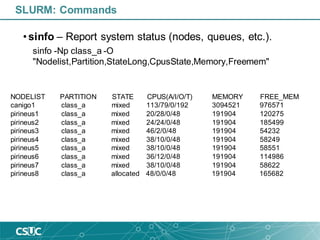
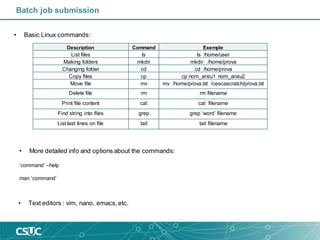
![JobId=1195597 JobName=sh
UserId=gomollon(80128) GroupId=csuc(10000) MCS_label=N/A
Priority=100176 Nice=0 Account=csuc QOS=test
JobState=RUNNING Reason=None Dependency=(null)
Requeue=1 Restarts=0 BatchFlag=0 Reboot=0 ExitCode=0:0
RunTime=20:09:58 TimeLimit=5-00:00:00 TimeMin=N/A
SubmitTime=2019-10-07T12:21:29 EligibleTime=2019-10-07T12:21:29
StartTime=2019-10-07T12:21:29 EndTime=2019-10-12T12:21:30 Deadline=N/A
PreemptTime=None SuspendTime=None SecsPreSuspend=0
Partition=std AllocNode:Sid=login2:20262
ReqNodeList=(null) ExcNodeList=(null)
NodeList=pirineus[31,38,44,47]
BatchHost=pirineus31
NumNodes=4 NumCPUs=24 NumTasks=24 CPUs/Task=1 ReqB:S:C:T=0:0:*:*
TRES=cpu=24,mem=144000M,node=4
Socks/Node=* NtasksPerN:B:S:C=0:0:*:* CoreSpec=*
MinCPUsNode=1 MinMemoryCPU=6000M MinTmpDiskNode=0
Features=(null) Gres=(null) Reservation=(null)
OverSubscribe=OK Contiguous=0 Licenses=(null) Network=(null)
Command=(null)
WorkDir=/home/gomollon
Power=
SLURM: Commands](https://image.slidesharecdn.com/introductiontoslurm-191009084120/85/Introduction-to-SLURM-20-320.jpg)


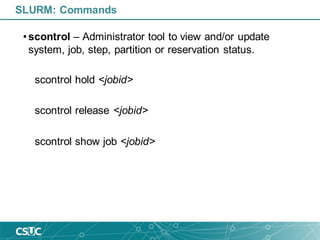
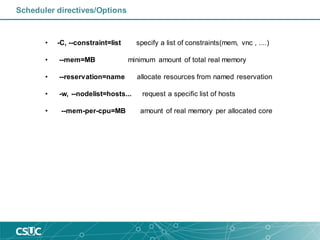
![Login on CSUC infrastructure
• Login
ssh –p 2122 username@hpc.csuc.cat
• Transferfiles
scp -P 2122 local_file username@hpc.csuc.cat:[path to your folder]
sftp -oPort=2122 username@hpc.csuc.cat
• Useful paths
Name Variable Availability Quote/project Time limit Backup
/home/$user $HOME global 4 GB unlimited Yes
/scratch/$user $SCRATCH global unlimited 30 days No
/scratch/$user/tmp/jobid $TMPDIR Local to each node job file limit 1 week No
/tmp/$user/jobid $TMPDIR Local to each node job file limit 1 week No
• Get HC consumption
consum -a ‘any’ (group consumption)
consum -a ‘any’ -u ‘nom_usuari’ (user consumption)](https://image.slidesharecdn.com/introductiontoslurm-191009084120/85/Introduction-to-SLURM-24-320.jpg)
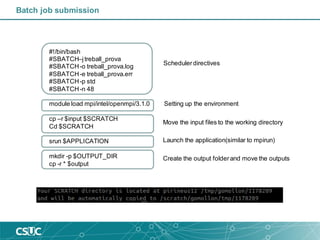
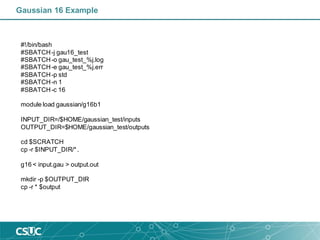
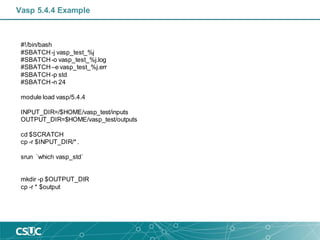
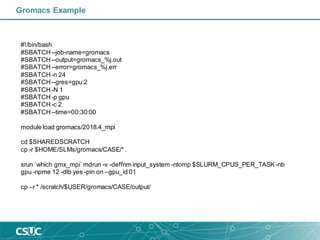
![Scheduler directives/Options
• -c, --cpus-per-task=ncpus number of cpus required per task
• --gres=list required generic resources
• -J, --job-name=jobname name of job
• -n, --ntasks=ntasks number of tasks to run
• --ntasks-per-node=n number of tasks to invoke on each node
• -N, --nodes=N number of nodes on which to run (N = min[-max])
• -o, --output=out file for batch script's standard output
• -p, --partition=partition partition requested
• -t, --time=minutes time limit (format: dd-hh:mm)](https://image.slidesharecdn.com/introductiontoslurm-191009084120/85/Introduction-to-SLURM-27-320.jpg)

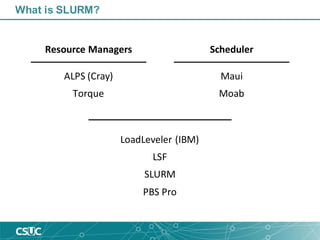
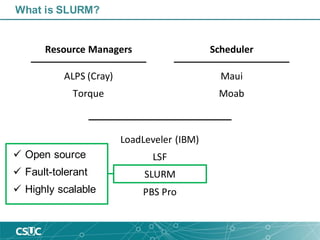
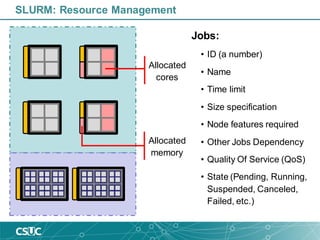
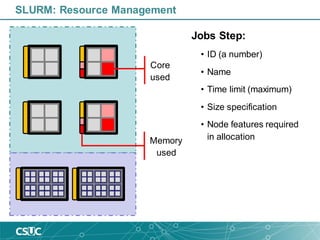
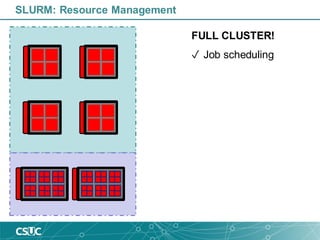
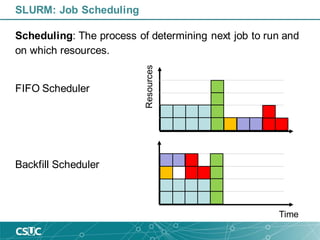
The document provides an introduction to SLURM, a job scheduling system used in Linux clusters for managing resource allocation, job execution, and monitoring. It outlines SLURM's capabilities, including job scheduling mechanisms such as FIFO and backfill scheduling, and provides commands for users to interact with the system, like submitting jobs and checking resource availability. Additionally, it offers batch job submission examples and best practices for resource management.