![Introduction to Simulation:
The Athematic of Uncertainty
May 15th, 2014
We
will
get
started
3
–
5
minutes
past
the
hour
“Our
culture
encodes
a
strong
bias
either
to
neglect
or
ignore
VARIATION.
We
tend
to
focus
instead
on
measures
of
central
tendency,
and
as
a
result
we
make
some
terrible
mistakes,
o>en
with
considerable
prac?cal
import[ance].”
-‐Stephen
Jay
Gould,
naturalist,
1941-‐2002
Presented by:
Andrew Pulvermacher
Director | Decision Sciences](https://image.slidesharecdn.com/pawebinar305-140515122216-phpapp01/85/Introduction-to-Simulation-Predictive-Analytics-1-320.jpg)

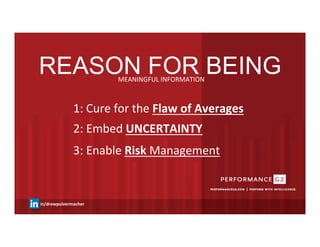

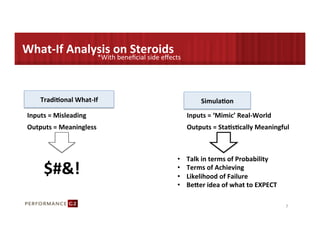


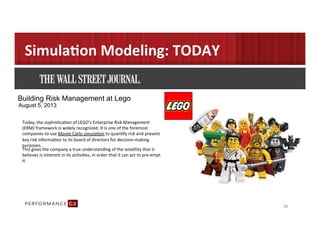


The document discusses the importance of simulation modeling as a tool to manage uncertainty and improve decision-making by highlighting its benefits in risk management and what-if analysis. It emphasizes the flaws of relying on traditional averages and point estimates, advocating for a probabilistic approach to understanding potential outcomes. The presentation also showcases real-world applications, such as LEGO's use of Monte Carlo simulation for enterprise risk management.


![[DSC Europe 25] Milos Belcevic - Product Professional's Journey to Full-Stack...](https://cdn.slidesharecdn.com/ss_thumbnails/1zovd6fgsycdg4wvgvls-milos-belcevic-product-professionals-journey-to-full-stack-product-developer-260123083019-d993120d-thumbnail.jpg?width=640&height=640&fit=bounds)


