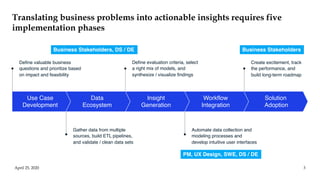
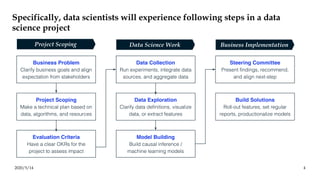
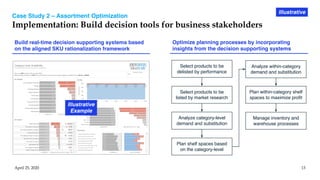
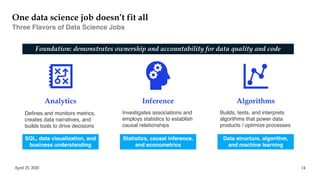
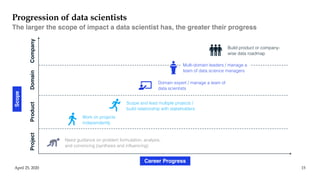
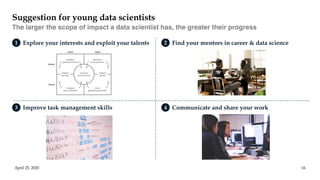
SOURCE: Source
Data Science in Business:
Value Creation from Big Data
David Huang, April 25th, 2020
Today’s Speaker
April 25, 2020 2
Academic Experience
• Incoming PhD Student, Harvard Business School
• MS in Statistics, National Taiwan University
• BS in Quantitative Finance, National Tsing Hua University
Work Experience
• Data Lead, Migo.tv
• Consultant, Mastercard Data & Services
• Data Scientist, InrayTek Corporation
Specialized Areas
• Customer Lifecycle Management
• Personalized Customer Experience
• Experimentation and Causal Inference
David Huang
Translating business problems into actionable insights requires five
implementation phases
April 25, 2020 3
Solution
Adoption
Workflow
Integration
Insight
Generation
Data
Ecosystem
Use Case
Development
Define valuable business
questions and prioritize based
on impact and feasibility
Gather data from multiple
sources, build ETL pipelines,
and validate / clean data sets
Define evaluation criteria, select
a right mix of models, and
synthesize / visualize findings
Automate data collection and
modeling processes and
develop intuitive user interfaces
Create excitement, track
the performance, and
build long-term roadmap
Business Stakeholders, DS / DE
PM, UX Design, SWE, DS / DE
Business Stakeholders
Specifically, data scientists will experience following steps in a data
science project
2020/5/14 4
Business Problem
Clarify business goals and align
expectation from stakeholders
Project Scoping
Make a technical plan based on
data, algorithms, and resources
Data Collection
Run experiments, integrate data
sources, and aggregate data
Evaluation Criteria
Have a clear OKRs for the
project to assess impact
Data Exploration
Clarify data definitions, visualize
data, or extract features
Model Building
Build causal inference /
machine learning models
Steering Committee
Present findings, recommend,
and align next-step
Build Solutions
Roll-out features, set regular
reports, productionalize models
Project Scoping Data Science Work Business Implementation
Case Study 1 – Employee Training Program
Program evaluation using causal inference
April 25, 2020 5
A leading insurance company aims to launch a substantial amount of employee training programs for its sales
professionals to generate more signed contracts and improve overall customer satisfaction.
Situation
What was the overall impact of
the training program?
Measurement
Which types of employees will
respond the best?
Targeting Tailoring
How can the program be tailored
for maximum impact?
How to allocate the remaining budget of the training to maximize the impact?
Illustrative
$200
$250
$300
$350
$400
$450
-9 -8 -7 -6 -5 -4 -3 -2 -1 0 1 2 3 4 5 6
Monthly Total Sales ($K)
Case Study 1 – Employee Training Program
Compare trained employees to similar controls
April 25, 2020 6
Employee didn’t receive trainings
Employee participated in trainings
Test
Matched DiD Estimator
• Applied common causal inference techniques (propensity score matching, difference-in-difference,
synthetic control, etc.) to measure the incremental impact of employee training programs
Training Program
Incremental
Impact
Illustrative
Case Study 1 – Employee Training Program
Target on employees predicted to respond the best
April 25, 2020 7
• Identify employee heterogeneity and predict the sales lift based on employee features
0.0%
1.0%
2.0%
3.0%
4.0%
5.0%
6.0%
7.0%
8.0%
9.0%
< $150K $150 -
$300K
$300 -
$450K
$450 -
$600K
> $600K
SalesLift
Employee Monthly Sales
Identify statistically significant drivers of sales lift
by regression / non-parametric tests
Illustrative
Build predictive models on sales lift for each
individual and prioritize trainings for employees
Driver
SalesLift
= Employee
Case Study 1 – Employee Training Program
Tailor training programs to maximize the impact
April 25, 2020 8
• Split by test attributes or categories / deep dive into outliers (both quantitatively and qualitatively)
Property
Insurance
Investment
Link
Product
Health
Insurance
Life
Insurance
-10% -5% 0% 5% 10% 15%
Sales Lift for Different Product Lines
Driver
SalesLift
Outlier with Negative Sales Lift
Illustrative
Interview outliers to understand
what has changed after the training
Case Study 2 – Assortment Optimization
Leverage point-of-sale data to optimize assortment
April 25, 2020 9
Illustrative
A leading retailer aims to optimize their assortment to improve margins and reduce warehouse complexity.
They received millions of transactions on a monthly basis but didn’t know how to leverage the data.
Situation
1 SKU Rationalization
• Evaluate an SKU’s performance along dimensions such
as financial and cost performance, customer
perception, and strategic importance
• Assess a new product’s expected incremental financial
contribution and novelty value for customers
2 Space Allocation
• Determine optimal choice of space per category and
SKU allocation at store level based on demand from
consumers, substitutions, and financial performance
Case Study 2 – Assortment Optimization
Develop measurement system to rationalize SKU performance
April 25, 2020 10
Illustrative
A Economic Performance
• Sales per Store per Day / Category Contribution
• Gross Margin
• Attached Sales of baskets containing this SKU
C Value to Customers
• Units not be relocated to other SKUs in the same
category when the product is delisted
• % of transactions with the product when customers
purchase SKUs in the same category
B Cost to Serve
• End-to-end logistics costs per SKU per store
• Share of SKUs thrown away
• Share of time when product is out of stock
D Strategic Objectives
• Strategically important product attributes
• Strategically important target customer group
StrategicValueIndex
Economic Performance Index
Keep for sure
Potentially keep
Potentially delist
Delist for sure
Performance of SKUs
Case Study 2 – Assortment Optimization
Space Allocation: Maximize total category gross profit
April 25, 2020 11
Illustrative
Impression Effect: Sales is affected by facings of all
products in the same categories
$250K $300K $180K
$220K $350K $220K
Profit of Product j = Total Category Sales x Effective Demand Rate of Product j x Margin of Product j
Substitution Effect: Sales is affected by current
market demands of other similar products
DemandforProductj
Demand for Other Product
Case Study 2 – Assortment Optimization
Space Allocation: leverage convex optimization techniques
April 25, 2020 12
Illustrative
Optimization
Problem
• 𝐺!: average gross profit from product j
• 𝑓!: the number of facings allocated to product j
• 𝑤!: the width of a facing of product j
1 Decision Function and Variables
• 𝐷!(𝐟, 𝐝): the effective demand rate to product j
◦ Impression effect is captured by 𝐟, the facing
allocation of all products 𝑓!, … , 𝑓"
◦ Substitution effect is captured by 𝐝, the original
demand rate of all products 𝑑!, … , 𝑑"
2 Demand Rate Estimation
GrossProfit
Facings / Shelf Space
Product 2
Product 1
Product 3
Simulation of Gross Profits
Case Study 2 – Assortment Optimization
Implementation: Build decision tools for business stakeholders
April 25, 2020 13
Illustrative
Build real-time decision supporting systems based
on the aligned SKU rationalization framework
Illustrative
Example
Optimize planning processes by incorporating
insights from the decision supporting systems
Select products to be
delisted by performance
Select products to be
listed by market research
Analyze category-level
demand and substitution
Analyze within-category
demand and substitution
Plan shelf spaces based
on the category-level
Plan within-category shelf
spaces to maximize profit
Manage inventory and
warehouse processes
One data science job doesn’t fit all
Three Flavors of Data Science Jobs
April 25, 2020 14
Defines and monitors metrics,
creates data narratives, and
builds tools to drive decisions
Analytics
Investigates associations and
employs statistics to establish
causal relationships
Inference
Builds, tests, and interprets
algorithms that power data
products / optimize processes
Algorithms
Foundation: demonstrates ownership and accountability for data quality and code
SQL, data visualization, and
business understanding
Statistics, causal inference,
and econometrics
Data structure, algorithm,
and machine learning
Progression of data scientists
The larger the scope of impact a data scientist has, the greater their progress
April 25, 2020 15
Scope
Career Progress
Need guidance on problem formulation, analysis,
and convincing (synthesis and influencing)
Work on projects
independently
Scope and lead multiple projects /
build relationship with stakeholders
Domain expert / manage a team of
data scientists
Multi-domain leaders / manage a
team of data science managers
Build product or company-
wise data roadmap
ProjectProductDomainCompany
Suggestion for young data scientists
The larger the scope of impact a data scientist has, the greater their progress
April 25, 2020 16
1 Explore your interests and exploit your talents 2 Find your mentors in career & data science
3 Improve task management skills 4 Communicate and share your work
SOURCE: Source
Thank you!

Data Science in Business: Value Creation of Business

  • 1.
    SOURCE: Source Data Sciencein Business: Value Creation from Big Data David Huang, April 25th, 2020
  • 2.
    Today’s Speaker April 25,2020 2 Academic Experience • Incoming PhD Student, Harvard Business School • MS in Statistics, National Taiwan University • BS in Quantitative Finance, National Tsing Hua University Work Experience • Data Lead, Migo.tv • Consultant, Mastercard Data & Services • Data Scientist, InrayTek Corporation Specialized Areas • Customer Lifecycle Management • Personalized Customer Experience • Experimentation and Causal Inference David Huang
  • 3.
    Translating business problemsinto actionable insights requires five implementation phases April 25, 2020 3 Solution Adoption Workflow Integration Insight Generation Data Ecosystem Use Case Development Define valuable business questions and prioritize based on impact and feasibility Gather data from multiple sources, build ETL pipelines, and validate / clean data sets Define evaluation criteria, select a right mix of models, and synthesize / visualize findings Automate data collection and modeling processes and develop intuitive user interfaces Create excitement, track the performance, and build long-term roadmap Business Stakeholders, DS / DE PM, UX Design, SWE, DS / DE Business Stakeholders
  • 4.
    Specifically, data scientistswill experience following steps in a data science project 2020/5/14 4 Business Problem Clarify business goals and align expectation from stakeholders Project Scoping Make a technical plan based on data, algorithms, and resources Data Collection Run experiments, integrate data sources, and aggregate data Evaluation Criteria Have a clear OKRs for the project to assess impact Data Exploration Clarify data definitions, visualize data, or extract features Model Building Build causal inference / machine learning models Steering Committee Present findings, recommend, and align next-step Build Solutions Roll-out features, set regular reports, productionalize models Project Scoping Data Science Work Business Implementation
  • 5.
    Case Study 1– Employee Training Program Program evaluation using causal inference April 25, 2020 5 A leading insurance company aims to launch a substantial amount of employee training programs for its sales professionals to generate more signed contracts and improve overall customer satisfaction. Situation What was the overall impact of the training program? Measurement Which types of employees will respond the best? Targeting Tailoring How can the program be tailored for maximum impact? How to allocate the remaining budget of the training to maximize the impact? Illustrative
  • 6.
    $200 $250 $300 $350 $400 $450 -9 -8 -7-6 -5 -4 -3 -2 -1 0 1 2 3 4 5 6 Monthly Total Sales ($K) Case Study 1 – Employee Training Program Compare trained employees to similar controls April 25, 2020 6 Employee didn’t receive trainings Employee participated in trainings Test Matched DiD Estimator • Applied common causal inference techniques (propensity score matching, difference-in-difference, synthetic control, etc.) to measure the incremental impact of employee training programs Training Program Incremental Impact Illustrative
  • 7.
    Case Study 1– Employee Training Program Target on employees predicted to respond the best April 25, 2020 7 • Identify employee heterogeneity and predict the sales lift based on employee features 0.0% 1.0% 2.0% 3.0% 4.0% 5.0% 6.0% 7.0% 8.0% 9.0% < $150K $150 - $300K $300 - $450K $450 - $600K > $600K SalesLift Employee Monthly Sales Identify statistically significant drivers of sales lift by regression / non-parametric tests Illustrative Build predictive models on sales lift for each individual and prioritize trainings for employees Driver SalesLift = Employee
  • 8.
    Case Study 1– Employee Training Program Tailor training programs to maximize the impact April 25, 2020 8 • Split by test attributes or categories / deep dive into outliers (both quantitatively and qualitatively) Property Insurance Investment Link Product Health Insurance Life Insurance -10% -5% 0% 5% 10% 15% Sales Lift for Different Product Lines Driver SalesLift Outlier with Negative Sales Lift Illustrative Interview outliers to understand what has changed after the training
  • 9.
    Case Study 2– Assortment Optimization Leverage point-of-sale data to optimize assortment April 25, 2020 9 Illustrative A leading retailer aims to optimize their assortment to improve margins and reduce warehouse complexity. They received millions of transactions on a monthly basis but didn’t know how to leverage the data. Situation 1 SKU Rationalization • Evaluate an SKU’s performance along dimensions such as financial and cost performance, customer perception, and strategic importance • Assess a new product’s expected incremental financial contribution and novelty value for customers 2 Space Allocation • Determine optimal choice of space per category and SKU allocation at store level based on demand from consumers, substitutions, and financial performance
  • 10.
    Case Study 2– Assortment Optimization Develop measurement system to rationalize SKU performance April 25, 2020 10 Illustrative A Economic Performance • Sales per Store per Day / Category Contribution • Gross Margin • Attached Sales of baskets containing this SKU C Value to Customers • Units not be relocated to other SKUs in the same category when the product is delisted • % of transactions with the product when customers purchase SKUs in the same category B Cost to Serve • End-to-end logistics costs per SKU per store • Share of SKUs thrown away • Share of time when product is out of stock D Strategic Objectives • Strategically important product attributes • Strategically important target customer group StrategicValueIndex Economic Performance Index Keep for sure Potentially keep Potentially delist Delist for sure Performance of SKUs
  • 11.
    Case Study 2– Assortment Optimization Space Allocation: Maximize total category gross profit April 25, 2020 11 Illustrative Impression Effect: Sales is affected by facings of all products in the same categories $250K $300K $180K $220K $350K $220K Profit of Product j = Total Category Sales x Effective Demand Rate of Product j x Margin of Product j Substitution Effect: Sales is affected by current market demands of other similar products DemandforProductj Demand for Other Product
  • 12.
    Case Study 2– Assortment Optimization Space Allocation: leverage convex optimization techniques April 25, 2020 12 Illustrative Optimization Problem • 𝐺!: average gross profit from product j • 𝑓!: the number of facings allocated to product j • 𝑤!: the width of a facing of product j 1 Decision Function and Variables • 𝐷!(𝐟, 𝐝): the effective demand rate to product j ◦ Impression effect is captured by 𝐟, the facing allocation of all products 𝑓!, … , 𝑓" ◦ Substitution effect is captured by 𝐝, the original demand rate of all products 𝑑!, … , 𝑑" 2 Demand Rate Estimation GrossProfit Facings / Shelf Space Product 2 Product 1 Product 3 Simulation of Gross Profits
  • 13.
    Case Study 2– Assortment Optimization Implementation: Build decision tools for business stakeholders April 25, 2020 13 Illustrative Build real-time decision supporting systems based on the aligned SKU rationalization framework Illustrative Example Optimize planning processes by incorporating insights from the decision supporting systems Select products to be delisted by performance Select products to be listed by market research Analyze category-level demand and substitution Analyze within-category demand and substitution Plan shelf spaces based on the category-level Plan within-category shelf spaces to maximize profit Manage inventory and warehouse processes
  • 14.
    One data sciencejob doesn’t fit all Three Flavors of Data Science Jobs April 25, 2020 14 Defines and monitors metrics, creates data narratives, and builds tools to drive decisions Analytics Investigates associations and employs statistics to establish causal relationships Inference Builds, tests, and interprets algorithms that power data products / optimize processes Algorithms Foundation: demonstrates ownership and accountability for data quality and code SQL, data visualization, and business understanding Statistics, causal inference, and econometrics Data structure, algorithm, and machine learning
  • 15.
    Progression of datascientists The larger the scope of impact a data scientist has, the greater their progress April 25, 2020 15 Scope Career Progress Need guidance on problem formulation, analysis, and convincing (synthesis and influencing) Work on projects independently Scope and lead multiple projects / build relationship with stakeholders Domain expert / manage a team of data scientists Multi-domain leaders / manage a team of data science managers Build product or company- wise data roadmap ProjectProductDomainCompany
  • 16.
    Suggestion for youngdata scientists The larger the scope of impact a data scientist has, the greater their progress April 25, 2020 16 1 Explore your interests and exploit your talents 2 Find your mentors in career & data science 3 Improve task management skills 4 Communicate and share your work
  • 17.