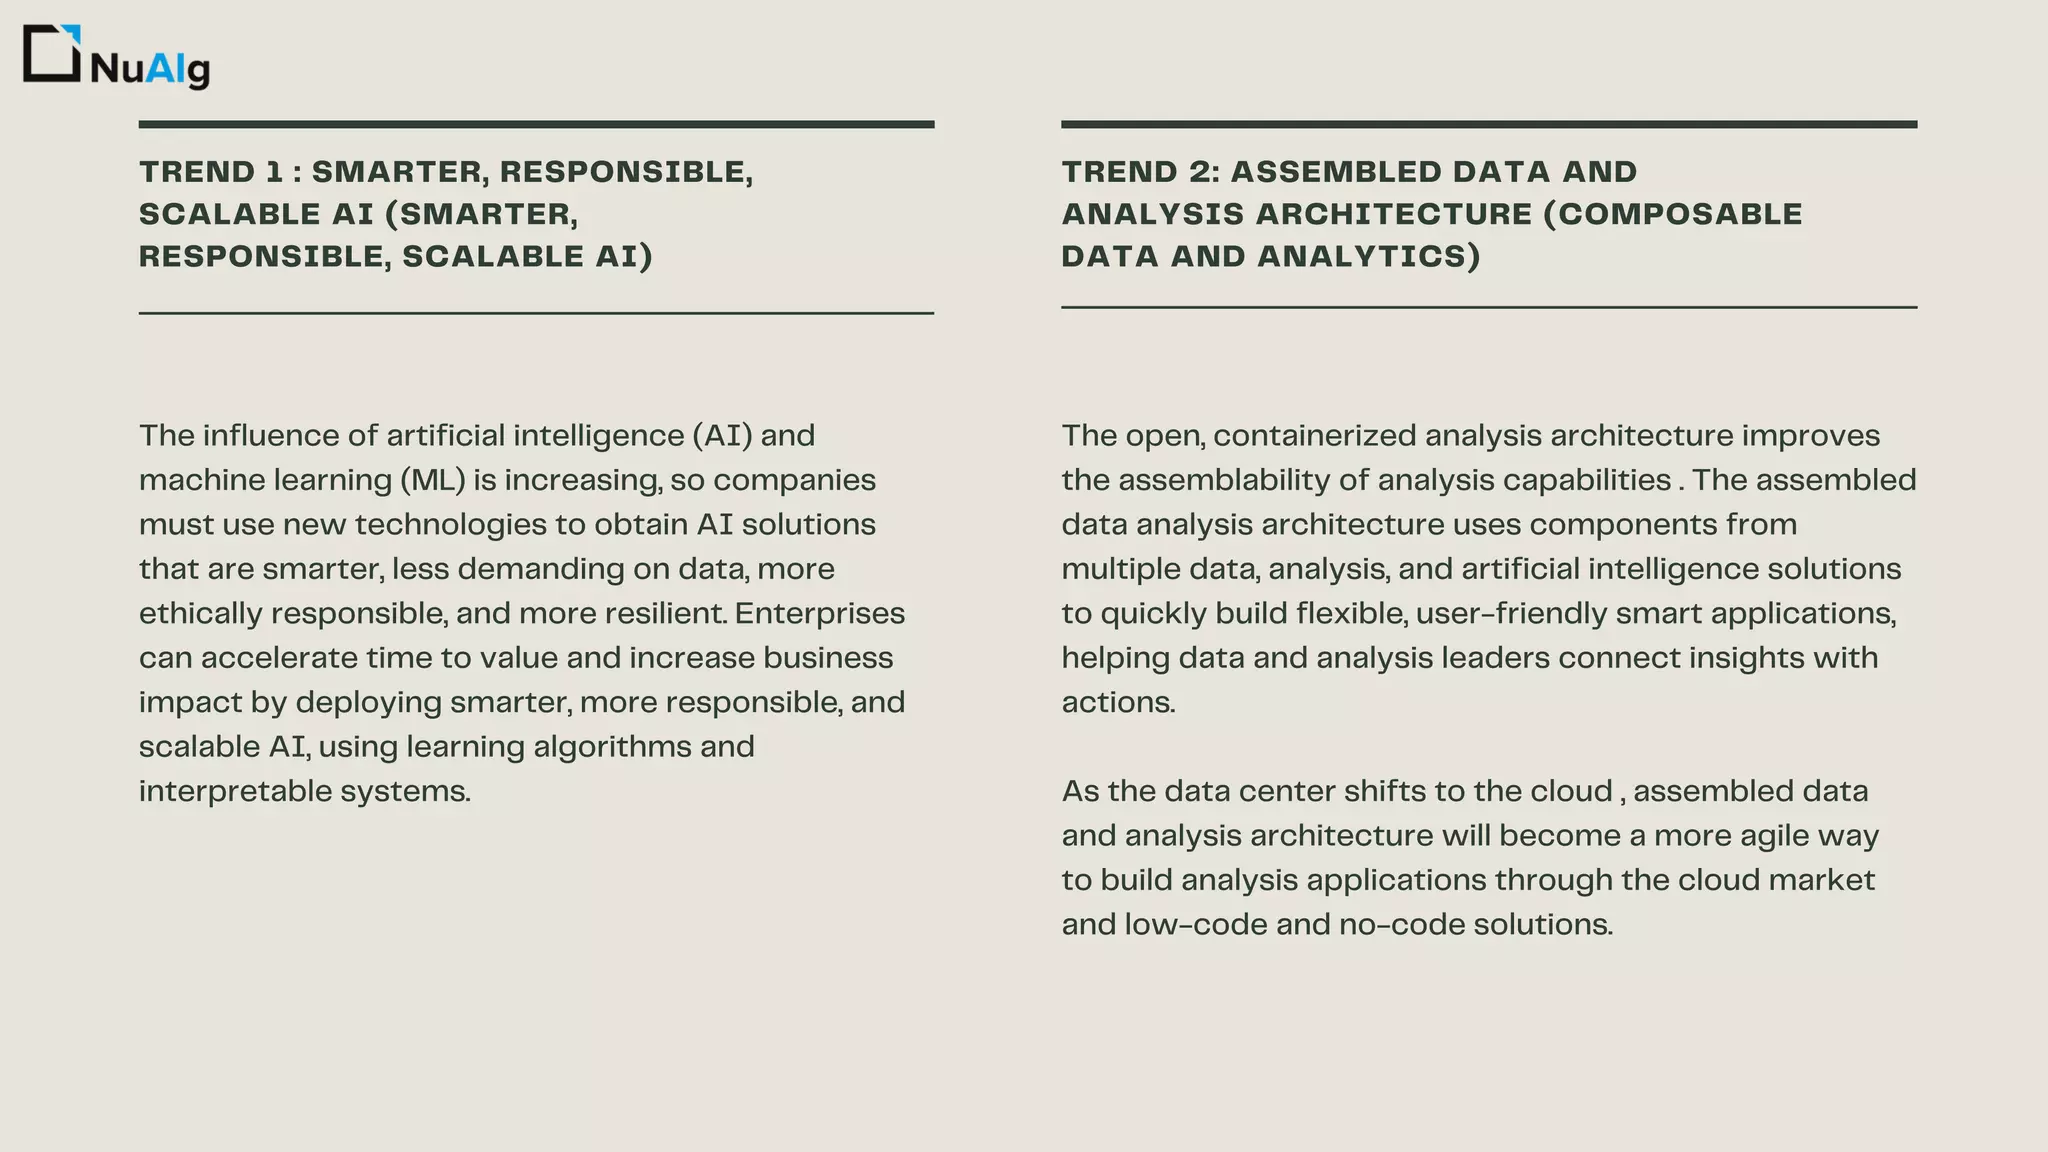
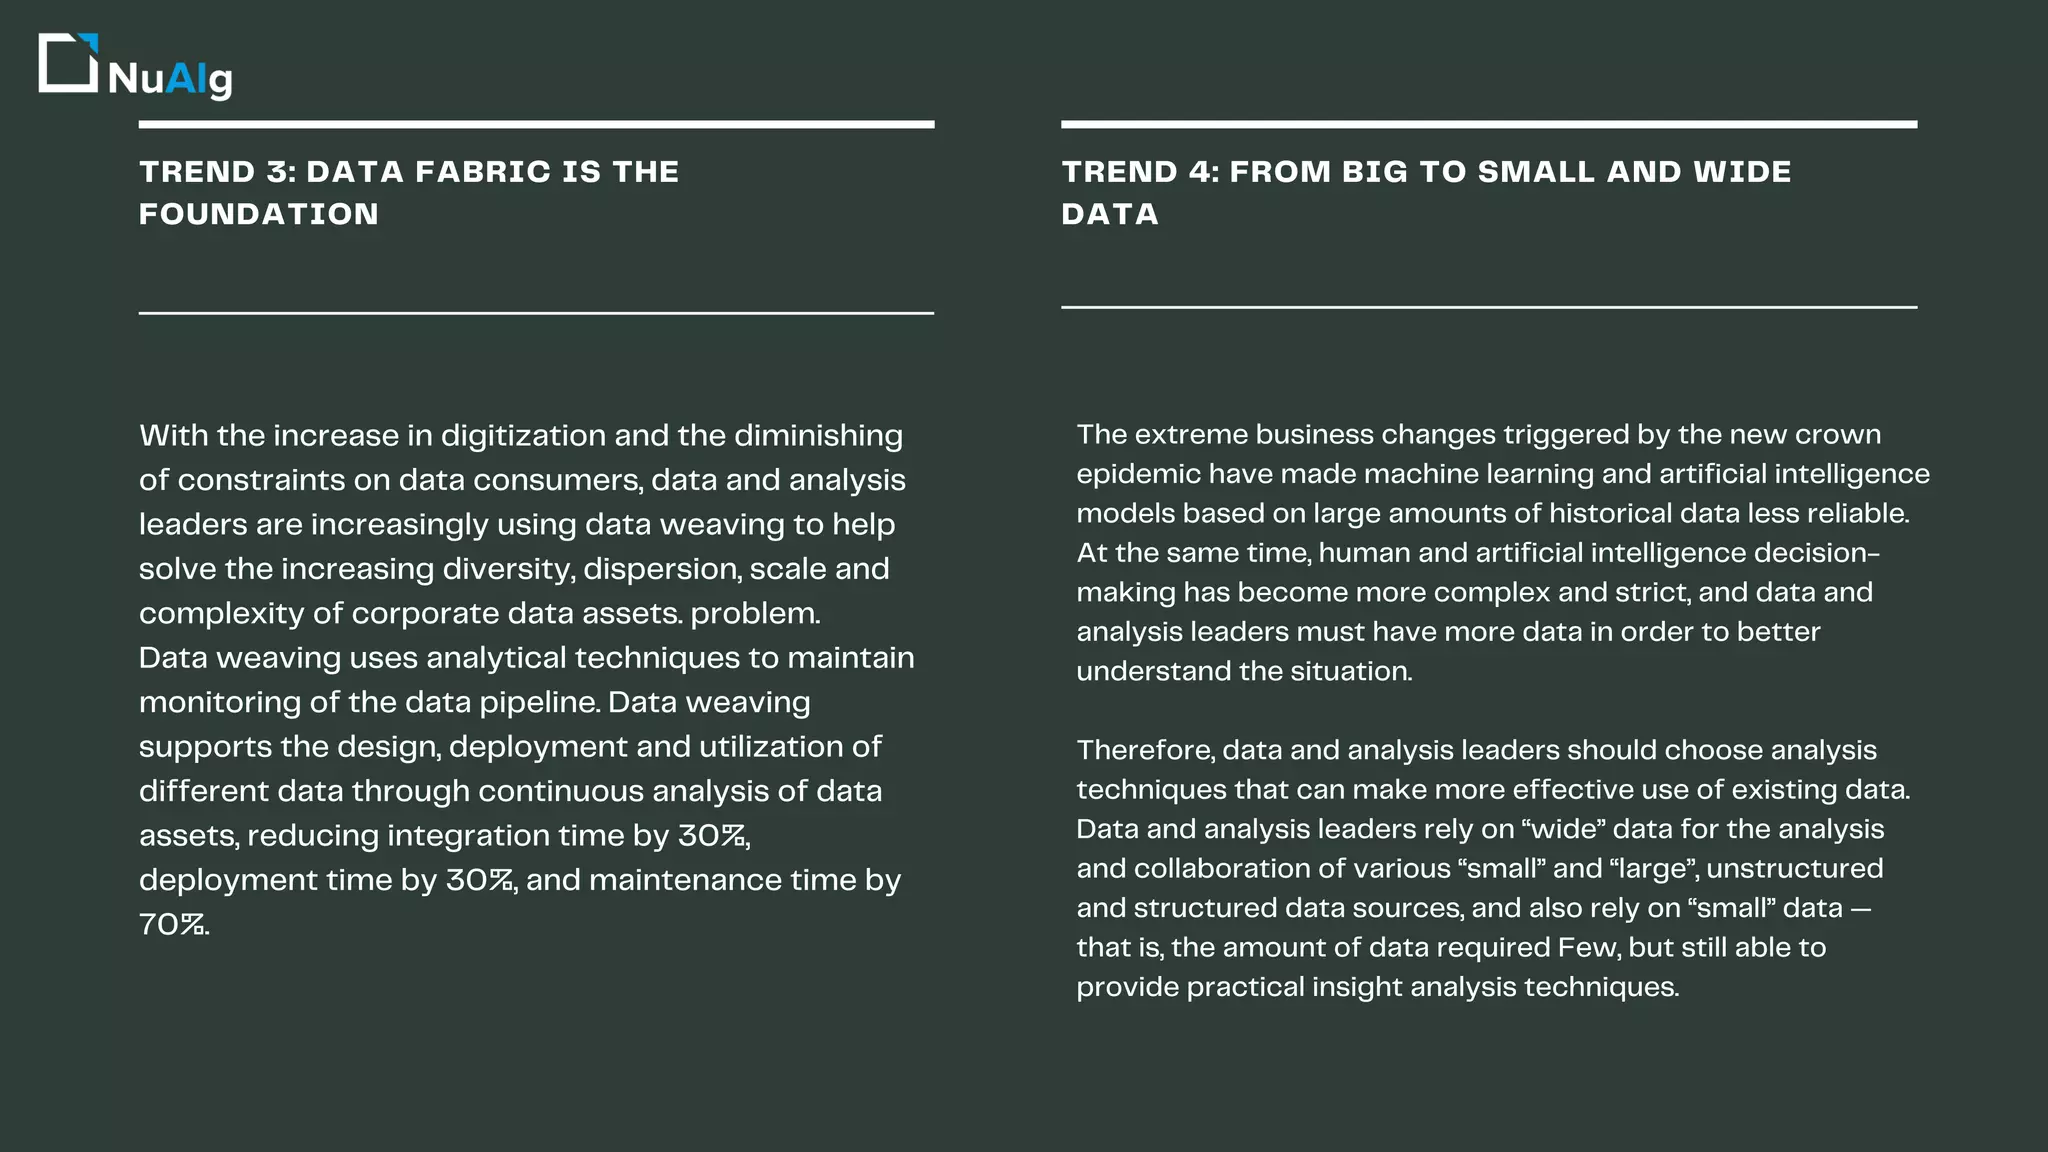
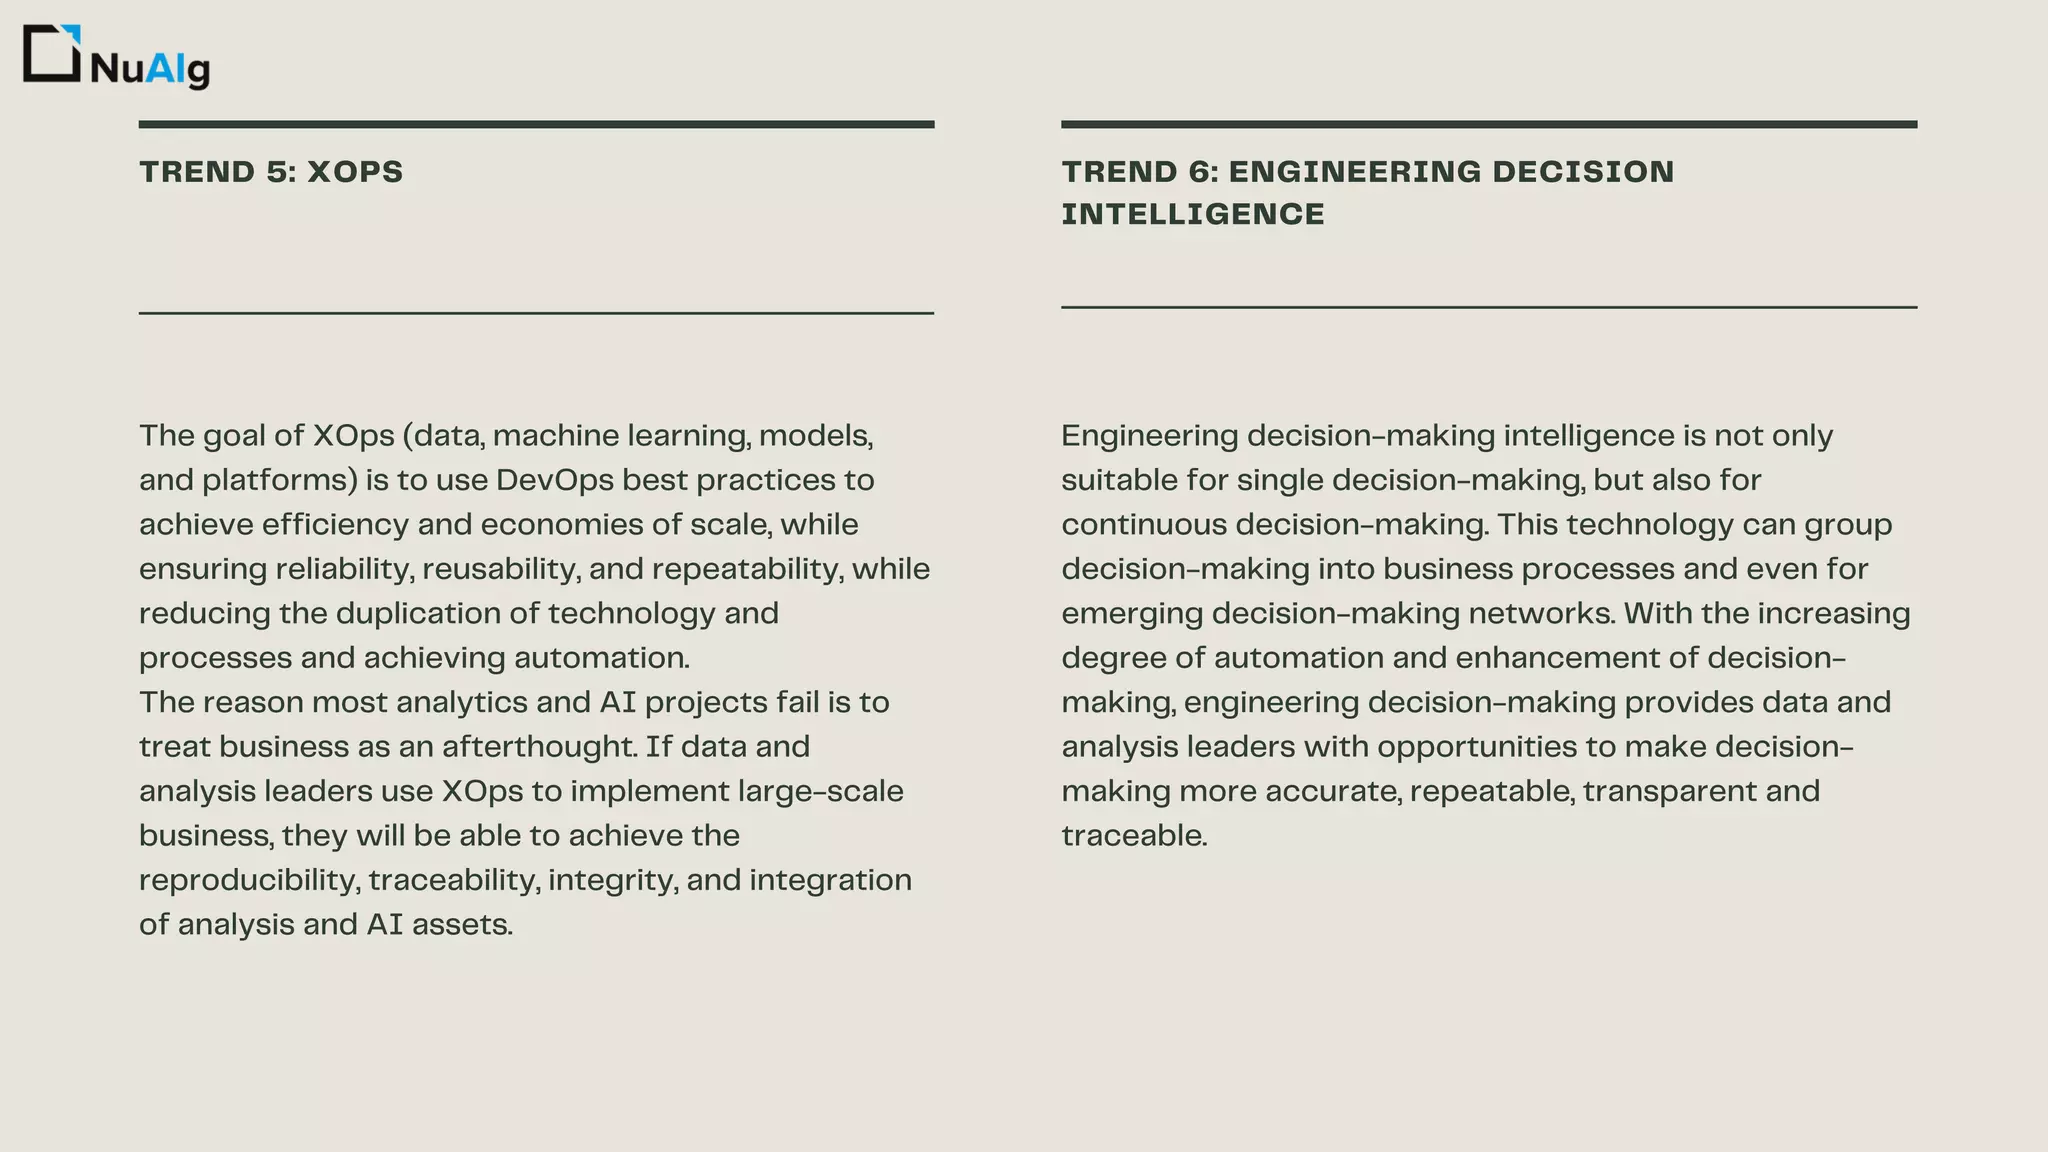
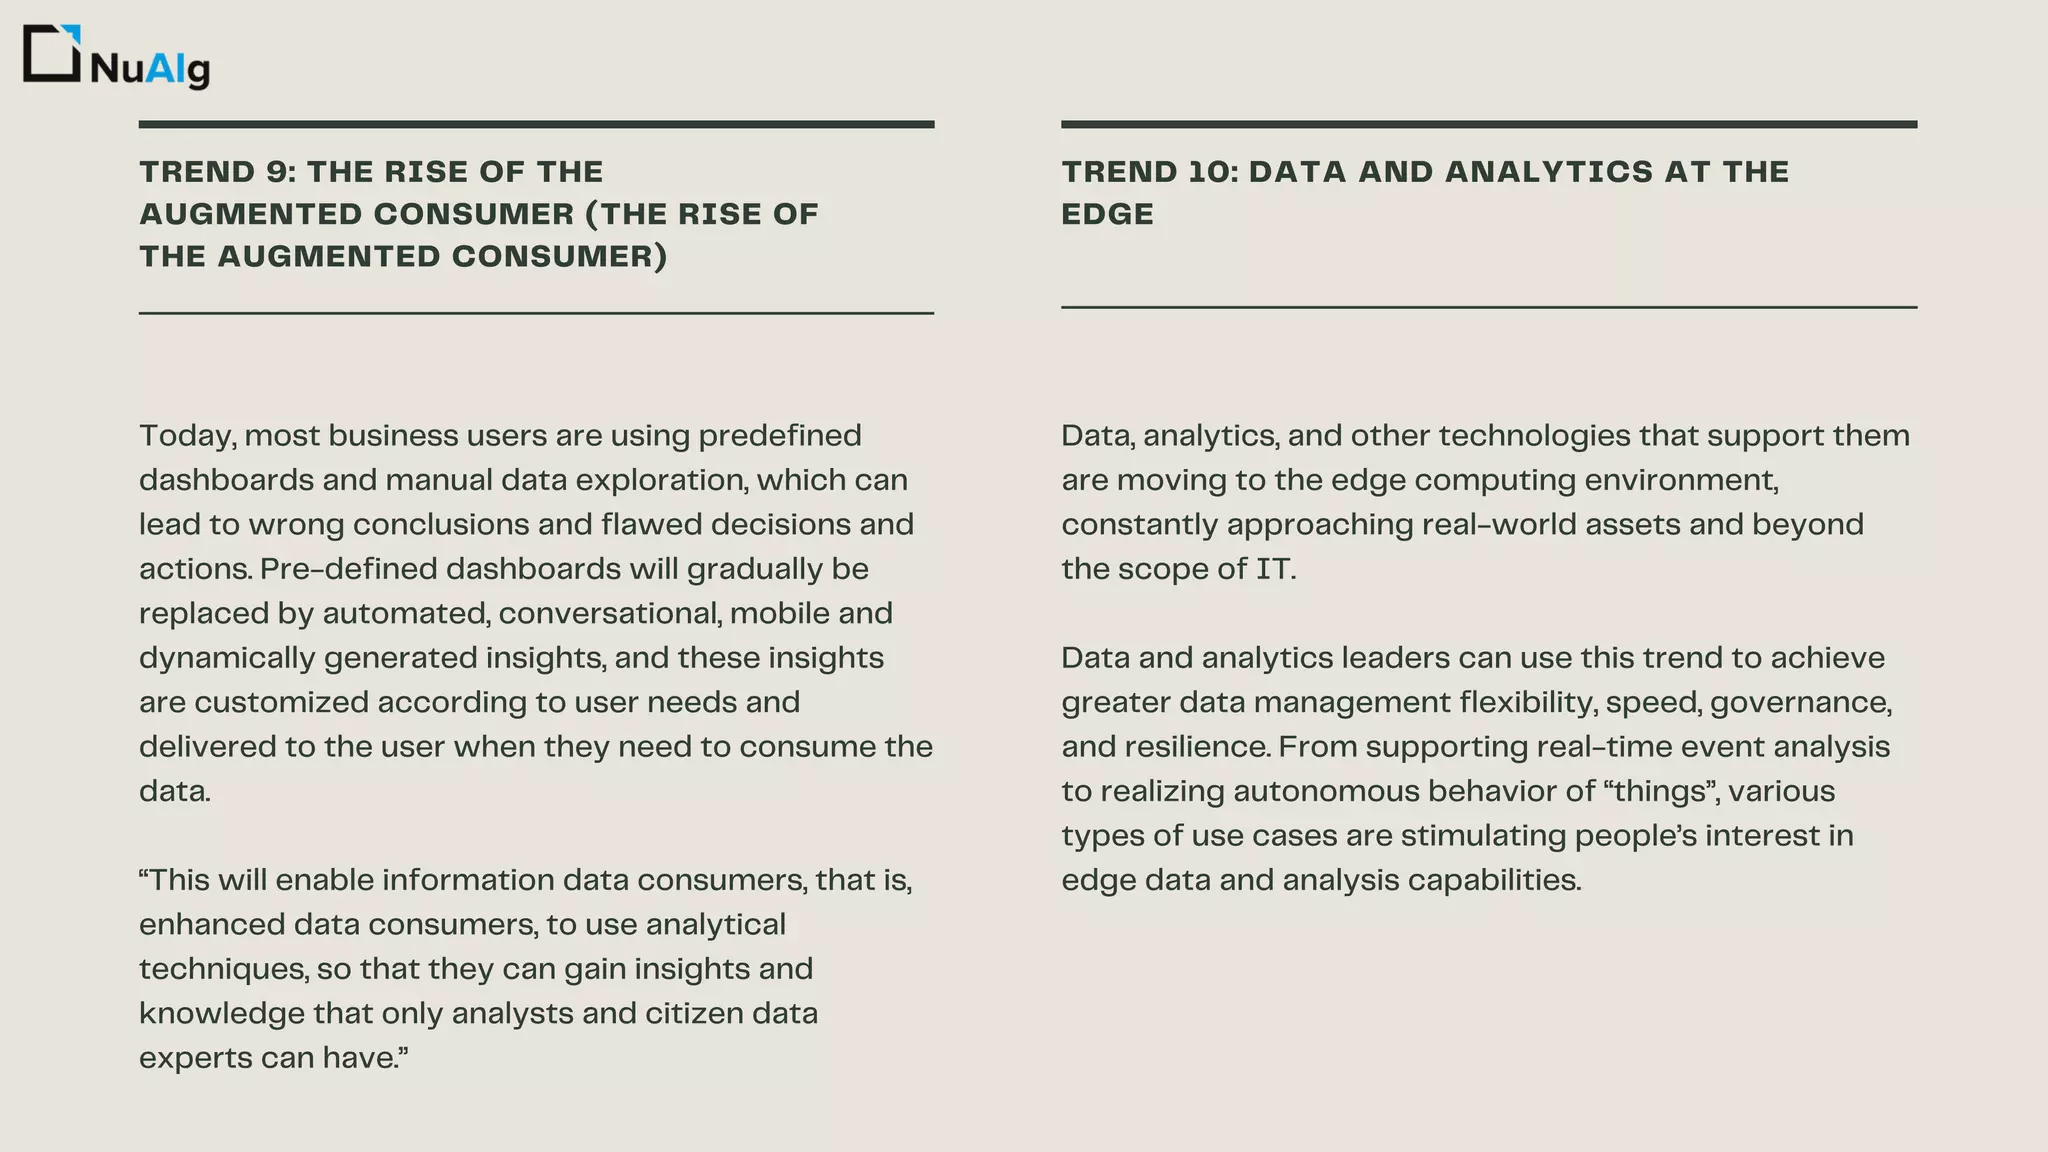
Top ten data
and analysis
technology
trends in 2021
Data and analytics leaders should make mission-
critical investments to accelerate their ability to
predict, transform, and respond based on these
ten trends.
The open, containerized analysis architecture improves
the assemblability of analysis capabilities . The assembled
data analysis architecture uses components from
multiple data, analysis, and artificial intelligence solutions
to quickly build flexible, user-friendly smart applications,
helping data and analysis leaders connect insights with
actions.
As the data center shifts to the cloud , assembled data
and analysis architecture will become a more agile way
to build analysis applications through the cloud market
and low-code and no-code solutions.
TREND 1 : SMARTER, RESPONSIBLE,
SCALABLE AI (SMARTER,
RESPONSIBLE, SCALABLE AI)
TREND 2: ASSEMBLED DATA AND
ANALYSIS ARCHITECTURE (COMPOSABLE
DATA AND ANALYTICS)
The influence of artificial intelligence (AI) and
machine learning (ML) is increasing, so companies
must use new technologies to obtain AI solutions
that are smarter, less demanding on data, more
ethically responsible, and more resilient. Enterprises
can accelerate time to value and increase business
impact by deploying smarter, more responsible, and
scalable AI, using learning algorithms and
interpretable systems.
TREND 3: DATA FABRIC IS THE
FOUNDATION
TREND 4: FROM BIG TO SMALL AND WIDE
DATA
With the increase in digitization and the diminishing
of constraints on data consumers, data and analysis
leaders are increasingly using data weaving to help
solve the increasing diversity, dispersion, scale and
complexity of corporate data assets. problem.
Data weaving uses analytical techniques to maintain
monitoring of the data pipeline. Data weaving
supports the design, deployment and utilization of
different data through continuous analysis of data
assets, reducing integration time by 30%,
deployment time by 30%, and maintenance time by
70%.
The extreme business changes triggered by the new crown
epidemic have made machine learning and artificial intelligence
models based on large amounts of historical data less reliable.
At the same time, human and artificial intelligence decision-
making has become more complex and strict, and data and
analysis leaders must have more data in order to better
understand the situation.
Therefore, data and analysis leaders should choose analysis
techniques that can make more effective use of existing data.
Data and analysis leaders rely on “wide” data for the analysis
and collaboration of various “small” and “large”, unstructured
and structured data sources, and also rely on “small” data —
that is, the amount of data required Few, but still able to
provide practical insight analysis techniques.
TREND 5: XOPS TREND 6: ENGINEERING DECISION
INTELLIGENCE
The goal of XOps (data, machine learning, models,
and platforms) is to use DevOps best practices to
achieve efficiency and economies of scale, while
ensuring reliability, reusability, and repeatability, while
reducing the duplication of technology and
processes and achieving automation.
The reason most analytics and AI projects fail is to
treat business as an afterthought. If data and
analysis leaders use XOps to implement large-scale
business, they will be able to achieve the
reproducibility, traceability, integrity, and integration
of analysis and AI assets.
Engineering decision-making intelligence is not only
suitable for single decision-making, but also for
continuous decision-making. This technology can group
decision-making into business processes and even for
emerging decision-making networks. With the increasing
degree of automation and enhancement of decision-
making, engineering decision-making provides data and
analysis leaders with opportunities to make decision-
making more accurate, repeatable, transparent and
traceable.
TREND 7: DATA AND ANALYTICS AS A
CORE BUSINESS FUNCTION (DATA AND
ANALYTICS AS A CORE BUSINESS
FUNCTION)
TREND 8: GRAPH RELATES EVERYTHING
Data and analysis activities are no longer a secondary
activity, but transformed into a core business
function. In this case, data and analysis have become
shared business assets consistent with business
results, and due to better collaboration between the
central and federal data and analysis teams, the
problem of data and analysis silos is easily solved.
Graph technology has become the basis of many modern
data and analysis capabilities, and can discover the
relationship between people, places, things, events, and
locations in different data assets. Data and analysis leaders
rely on graph technology to quickly answer complex
business questions that need to be answered after
understanding the situation and understanding the nature
of the connections and advantages between multiple
entities.
By 2025, the proportion of graph technology in data and
analysis innovation will rise from 10% in 2021 to 80%. The
technology will facilitate rapid decision-making throughout
the enterprise organization.
TREND 9: THE RISE OF THE
AUGMENTED CONSUMER (THE RISE OF
THE AUGMENTED CONSUMER)
TREND 10: DATA AND ANALYTICS AT THE
EDGE
Today, most business users are using predefined
dashboards and manual data exploration, which can
lead to wrong conclusions and flawed decisions and
actions. Pre-defined dashboards will gradually be
replaced by automated, conversational, mobile and
dynamically generated insights, and these insights
are customized according to user needs and
delivered to the user when they need to consume the
data.
“This will enable information data consumers, that is,
enhanced data consumers, to use analytical
techniques, so that they can gain insights and
knowledge that only analysts and citizen data
experts can have.”
Data, analytics, and other technologies that support them
are moving to the edge computing environment,
constantly approaching real-world assets and beyond
the scope of IT.
Data and analytics leaders can use this trend to achieve
greater data management flexibility, speed, governance,
and resilience. From supporting real-time event analysis
to realizing autonomous behavior of “things”, various
types of use cases are stimulating people’s interest in
edge data and analysis capabilities.
CONTACT INFORMATION
PHONE NUMBER
EMAIL ADDRESS
WEBSITE
123-456-7890
info@nuaig.ai
https://www.nuaig.ai/

Top ten data and analysis technology trends in 2021

  • 1.
    Top ten data andanalysis technology trends in 2021
  • 2.
    Data and analyticsleaders should make mission- critical investments to accelerate their ability to predict, transform, and respond based on these ten trends.
  • 3.
    The open, containerizedanalysis architecture improves the assemblability of analysis capabilities . The assembled data analysis architecture uses components from multiple data, analysis, and artificial intelligence solutions to quickly build flexible, user-friendly smart applications, helping data and analysis leaders connect insights with actions. As the data center shifts to the cloud , assembled data and analysis architecture will become a more agile way to build analysis applications through the cloud market and low-code and no-code solutions. TREND 1 : SMARTER, RESPONSIBLE, SCALABLE AI (SMARTER, RESPONSIBLE, SCALABLE AI) TREND 2: ASSEMBLED DATA AND ANALYSIS ARCHITECTURE (COMPOSABLE DATA AND ANALYTICS) The influence of artificial intelligence (AI) and machine learning (ML) is increasing, so companies must use new technologies to obtain AI solutions that are smarter, less demanding on data, more ethically responsible, and more resilient. Enterprises can accelerate time to value and increase business impact by deploying smarter, more responsible, and scalable AI, using learning algorithms and interpretable systems.
  • 4.
    TREND 3: DATAFABRIC IS THE FOUNDATION TREND 4: FROM BIG TO SMALL AND WIDE DATA With the increase in digitization and the diminishing of constraints on data consumers, data and analysis leaders are increasingly using data weaving to help solve the increasing diversity, dispersion, scale and complexity of corporate data assets. problem. Data weaving uses analytical techniques to maintain monitoring of the data pipeline. Data weaving supports the design, deployment and utilization of different data through continuous analysis of data assets, reducing integration time by 30%, deployment time by 30%, and maintenance time by 70%. The extreme business changes triggered by the new crown epidemic have made machine learning and artificial intelligence models based on large amounts of historical data less reliable. At the same time, human and artificial intelligence decision- making has become more complex and strict, and data and analysis leaders must have more data in order to better understand the situation. Therefore, data and analysis leaders should choose analysis techniques that can make more effective use of existing data. Data and analysis leaders rely on “wide” data for the analysis and collaboration of various “small” and “large”, unstructured and structured data sources, and also rely on “small” data — that is, the amount of data required Few, but still able to provide practical insight analysis techniques.
  • 5.
    TREND 5: XOPSTREND 6: ENGINEERING DECISION INTELLIGENCE The goal of XOps (data, machine learning, models, and platforms) is to use DevOps best practices to achieve efficiency and economies of scale, while ensuring reliability, reusability, and repeatability, while reducing the duplication of technology and processes and achieving automation. The reason most analytics and AI projects fail is to treat business as an afterthought. If data and analysis leaders use XOps to implement large-scale business, they will be able to achieve the reproducibility, traceability, integrity, and integration of analysis and AI assets. Engineering decision-making intelligence is not only suitable for single decision-making, but also for continuous decision-making. This technology can group decision-making into business processes and even for emerging decision-making networks. With the increasing degree of automation and enhancement of decision- making, engineering decision-making provides data and analysis leaders with opportunities to make decision- making more accurate, repeatable, transparent and traceable.
  • 6.
    TREND 7: DATAAND ANALYTICS AS A CORE BUSINESS FUNCTION (DATA AND ANALYTICS AS A CORE BUSINESS FUNCTION) TREND 8: GRAPH RELATES EVERYTHING Data and analysis activities are no longer a secondary activity, but transformed into a core business function. In this case, data and analysis have become shared business assets consistent with business results, and due to better collaboration between the central and federal data and analysis teams, the problem of data and analysis silos is easily solved. Graph technology has become the basis of many modern data and analysis capabilities, and can discover the relationship between people, places, things, events, and locations in different data assets. Data and analysis leaders rely on graph technology to quickly answer complex business questions that need to be answered after understanding the situation and understanding the nature of the connections and advantages between multiple entities. By 2025, the proportion of graph technology in data and analysis innovation will rise from 10% in 2021 to 80%. The technology will facilitate rapid decision-making throughout the enterprise organization.
  • 7.
    TREND 9: THERISE OF THE AUGMENTED CONSUMER (THE RISE OF THE AUGMENTED CONSUMER) TREND 10: DATA AND ANALYTICS AT THE EDGE Today, most business users are using predefined dashboards and manual data exploration, which can lead to wrong conclusions and flawed decisions and actions. Pre-defined dashboards will gradually be replaced by automated, conversational, mobile and dynamically generated insights, and these insights are customized according to user needs and delivered to the user when they need to consume the data. “This will enable information data consumers, that is, enhanced data consumers, to use analytical techniques, so that they can gain insights and knowledge that only analysts and citizen data experts can have.” Data, analytics, and other technologies that support them are moving to the edge computing environment, constantly approaching real-world assets and beyond the scope of IT. Data and analytics leaders can use this trend to achieve greater data management flexibility, speed, governance, and resilience. From supporting real-time event analysis to realizing autonomous behavior of “things”, various types of use cases are stimulating people’s interest in edge data and analysis capabilities.
  • 8.
    CONTACT INFORMATION PHONE NUMBER EMAILADDRESS WEBSITE 123-456-7890 info@nuaig.ai https://www.nuaig.ai/