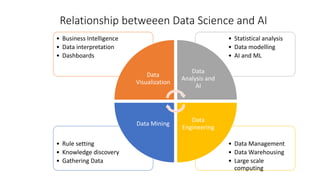
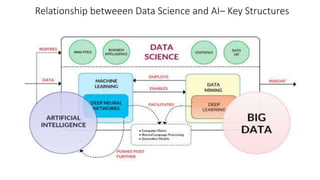
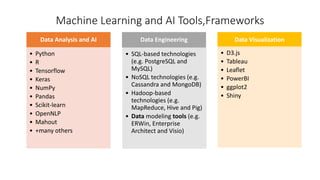
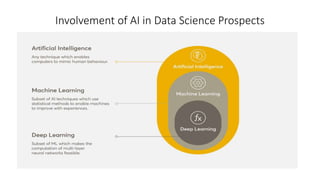
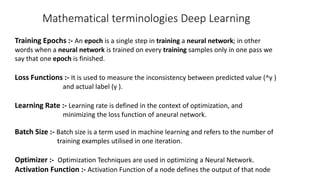
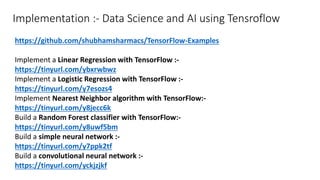
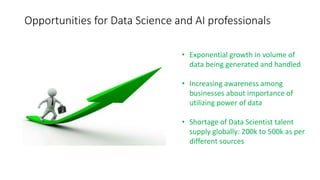
Data Science and Machine Learning with Tensorflow
Shubham Sharma
Data Scientist
Agenda
• Importance of Machine Learning and AI – Emerging applications, end-use
• Pictures (Amazon recommendations, Driverless Cars)
• Relationship betweeen Data Science and AI .
• Overall structure and components
• What tools can be used – technologies, packages
• List of tools and their classification
• List of frameworks
• Artificial Intelligence and Neural Networks
• Basics Of ML,AI,Neural Networks with implementations
• Machine Learning Depth : Regression Models
• Linear Regression : Math Behind
• Non Linear Regression : Math Behind
• Machine Learning Depth : Classification Models
• Decision Trees : Math Behind
• Deep Learning
• Mathematics Behind Neural Networks
• Terminologies
• What are the opportunities for data analytics professionals
Machine Learning and AI– Everywhere!
Driver Less Cars
Relationship betweeen Data Science and AI
• Data Management
• Data Warehousing
• Large scale
computing
• Rule setting
• Knowledge discovery
• Gathering Data
• Statistical analysis
• Data modelling
• AI and ML
• Business Intelligence
• Data interpretation
• Dashboards
Data
Visualization
Data
Analysis and
AI
Data
Engineering
Data Mining
Relationship betweeen Data Science and AI– Key Structures
Machine Learning and AI Tools,Frameworks
Data Analysis and AI
• Python
• R
• Tensorflow
• Keras
• NumPy
• Pandas
• Scikit-learn
• OpenNLP
• Mahout
• +many others
Data Engineering
• SQL-based technologies
(e.g. PostgreSQL and
MySQL)
• NoSQL technologies (e.g.
Cassandra and MongoDB)
• Hadoop-based
technologies (e.g.
MapReduce, Hive and Pig)
• Data modeling tools (e.g.
ERWin, Enterprise
Architect and Visio)
Data Visualization
• D3.js
• Tableau
• Leaflet
• PowerBI
• ggplot2
• Shiny
Artificial Intelligence and Neural Networks
Any Idea
Involvement of AI in Data Science Prospects
Machine Learning Approach
Different Algorithms in Machine Learning
11
Supervised vs. Unsupervised Learning
• Supervised learning
• Supervision: The training data (observations, measurements, etc.) are
accompanied by labels indicating the class of the observations
• New data is classified based on the training set
• Unsupervised learning
• The class labels of training data is unknown
• Given a set of measurements, observations, etc. with the aim of establishing the
existence of classes or clusters in the data
Regression is a technique used to model and analyze the relationships
between variables and often times how they contribute and are related to
producing a particular outcome together.
.
Machine Learning Depth : Regression Models
Linear Regression
• A classic statistical problem is to try to determine the relationship between a
random
variable Y. and an independent variable x.
• For example, we might consider height and weight of a sample of adults.
Linear regression attempts to explain this relationship by fitting a curve to the
data.
The linear regression model postulates that
Y= b0+b1 x1+ ... +bnxn+ e,where the xi are independent variables and the
"residual" e is a random variable with mean zero. In this applet, we consider the
simplest example of fitting a straight line:
Y= a+bx+e.The coefficients a and b are determined by the condition that the sum
of the square residuals is as small as possible
Linear Regression : Math Behind
• Using – the equation of a straight line y=mx+c
• Get the mean of all the x values
• Get the mean of all the y values and use the following equation (from C1)
• Plot the point this is the only point that we know on the line of regression.
• The only thing to do now is work out the gradient (m)
   
 
where (y-mx) is the intercept
y y m x x
y mx y mx
  
  
 
,
x y
Findthe gradient xy
xx
S
m
S

  
( )( )
xy i i
i i
i i
i i
S x x y y
x y
x y
n
x y nxy
  
 
 

 


 
2
2
2
2 2
( )
xx i
i
i
i
S x x
x
x
n
x nx
 
 
 




You need the different forms as
problems will be presented in
different ways.
In a graphics calculator
x y
= =
=Sxy
 
x x
  
y y
  
x x
  
y y

x
n

x
y
n

y
  
x x y y
 

=Sxx
x
2
( )
i
x x


 
x x
  
2
x x

i
x
n
x


Linear Regression : Math Behind
Nonlinear Regression
Given n data points )
,
(
,
...
),
,
(
),
,
( 2
2
1
1 n
n y
x
y
x
y
x best fit )
(x
f
y 
to the data, where )
(x
f is a nonlinear function of x
Figure. Nonlinear regression model for discrete y vs. x data
)
(x
f
y 
)
,
(
n
n
y
x
)
,
( 1
1
y
x
)
,
(
2
2
y
x
)
,
(
i
i
y
x
)
(
i
i
x
f
y 
http://numericalmethods.eng.usf.edu
18
Logistic Regression
• Logistic regression is the appropriate regression analysis to conduct
when the dependent variable is dichotomous (binary).
• Like all regression analyses, the logistic regression is a predictive
analysis.
• Logistic regression is used to describe data and to explain the
relationship between one dependent binary variable and one or more
nominal, ordinal, interval or ratio-level independent variables.
Logistic Growth Model
or (ignoring e) “rate of increase in Y =
 

 Y
kY
dx
dY 

Equation: e




 kx
e
Y
1
10
8
6
4
2
0
0.0
0.5
1.0
Logistic Growth Model
x
y

k=1/4
k=1/2
k=1
k=2
k=4
21
Classification: Basic Concepts
• Classification: Basic Concepts
• Decision Tree Induction
• Bayes Classification Methods
• Rule-Based Classification
• Model Evaluation and Selection
• Techniques to Improve Classification Accuracy: Ensemble Methods
• Summary
22
Decision Tree Induction: An Example
age?
overcast
student? credit rating?
<=30 >40
no yes yes
yes
31..40
fair
excellent
yes
no
age income student credit_rating buys_computer
<=30 high no fair no
<=30 high no excellent no
31…40 high no fair yes
>40 medium no fair yes
>40 low yes fair yes
>40 low yes excellent no
31…40 low yes excellent yes
<=30 medium no fair no
<=30 low yes fair yes
>40 medium yes fair yes
<=30 medium yes excellent yes
31…40 medium no excellent yes
31…40 high yes fair yes
>40 medium no excellent no
 Training data set: Buys_computer
 The data set follows an example of Quinlan’s ID3
(Playing Tennis)
 Resulting tree:
23
Algorithm for Decision Tree Induction
• Basic algorithm (a greedy algorithm)
• Tree is constructed in a top-down recursive divide-and-conquer manner
• At start, all the training examples are at the root
• Attributes are categorical (if continuous-valued, they are discretized in advance)
• Examples are partitioned recursively based on selected attributes
• Test attributes are selected on the basis of a heuristic or statistical measure (e.g.,
information gain)
• Conditions for stopping partitioning
• All samples for a given node belong to the same class
• There are no remaining attributes for further partitioning – majority voting is employed
for classifying the leaf
• There are no samples left
Deep Learning Approach
Why Deep Learning in AI and Data Science?
Biological Inspiration
“My brain: It's my second favorite organ.”
- Woody Allen, from the movie Sleeper
Idea : To make the computer more robust, intelligent, and learn, …
Let’s model our computer software (and/or hardware) after the brain
Backbone of Deep Learning :- Neural Networks
Mathematics Behind Neural Networks
Biological Neuron
Artificial Neuron
Mathematical terminologies Deep Learning
Training Epochs :- An epoch is a single step in training a neural network; in other
words when a neural network is trained on every training samples only in one pass we
say that one epoch is finished.
Loss Functions :- It is used to measure the inconsistency between predicted value (^y )
and actual label (y ).
Learning Rate :- Learning rate is defined in the context of optimization, and
minimizing the loss function of aneural network.
Batch Size :- Batch size is a term used in machine learning and refers to the number of
training examples utilised in one iteration.
Optimizer :- Optimization Techniques are used in optimizing a Neural Network.
Activation Function :- Activation Function of a node defines the output of that node
Implementation :- Data Science and AI using Tensroflow
https://github.com/shubhamsharmacs/TensorFlow-Examples
Implement a Linear Regression with TensorFlow :-
https://tinyurl.com/ybxrwbwz
Implement a Logistic Regression with TensorFlow :-
https://tinyurl.com/y7esozs4
Implement Nearest Neighbor algorithm with TensorFlow:-
https://tinyurl.com/y8jecc6k
Build a Random Forest classifier with TensorFlow:-
https://tinyurl.com/y8uwf5bm
Build a simple neural network :-
https://tinyurl.com/y7ppk2tf
Build a convolutional neural network :-
https://tinyurl.com/yckjzjkf
Opportunities for Data Science and AI professionals
• Exponential growth in volume of
data being generated and handled
• Increasing awareness among
businesses about importance of
utilizing power of data
• Shortage of Data Scientist talent
supply globally: 200k to 500k as per
different sources
Q & A
Connect with me
• Gmail :- shubhamsharma1318@gmail.com
• Linkedln :- https://linkedin.com/in/shubham-sharma-8889893109/
• StackOverflow :-
https://stackoverflow.com/users/4786793/shubham-sharma
Blogs :- http://dataanalyticsvidhya.com/
•Thank You

Data Science and Machine Learning with Tensorflow

  • 1.
    Data Science andMachine Learning with Tensorflow Shubham Sharma Data Scientist
  • 2.
    Agenda • Importance ofMachine Learning and AI – Emerging applications, end-use • Pictures (Amazon recommendations, Driverless Cars) • Relationship betweeen Data Science and AI . • Overall structure and components • What tools can be used – technologies, packages • List of tools and their classification • List of frameworks • Artificial Intelligence and Neural Networks • Basics Of ML,AI,Neural Networks with implementations • Machine Learning Depth : Regression Models • Linear Regression : Math Behind • Non Linear Regression : Math Behind • Machine Learning Depth : Classification Models • Decision Trees : Math Behind • Deep Learning • Mathematics Behind Neural Networks • Terminologies • What are the opportunities for data analytics professionals
  • 3.
    Machine Learning andAI– Everywhere! Driver Less Cars
  • 4.
    Relationship betweeen DataScience and AI • Data Management • Data Warehousing • Large scale computing • Rule setting • Knowledge discovery • Gathering Data • Statistical analysis • Data modelling • AI and ML • Business Intelligence • Data interpretation • Dashboards Data Visualization Data Analysis and AI Data Engineering Data Mining
  • 5.
    Relationship betweeen DataScience and AI– Key Structures
  • 6.
    Machine Learning andAI Tools,Frameworks Data Analysis and AI • Python • R • Tensorflow • Keras • NumPy • Pandas • Scikit-learn • OpenNLP • Mahout • +many others Data Engineering • SQL-based technologies (e.g. PostgreSQL and MySQL) • NoSQL technologies (e.g. Cassandra and MongoDB) • Hadoop-based technologies (e.g. MapReduce, Hive and Pig) • Data modeling tools (e.g. ERWin, Enterprise Architect and Visio) Data Visualization • D3.js • Tableau • Leaflet • PowerBI • ggplot2 • Shiny
  • 7.
    Artificial Intelligence andNeural Networks Any Idea
  • 8.
    Involvement of AIin Data Science Prospects
  • 9.
  • 10.
    Different Algorithms inMachine Learning
  • 11.
    11 Supervised vs. UnsupervisedLearning • Supervised learning • Supervision: The training data (observations, measurements, etc.) are accompanied by labels indicating the class of the observations • New data is classified based on the training set • Unsupervised learning • The class labels of training data is unknown • Given a set of measurements, observations, etc. with the aim of establishing the existence of classes or clusters in the data
  • 12.
    Regression is atechnique used to model and analyze the relationships between variables and often times how they contribute and are related to producing a particular outcome together. . Machine Learning Depth : Regression Models
  • 13.
    Linear Regression • Aclassic statistical problem is to try to determine the relationship between a random variable Y. and an independent variable x. • For example, we might consider height and weight of a sample of adults. Linear regression attempts to explain this relationship by fitting a curve to the data. The linear regression model postulates that Y= b0+b1 x1+ ... +bnxn+ e,where the xi are independent variables and the "residual" e is a random variable with mean zero. In this applet, we consider the simplest example of fitting a straight line: Y= a+bx+e.The coefficients a and b are determined by the condition that the sum of the square residuals is as small as possible
  • 14.
    Linear Regression :Math Behind • Using – the equation of a straight line y=mx+c • Get the mean of all the x values • Get the mean of all the y values and use the following equation (from C1) • Plot the point this is the only point that we know on the line of regression. • The only thing to do now is work out the gradient (m)       where (y-mx) is the intercept y y m x x y mx y mx         , x y
  • 15.
    Findthe gradient xy xx S m S    ( )( ) xy i i i i i i i i S x x y y x y x y n x y nxy               2 2 2 2 2 ( ) xx i i i i S x x x x n x nx           You need the different forms as problems will be presented in different ways.
  • 16.
    In a graphicscalculator x y = = =Sxy   x x    y y    x x    y y  x n  x y n  y    x x y y    =Sxx x 2 ( ) i x x     x x    2 x x  i x n x  
  • 17.
  • 18.
    Nonlinear Regression Given ndata points ) , ( , ... ), , ( ), , ( 2 2 1 1 n n y x y x y x best fit ) (x f y  to the data, where ) (x f is a nonlinear function of x Figure. Nonlinear regression model for discrete y vs. x data ) (x f y  ) , ( n n y x ) , ( 1 1 y x ) , ( 2 2 y x ) , ( i i y x ) ( i i x f y  http://numericalmethods.eng.usf.edu 18
  • 19.
    Logistic Regression • Logisticregression is the appropriate regression analysis to conduct when the dependent variable is dichotomous (binary). • Like all regression analyses, the logistic regression is a predictive analysis. • Logistic regression is used to describe data and to explain the relationship between one dependent binary variable and one or more nominal, ordinal, interval or ratio-level independent variables.
  • 20.
    Logistic Growth Model or(ignoring e) “rate of increase in Y =     Y kY dx dY   Equation: e      kx e Y 1 10 8 6 4 2 0 0.0 0.5 1.0 Logistic Growth Model x y  k=1/4 k=1/2 k=1 k=2 k=4
  • 21.
    21 Classification: Basic Concepts •Classification: Basic Concepts • Decision Tree Induction • Bayes Classification Methods • Rule-Based Classification • Model Evaluation and Selection • Techniques to Improve Classification Accuracy: Ensemble Methods • Summary
  • 22.
    22 Decision Tree Induction:An Example age? overcast student? credit rating? <=30 >40 no yes yes yes 31..40 fair excellent yes no age income student credit_rating buys_computer <=30 high no fair no <=30 high no excellent no 31…40 high no fair yes >40 medium no fair yes >40 low yes fair yes >40 low yes excellent no 31…40 low yes excellent yes <=30 medium no fair no <=30 low yes fair yes >40 medium yes fair yes <=30 medium yes excellent yes 31…40 medium no excellent yes 31…40 high yes fair yes >40 medium no excellent no  Training data set: Buys_computer  The data set follows an example of Quinlan’s ID3 (Playing Tennis)  Resulting tree:
  • 23.
    23 Algorithm for DecisionTree Induction • Basic algorithm (a greedy algorithm) • Tree is constructed in a top-down recursive divide-and-conquer manner • At start, all the training examples are at the root • Attributes are categorical (if continuous-valued, they are discretized in advance) • Examples are partitioned recursively based on selected attributes • Test attributes are selected on the basis of a heuristic or statistical measure (e.g., information gain) • Conditions for stopping partitioning • All samples for a given node belong to the same class • There are no remaining attributes for further partitioning – majority voting is employed for classifying the leaf • There are no samples left
  • 24.
  • 25.
    Why Deep Learningin AI and Data Science?
  • 26.
    Biological Inspiration “My brain:It's my second favorite organ.” - Woody Allen, from the movie Sleeper Idea : To make the computer more robust, intelligent, and learn, … Let’s model our computer software (and/or hardware) after the brain
  • 27.
    Backbone of DeepLearning :- Neural Networks
  • 28.
    Mathematics Behind NeuralNetworks Biological Neuron Artificial Neuron
  • 29.
    Mathematical terminologies DeepLearning Training Epochs :- An epoch is a single step in training a neural network; in other words when a neural network is trained on every training samples only in one pass we say that one epoch is finished. Loss Functions :- It is used to measure the inconsistency between predicted value (^y ) and actual label (y ). Learning Rate :- Learning rate is defined in the context of optimization, and minimizing the loss function of aneural network. Batch Size :- Batch size is a term used in machine learning and refers to the number of training examples utilised in one iteration. Optimizer :- Optimization Techniques are used in optimizing a Neural Network. Activation Function :- Activation Function of a node defines the output of that node
  • 30.
    Implementation :- DataScience and AI using Tensroflow https://github.com/shubhamsharmacs/TensorFlow-Examples Implement a Linear Regression with TensorFlow :- https://tinyurl.com/ybxrwbwz Implement a Logistic Regression with TensorFlow :- https://tinyurl.com/y7esozs4 Implement Nearest Neighbor algorithm with TensorFlow:- https://tinyurl.com/y8jecc6k Build a Random Forest classifier with TensorFlow:- https://tinyurl.com/y8uwf5bm Build a simple neural network :- https://tinyurl.com/y7ppk2tf Build a convolutional neural network :- https://tinyurl.com/yckjzjkf
  • 31.
    Opportunities for DataScience and AI professionals • Exponential growth in volume of data being generated and handled • Increasing awareness among businesses about importance of utilizing power of data • Shortage of Data Scientist talent supply globally: 200k to 500k as per different sources
  • 32.
  • 33.
    Connect with me •Gmail :- shubhamsharma1318@gmail.com • Linkedln :- https://linkedin.com/in/shubham-sharma-8889893109/ • StackOverflow :- https://stackoverflow.com/users/4786793/shubham-sharma Blogs :- http://dataanalyticsvidhya.com/
  • 34.