Download to read offline


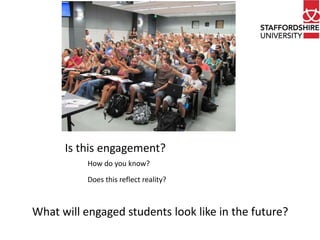
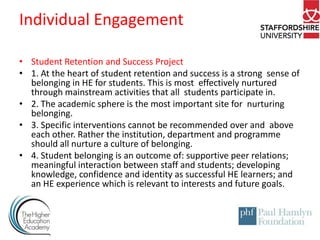
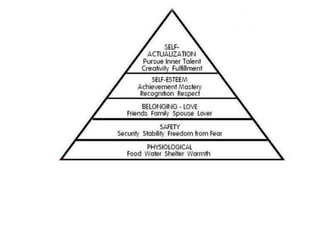
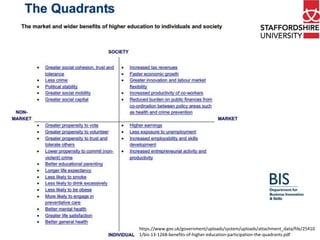

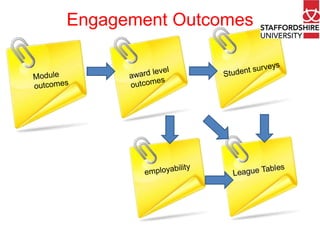
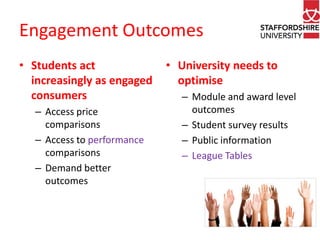
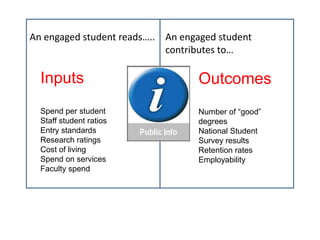
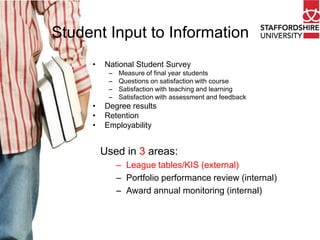


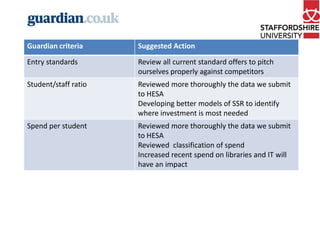
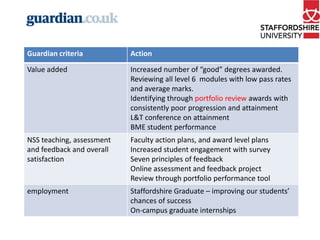
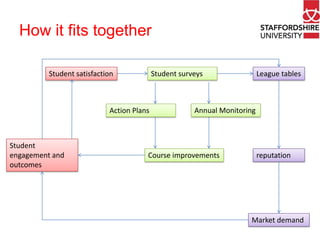
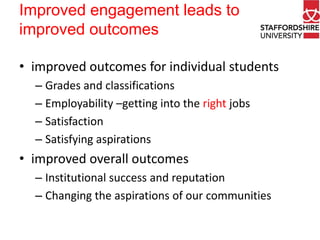
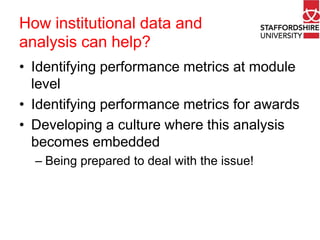
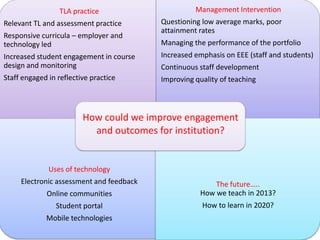


This document discusses student engagement in higher education. It outlines that student belonging, supportive relationships between staff and students, and relevant experiences are important for engagement. Engaged students have better outcomes individually and for society. Student surveys, outcomes data, and league tables are used to measure engagement and inform course improvements to enhance outcomes. Emerging technologies may help engagement, but their use requires care to avoid problematic data collection and ensure student privacy. The future of education is uncertain as jobs and needed skills rapidly change, requiring flexible, technology-enabled learning to prepare students.