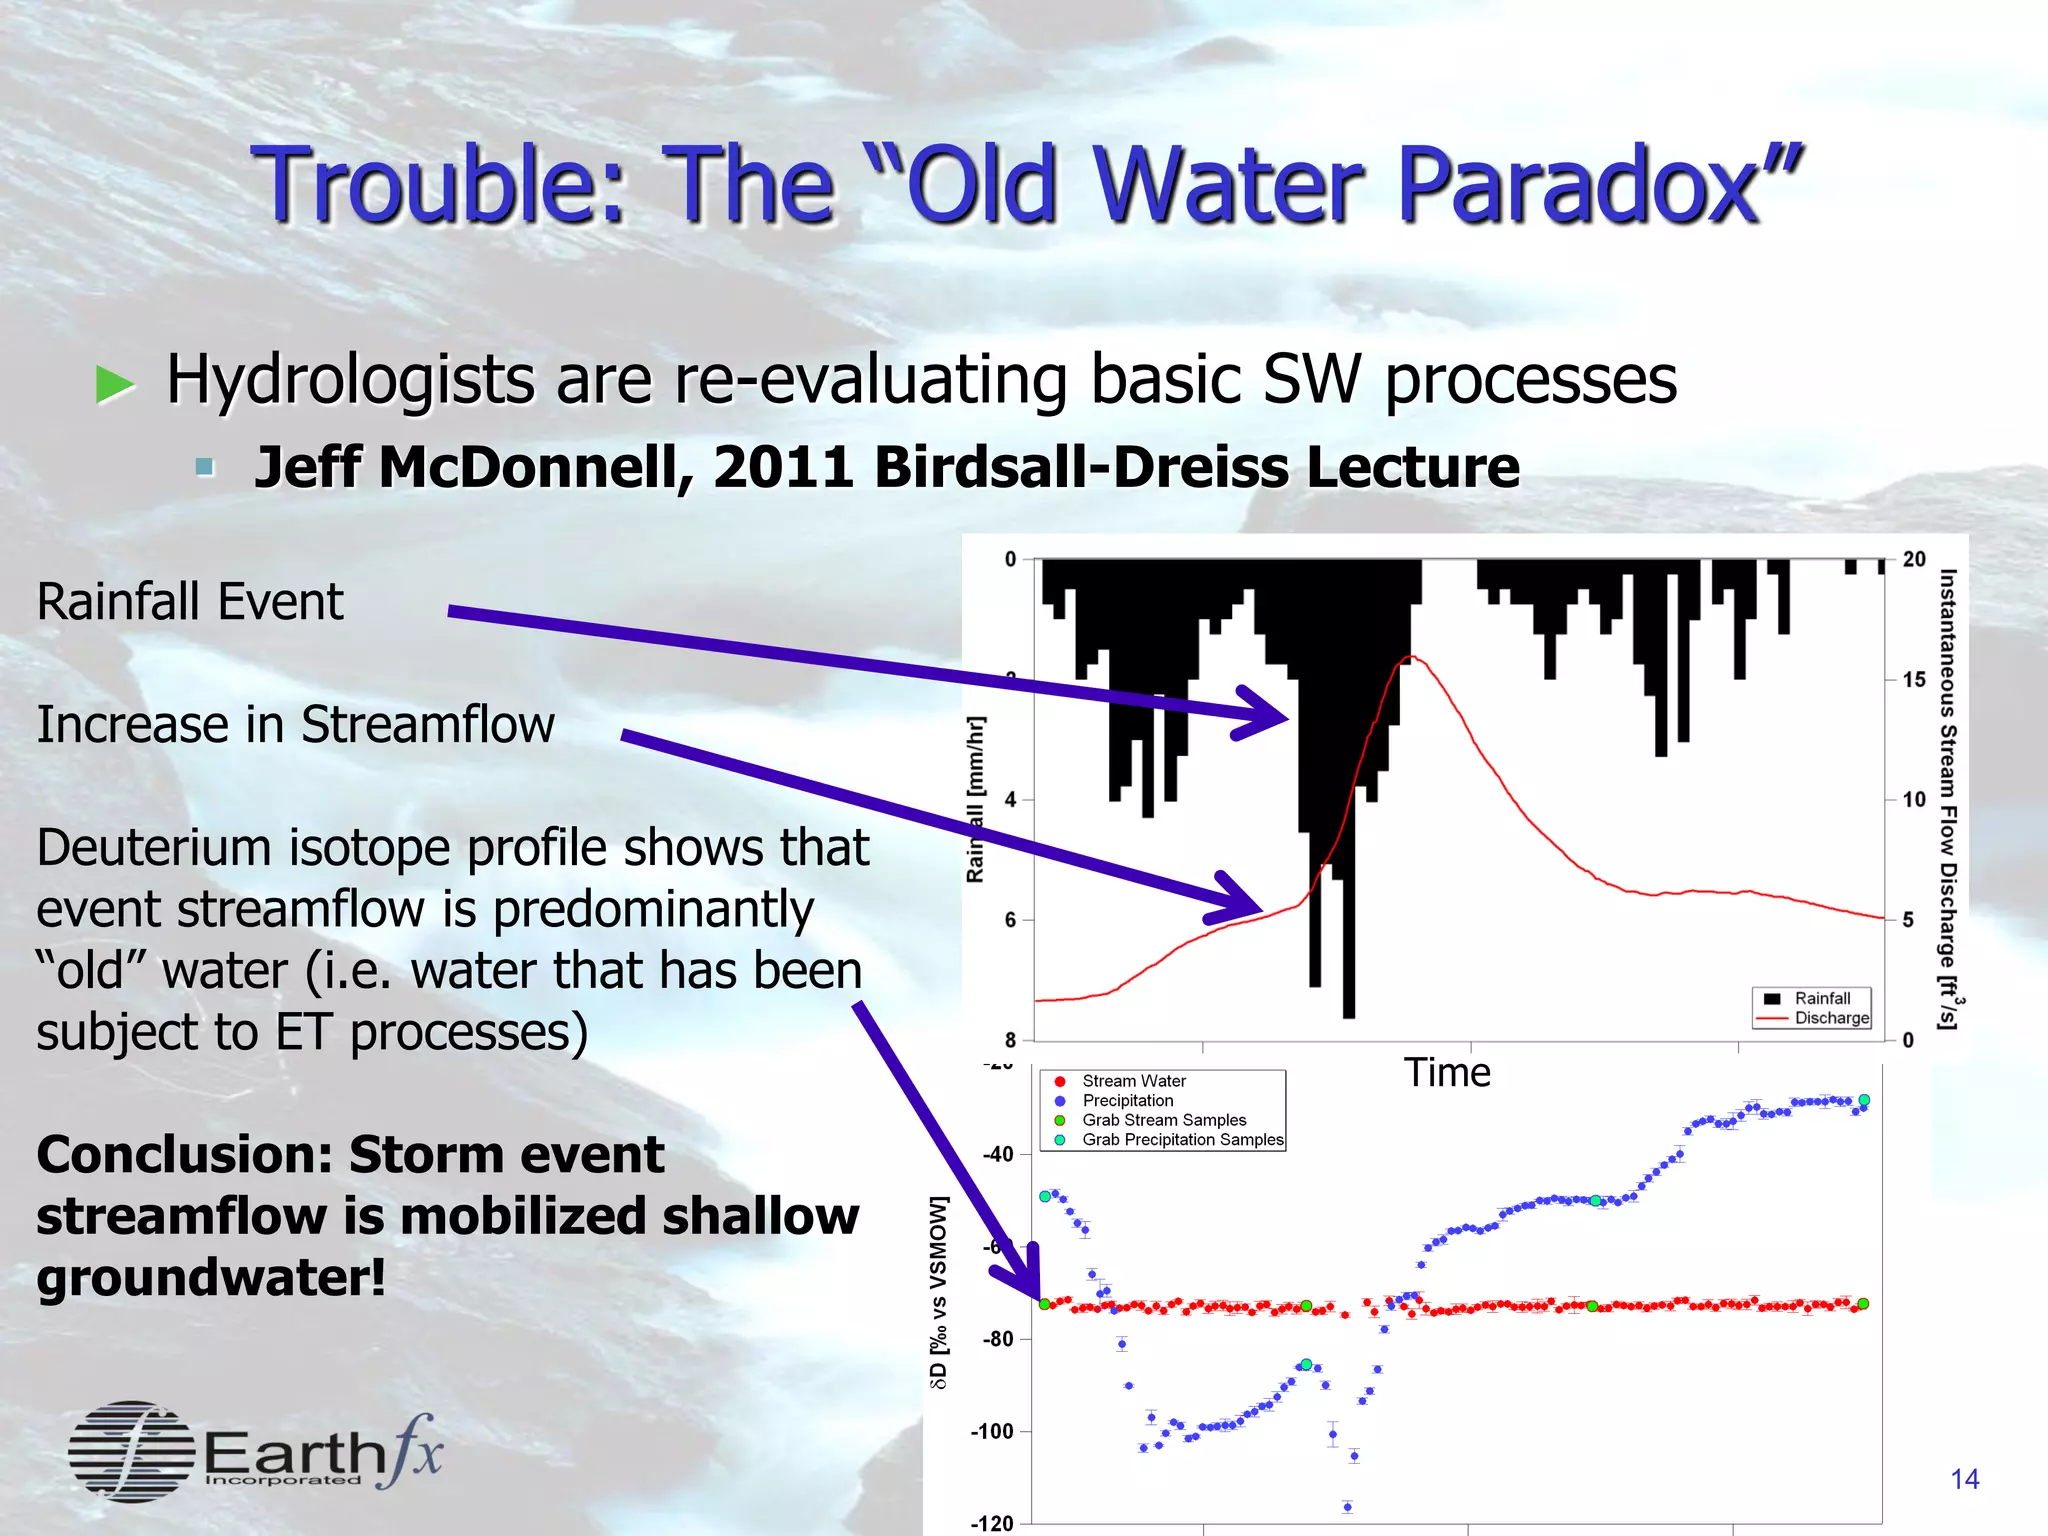
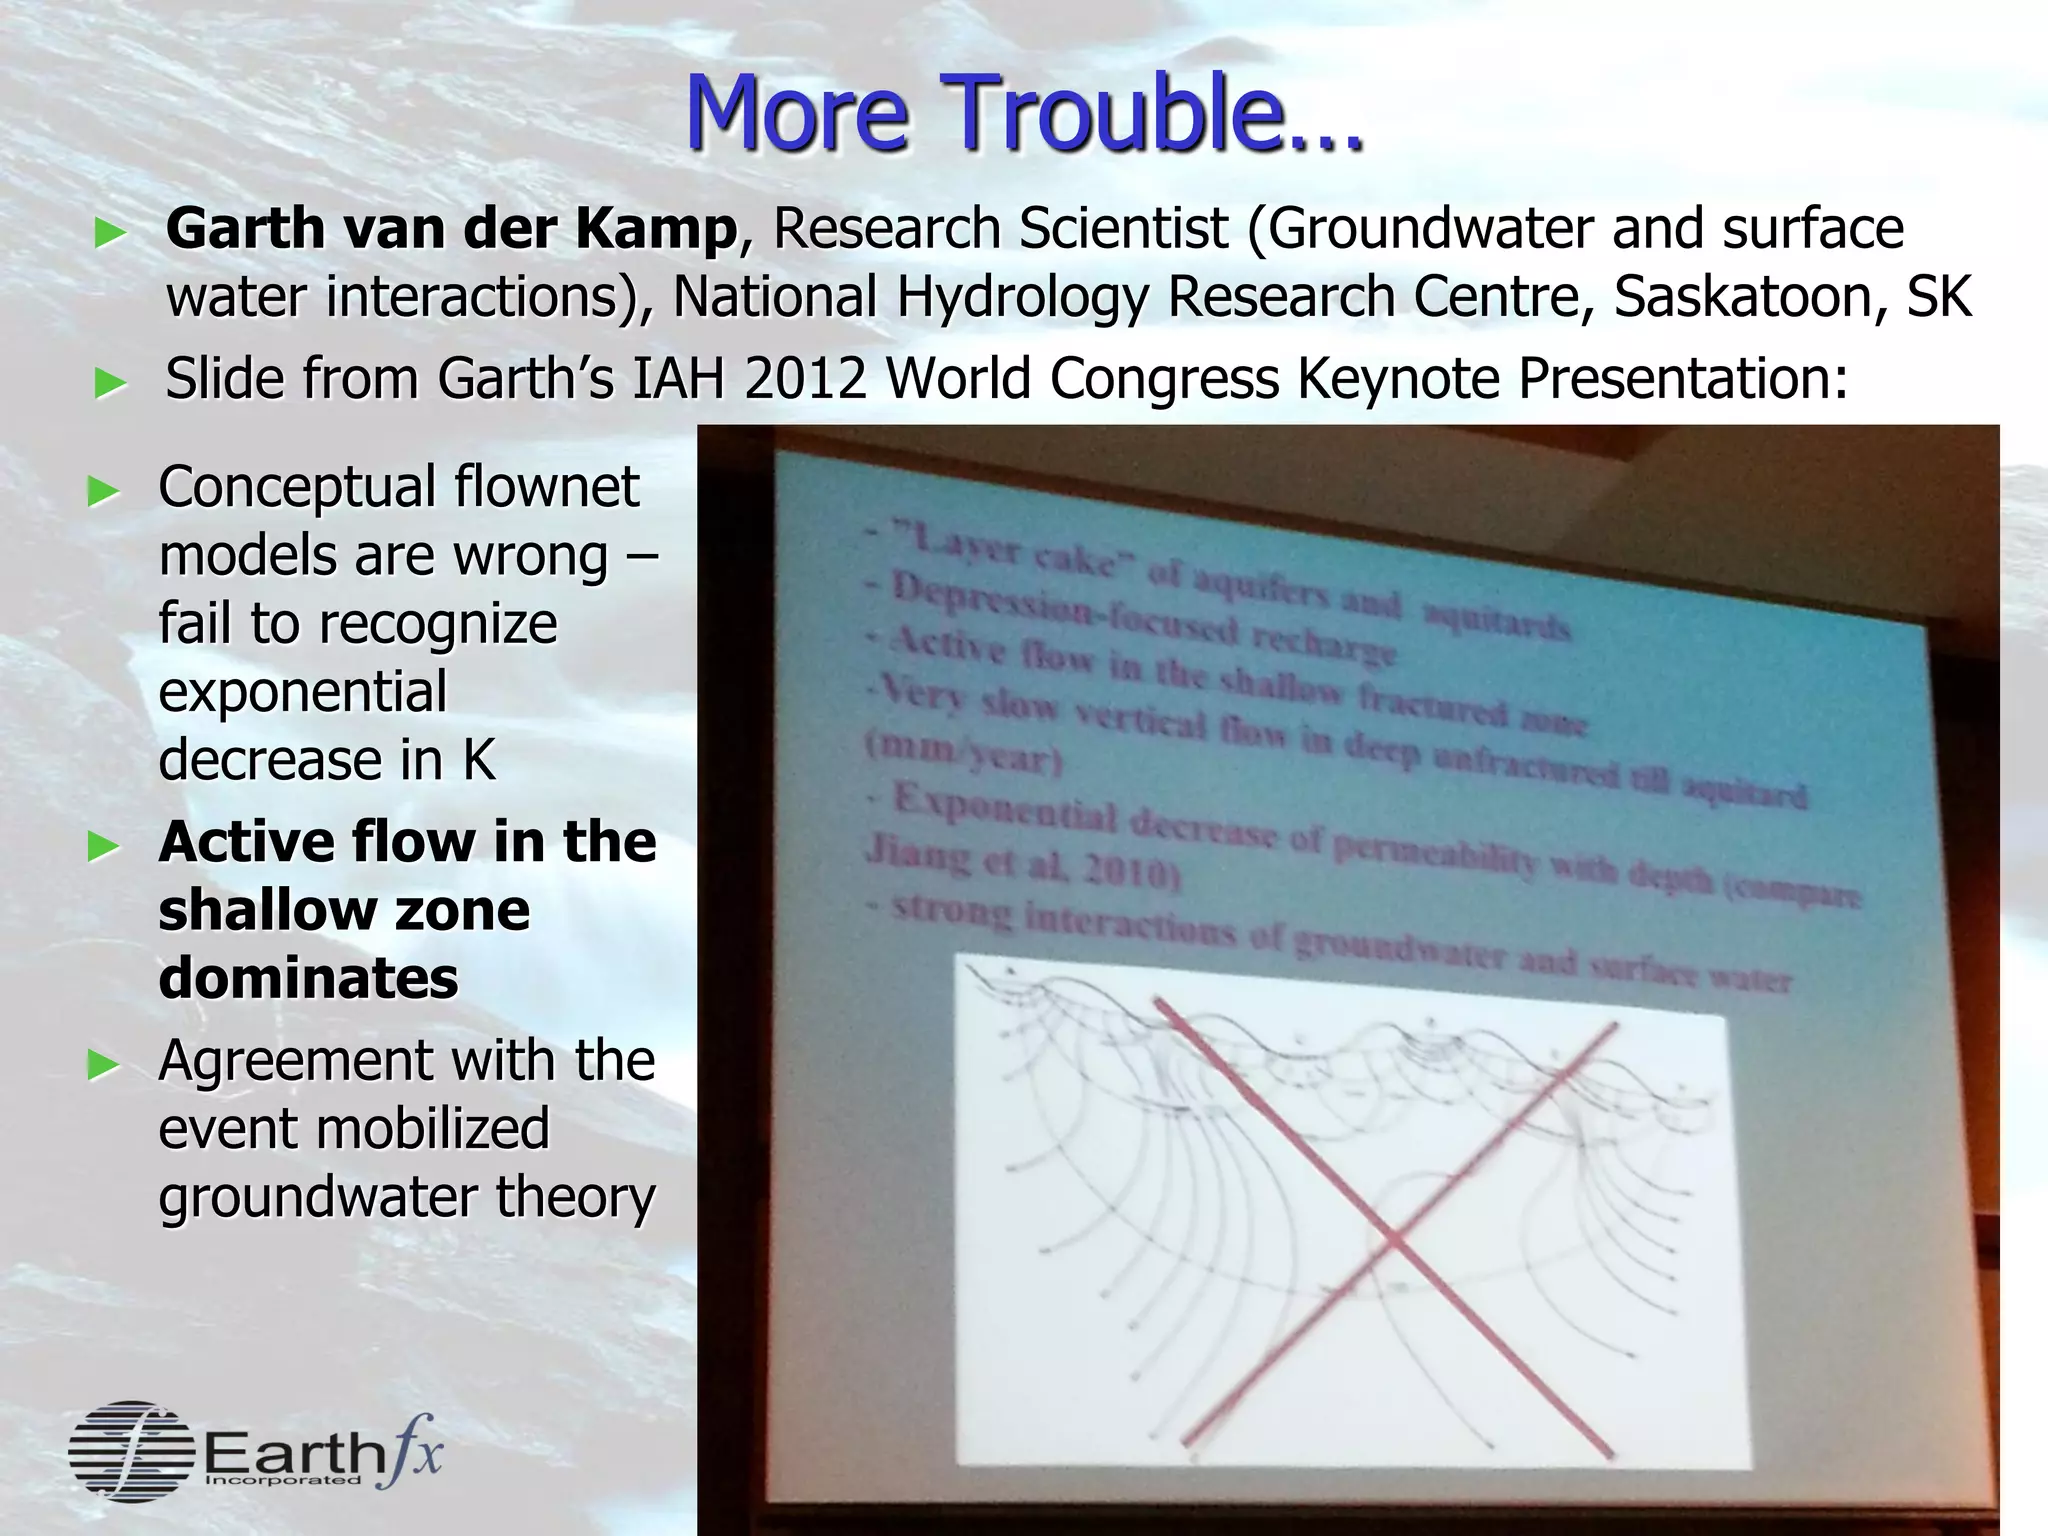
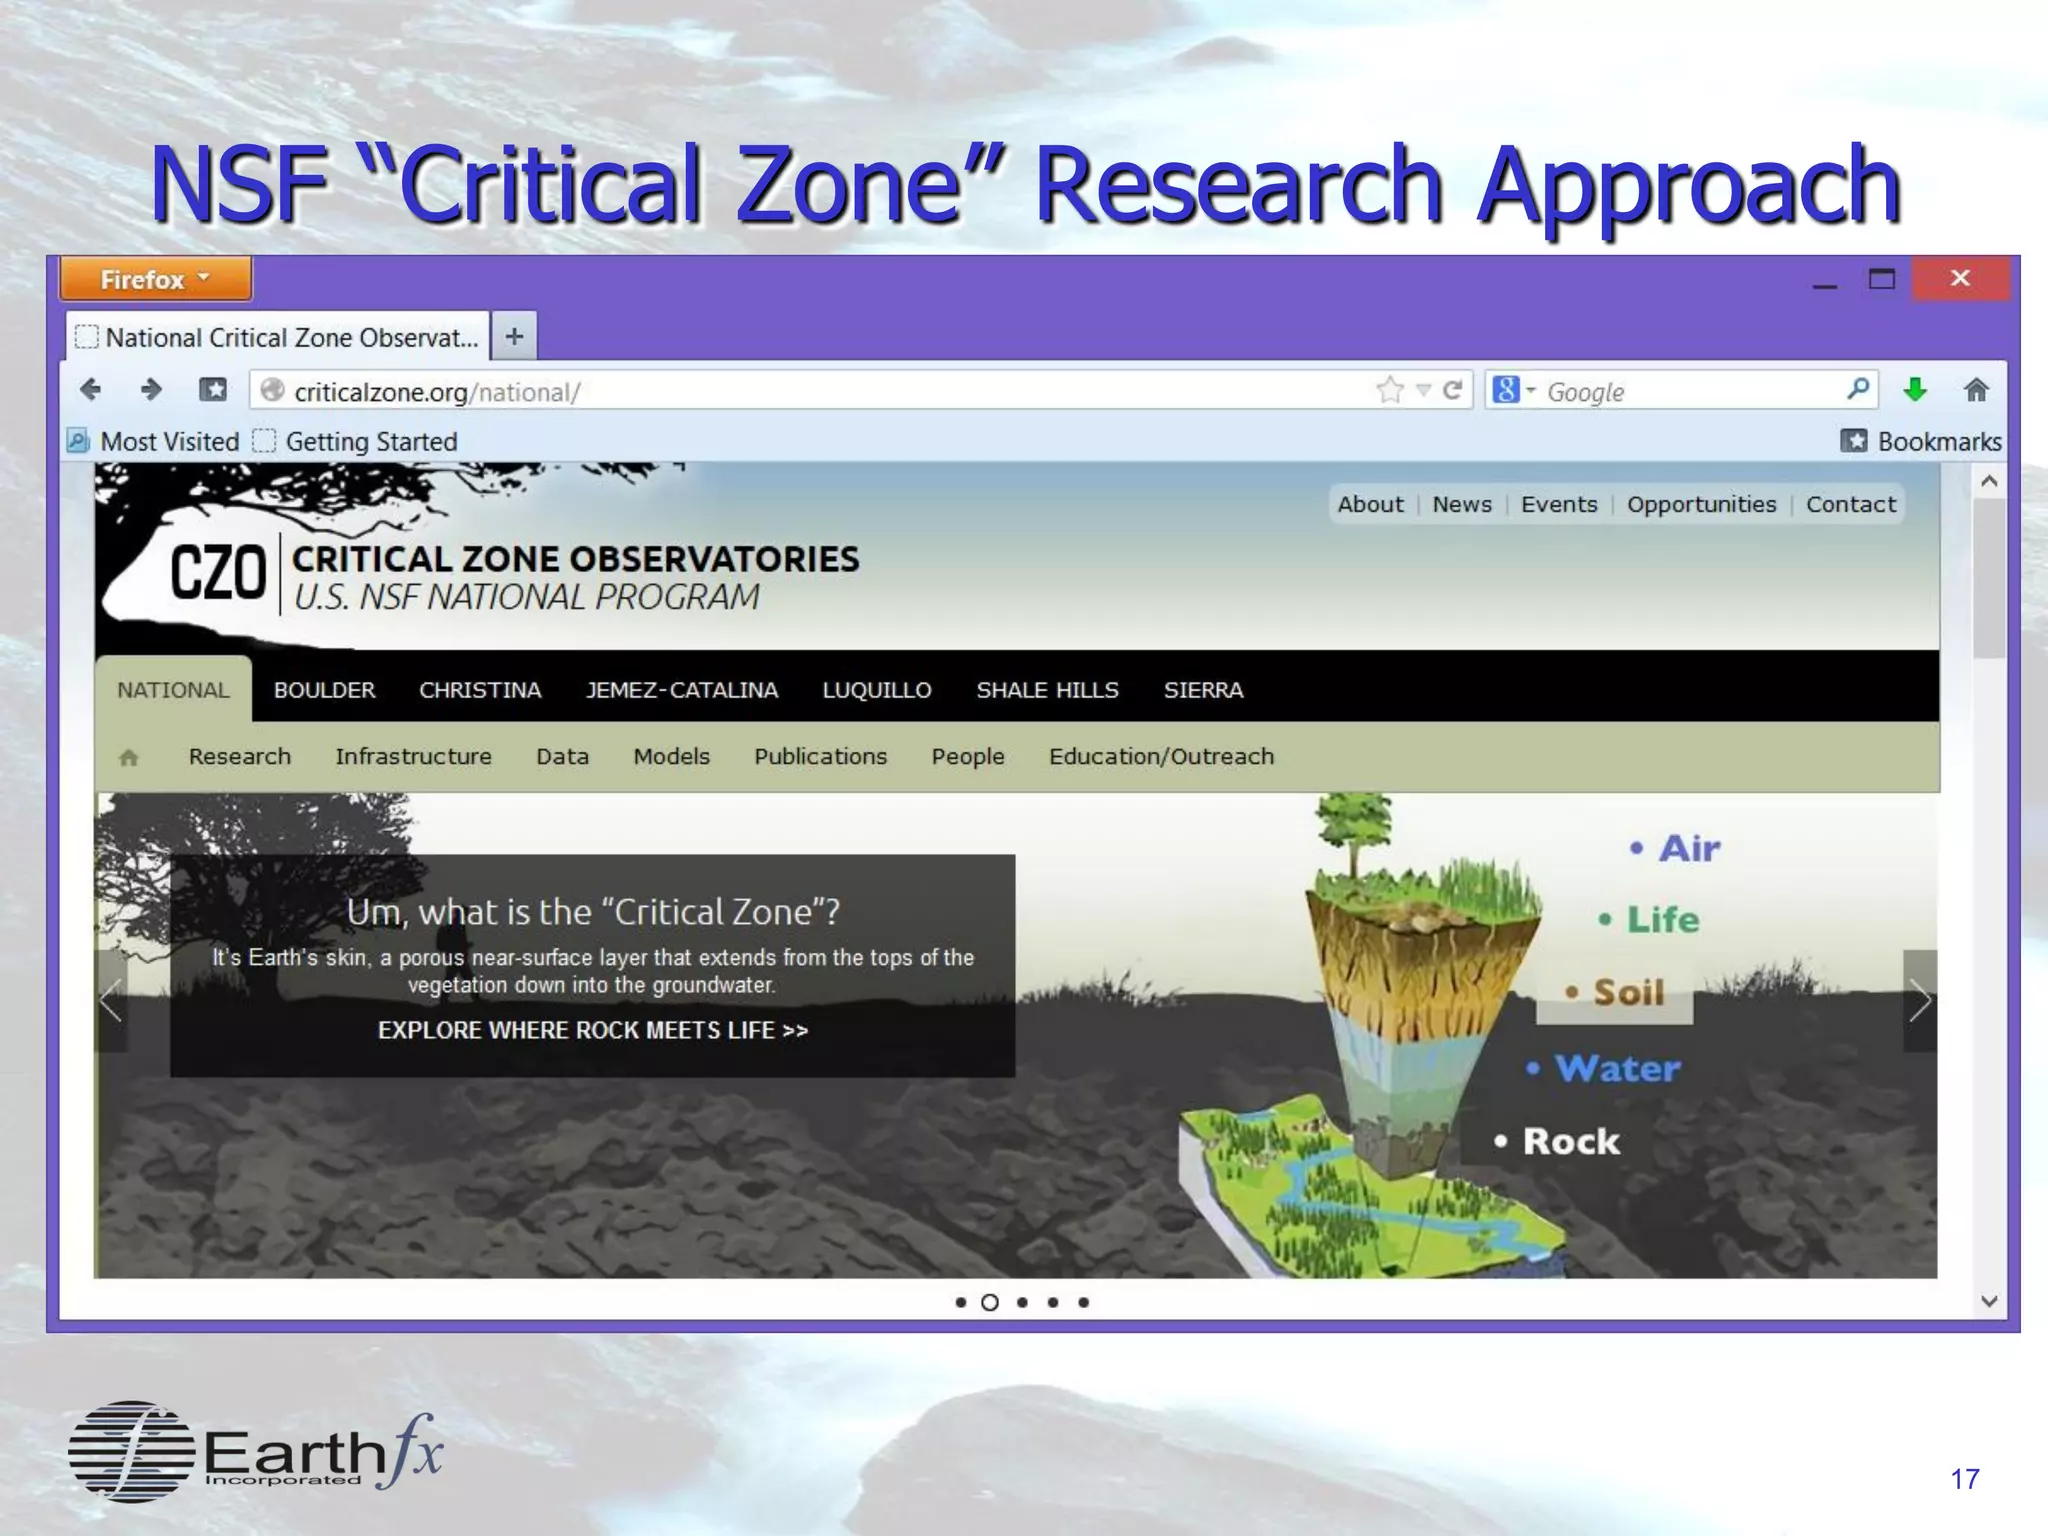
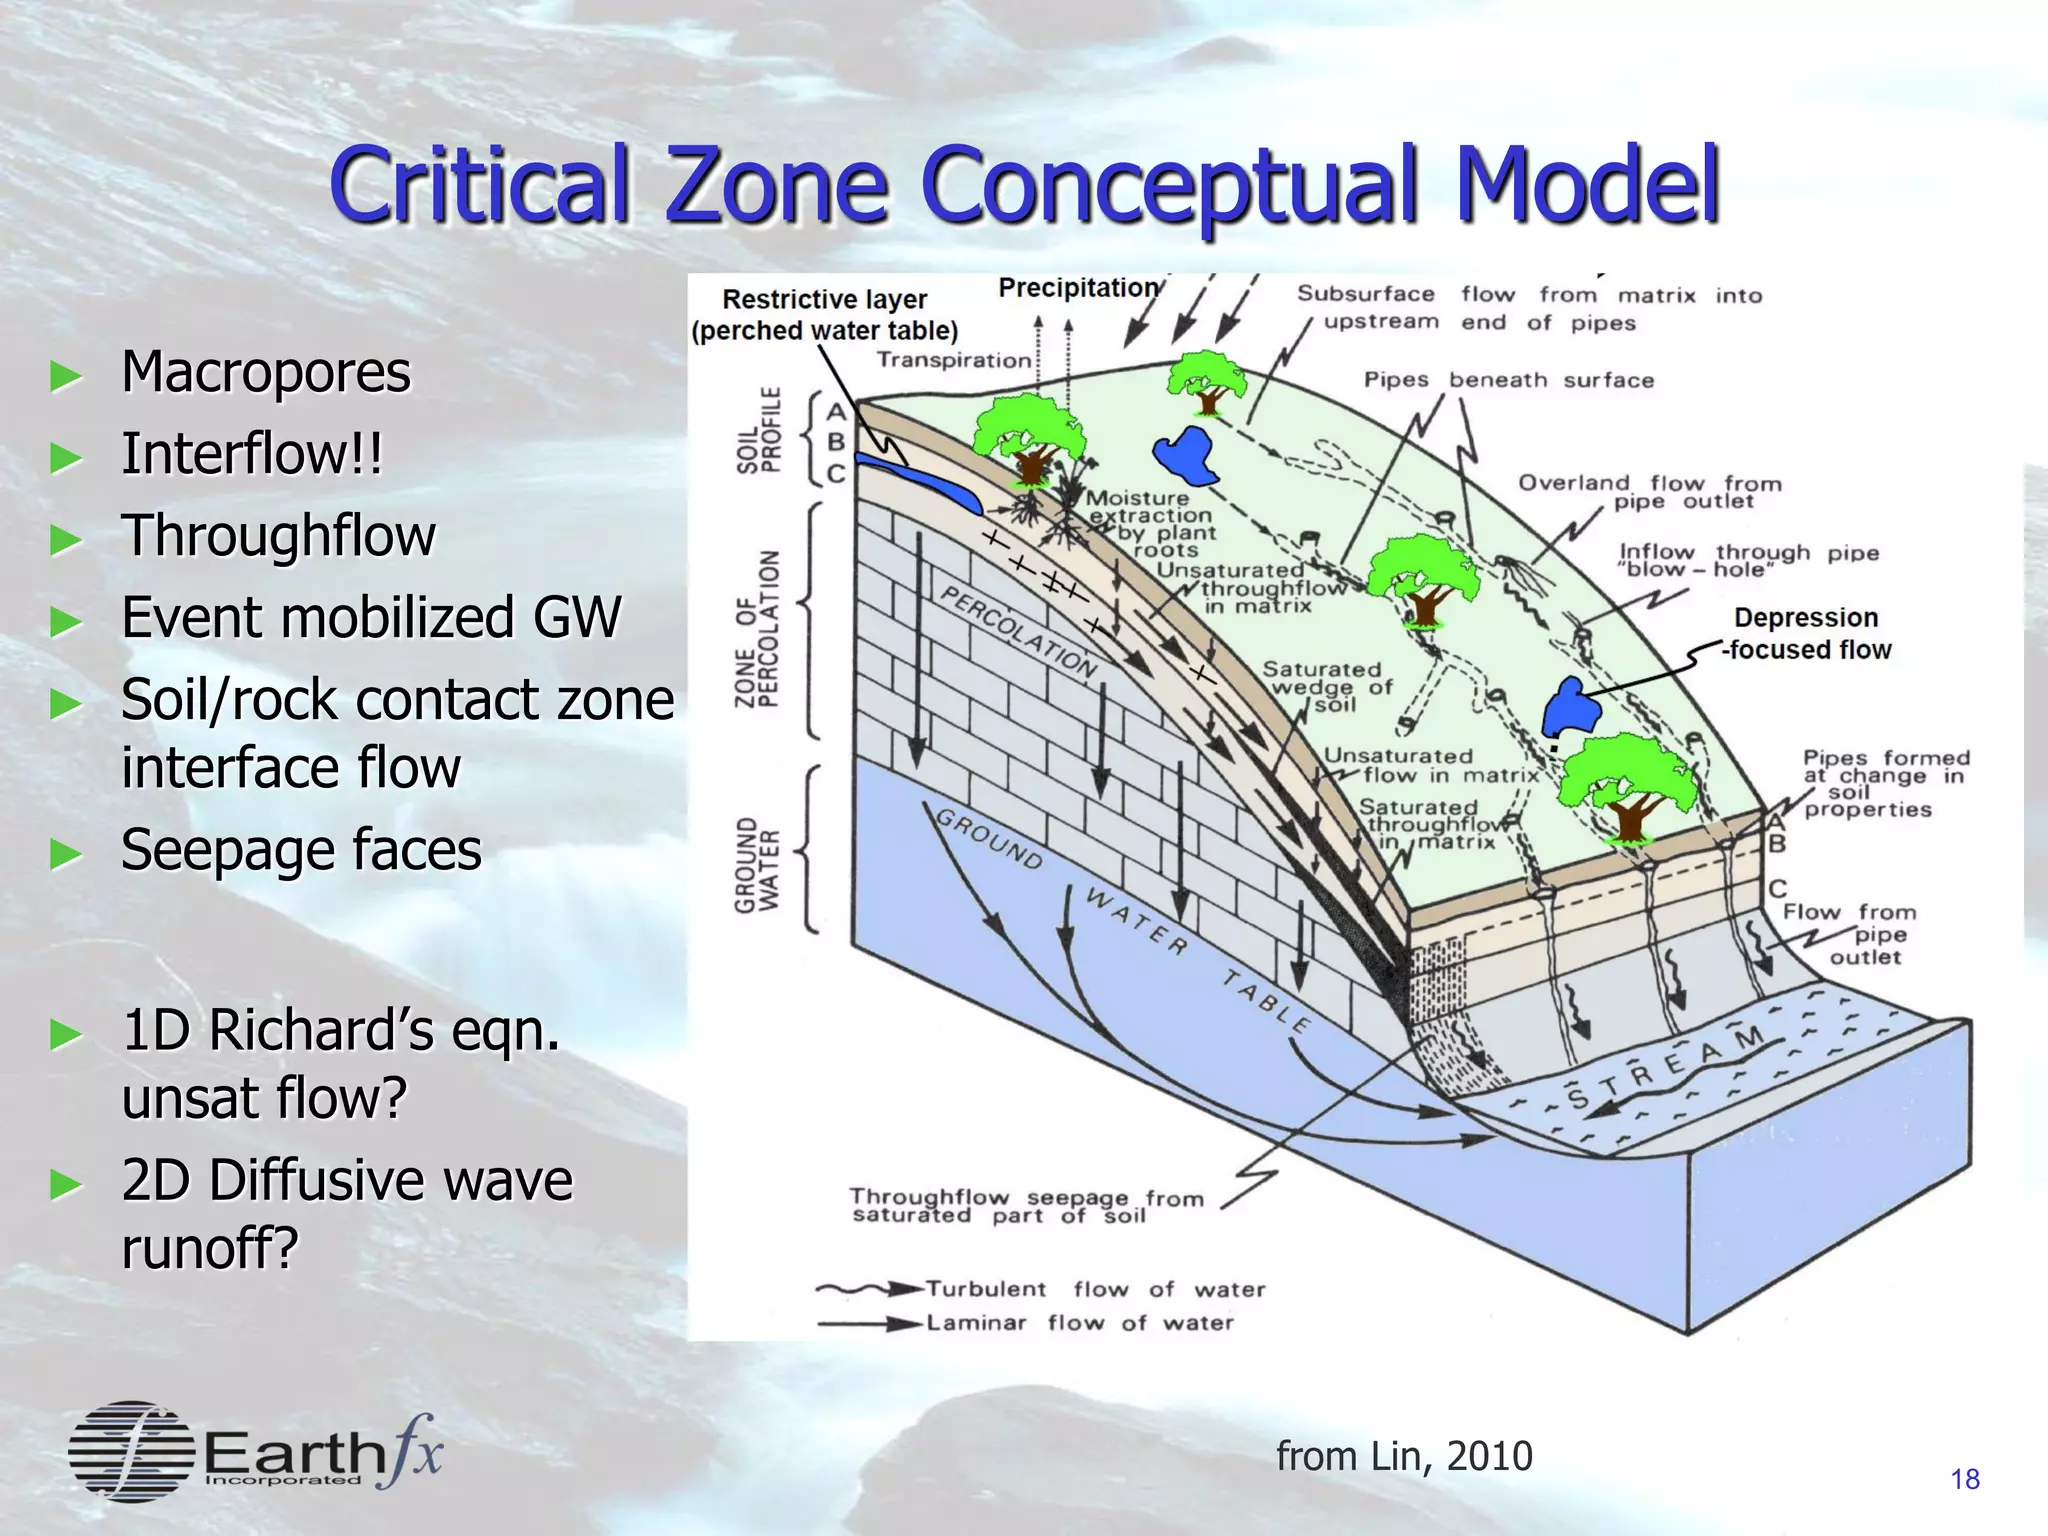
1
Integrated Modelling:
Insights and Blind Spots
Dirk Kassenaar
Earthfx Inc.
2
Blind Spots
► “The only thing worse than being
blind is having sight but no vision”
Hellen Keller (1880-1968)
► We all have a blind spot at our optic
nerve connection.
 Your blind spot is only 20 degrees off
your main center of vision line!
 Our brain “post-processes” it away.
3
Modelling Blind Spots
► Why are blind spots common in integrated modelling?
 Each discipline (Hydrology, Hydraulics and Hydrogeology) has
traditionally “simplified” the others in order to solve their problems.
 Those simplifications become blind spots when developing an
integrated model
► The temptation is to defer addressing the blind spots until
an “integration” phase late in the model development
project.
4
Insights and Blind Spots
► The only thing worse than being blind is having sight but no vision”
► Blindness: Uncoupled modelling
 Historic simplifications prevent us from true understanding
► Sight: Integrated modelling
 Better, but not enough if historic blind spots are not addressed
► Vision: Knowing where to look
 Insights are usually located in the blind spots
 Integrated modelling starts at the conceptualization phase
► Know, and address, the blind spots early in the modelling process
5
Earthfx SWP Fully Integrated Models
► Every project is an opportunity, for
both the client and consultant
► Our goal at Earthfx was to
complete Tier 3 studies using the
best available modelling technology
► We would like to thank our SWP
clients for their vision.
6
Model Selection
► Blindness: My code is better than your code
 My code is fully-integrated, fully distributed, physically-based, multi-
processor, open-source with fully-automated parameter-estimation
and a “use-friendly” interface.
► Insight: The difference between model codes is generally
less important than the skill and vision of the modelling team
 Insight: All integrated models work in humid glacial terrain
 However: Mackay Watershed: 70 percent of the study area is muskeg
on discontinuous permafrost (need a good frozen ground module).
7
GW/SW Partitioning
► Blindness: Attempting to quantify and partition the GW and
SW components of flow
► Insight:
 Water does not care what we call it: Stop trying to classify it and put
it into fixed buckets.
 Water moves seamlessly and continuously between domains
 Anything we do in the watershed will move water from one bucket to
another in any case….
88
Aquifer Head vs. Stream Stage
• GW/SW discharge
reverses during
each storm event
• Baseflow
separation?
Good luck..
• GSFLOW Simulated Hydrograph at Oro-Hawkstone stream gauge
Storm Event Reversal:
Stream level higher than aquifer
Dry period:
Aquifer level higher than
stream = GW discharge
9
GW Recharge
► Blindness: GW Recharge rates are strongly correlated with
surficial geology
► Insight: Groundwater feedback dominates
 Surficial geology is important only where there is no GW interaction
► E.g. the top of the ORM
 GW feedback dominates event runoff response
► Even the SW modellers think so: They referred to the “contributing area”
to understand event response
 Attempting to estimate recharge without assessing fluctuating water
table feedback is nearly impossible.
10
GW Feedback: Dunnian Runoff
► Runoff that occurs off fully saturated soils
 Occurs when the water table is at or near surface
 Not sensitive to surficial material K
► Can create runoff from saturated gravels
 Spatially controlled: Tends to occur in stream valley areas
 Seasonally controlled: Tends to occur in spring when WT is high
► Not sensitive to rainfall intensity or model time step
Unsaturated
zone
StreamStream
Gravity drainage
Recharge
Ground-water flow
11
How common is Dunnian Runoff?
► Portions of York Region where Dunnian rejected recharge occurs
 Depth to water table less than 2 m
 Also on ORM south flank: flowing wells, springs and headwater seeps
12
Surface Discharge and Time-varying GW Feedback
► The “contributing area” that
generates true runoff
depends on the time-varying
position of the water table
► Milton Tier 3: Dunnian
response area varies
seasonally between 5 and
25% of the watershed area
13
Unsaturated Flow
► Blindness: The SW and GW systems are linked by 1-D
vertical flow through the unsaturated zone.
► Insight: A singular focus on the “unsaturated zone” is wrong
 New Runoff Conceptualization: Event mobilized GW discharge
 New research focus: “The Critical Zone”
 New models: MODFLOW-NWT: Designed specifically for the
simulation of shallow interface flow
14
Trouble: The “Old Water Paradox”
► Hydrologists are re-evaluating basic SW processes
 Jeff McDonnell, 2011 Birdsall-Dreiss Lecture
Rainfall Event
Increase in Streamflow
Deuterium isotope profile shows that
event streamflow is predominantly
“old” water (i.e. water that has been
subject to ET processes)
Conclusion: Storm event
streamflow is mobilized shallow
groundwater!
Time
15
More Trouble…
► Garth van der Kamp, Research Scientist (Groundwater and surface
water interactions), National Hydrology Research Centre, Saskatoon, SK
► Slide from Garth’s IAH 2012 World Congress Keynote Presentation:
► Conceptual flownet
models are wrong –
fail to recognize
exponential
decrease in K
► Active flow in the
shallow zone
dominates
► Agreement with the
event mobilized
groundwater theory
16
NSF “Critical Zone” Conceptual Model
► In 2001 the US National Science Foundation (NSF) began
work on a new “framework” for shallow earth science
research
 More comprehensive approach than just GW/SW, unsat flow, etc.
 Includes water, climate, vegetation (carbon cycle), energy processes
► New terminology: the “Critical Zone”
 Definition: “where rock meets life”
 “From the tops of the vegetation down into the groundwater”
► NSF funding of “Critical Zone Observatories” (CZOs)
 Multiple research sites set up to study CZ processes
 http://www.criticalzone.org
17
NSF “Critical Zone” Research Approach
18
Critical Zone Conceptual Model
► Macropores
► Interflow!!
► Throughflow
► Event mobilized GW
► Soil/rock contact zone
interface flow
► Seepage faces
► 1D Richard’s eqn.
unsat flow?
► 2D Diffusive wave
runoff?
from Lin, 2010
19
Integrated Modelling is Different
► Integrated modelling forces us to address the blind spots (assumptions
and simplifications) we make about the “other” (SW or GW) system
► Integrated modelling is better for GW modelers, because:
 It allows the use of measured fluxes (precip and total streamflow)
 Forces us to fully address transient response, storage and the wide range of
GW flow rates
► Integrated modelling is better for SW modelers, because:
 Storm response (runoff generation) can be include water table feedback and
event mobilized shallow system storage
 Integrated modelling is physically based and distributed (no “lumped”
parameters)
20
Next: Integrated Modelling at the Engineering Scale
21
Flow
Schematic
between
multiple
excavations
21
(With Average
Takings)
11,175 m³/day
4,048 m³/day
10,675 m³/day
2222
Overland
Flow
Simulation
(With Average
Accumulating
Overland Runoff)
23
Integrated Assessment of Offsite Discharge
► Whether it is GW or SW discharging from the quarry pit does not matter
► Integrated assessment:
 No blind spots or pre-conceived assumptions
 No need to partition the assessment of impact
24
Conclusions
► Integrated Modelling is different; It requires:
 Integrated data management
► Data silos and barriers will only hide the relationships and response lag
between the systems
► You cannot build an integrated model without an integrated database
See: Sitefx 6.0 and VIEWLOG 4.0
 Integrated Conceptualization: Start now.
 Integrated calibration
► Don’t become attached to your initial uncoupled calibration estimates!
► Consider re-conceptualization, even late in the integrated calibration
 An integrated and balanced modelling team
► The skill, multi-disciplinary knowledge, and ability of the SW and GW
experts to address their “blind spots” is far more important than the
choice of model code
25
Integrated Modelling: Final Insight
► Blind Spot: Process flow
charts are a good way to
communicate the concepts of
integrated modelling
► Insight: FAIL
 A good conceptual cartoon
always helps
 Look at those clouds!

Integrated Modelling: Insights and Blind Spots

  • 1.
    1 Integrated Modelling: Insights andBlind Spots Dirk Kassenaar Earthfx Inc.
  • 2.
    2 Blind Spots ► “Theonly thing worse than being blind is having sight but no vision” Hellen Keller (1880-1968) ► We all have a blind spot at our optic nerve connection.  Your blind spot is only 20 degrees off your main center of vision line!  Our brain “post-processes” it away.
  • 3.
    3 Modelling Blind Spots ►Why are blind spots common in integrated modelling?  Each discipline (Hydrology, Hydraulics and Hydrogeology) has traditionally “simplified” the others in order to solve their problems.  Those simplifications become blind spots when developing an integrated model ► The temptation is to defer addressing the blind spots until an “integration” phase late in the model development project.
  • 4.
    4 Insights and BlindSpots ► The only thing worse than being blind is having sight but no vision” ► Blindness: Uncoupled modelling  Historic simplifications prevent us from true understanding ► Sight: Integrated modelling  Better, but not enough if historic blind spots are not addressed ► Vision: Knowing where to look  Insights are usually located in the blind spots  Integrated modelling starts at the conceptualization phase ► Know, and address, the blind spots early in the modelling process
  • 5.
    5 Earthfx SWP FullyIntegrated Models ► Every project is an opportunity, for both the client and consultant ► Our goal at Earthfx was to complete Tier 3 studies using the best available modelling technology ► We would like to thank our SWP clients for their vision.
  • 6.
    6 Model Selection ► Blindness:My code is better than your code  My code is fully-integrated, fully distributed, physically-based, multi- processor, open-source with fully-automated parameter-estimation and a “use-friendly” interface. ► Insight: The difference between model codes is generally less important than the skill and vision of the modelling team  Insight: All integrated models work in humid glacial terrain  However: Mackay Watershed: 70 percent of the study area is muskeg on discontinuous permafrost (need a good frozen ground module).
  • 7.
    7 GW/SW Partitioning ► Blindness:Attempting to quantify and partition the GW and SW components of flow ► Insight:  Water does not care what we call it: Stop trying to classify it and put it into fixed buckets.  Water moves seamlessly and continuously between domains  Anything we do in the watershed will move water from one bucket to another in any case….
  • 8.
    88 Aquifer Head vs.Stream Stage • GW/SW discharge reverses during each storm event • Baseflow separation? Good luck.. • GSFLOW Simulated Hydrograph at Oro-Hawkstone stream gauge Storm Event Reversal: Stream level higher than aquifer Dry period: Aquifer level higher than stream = GW discharge
  • 9.
    9 GW Recharge ► Blindness:GW Recharge rates are strongly correlated with surficial geology ► Insight: Groundwater feedback dominates  Surficial geology is important only where there is no GW interaction ► E.g. the top of the ORM  GW feedback dominates event runoff response ► Even the SW modellers think so: They referred to the “contributing area” to understand event response  Attempting to estimate recharge without assessing fluctuating water table feedback is nearly impossible.
  • 10.
    10 GW Feedback: DunnianRunoff ► Runoff that occurs off fully saturated soils  Occurs when the water table is at or near surface  Not sensitive to surficial material K ► Can create runoff from saturated gravels  Spatially controlled: Tends to occur in stream valley areas  Seasonally controlled: Tends to occur in spring when WT is high ► Not sensitive to rainfall intensity or model time step Unsaturated zone StreamStream Gravity drainage Recharge Ground-water flow
  • 11.
    11 How common isDunnian Runoff? ► Portions of York Region where Dunnian rejected recharge occurs  Depth to water table less than 2 m  Also on ORM south flank: flowing wells, springs and headwater seeps
  • 12.
    12 Surface Discharge andTime-varying GW Feedback ► The “contributing area” that generates true runoff depends on the time-varying position of the water table ► Milton Tier 3: Dunnian response area varies seasonally between 5 and 25% of the watershed area
  • 13.
    13 Unsaturated Flow ► Blindness:The SW and GW systems are linked by 1-D vertical flow through the unsaturated zone. ► Insight: A singular focus on the “unsaturated zone” is wrong  New Runoff Conceptualization: Event mobilized GW discharge  New research focus: “The Critical Zone”  New models: MODFLOW-NWT: Designed specifically for the simulation of shallow interface flow
  • 14.
    14 Trouble: The “OldWater Paradox” ► Hydrologists are re-evaluating basic SW processes  Jeff McDonnell, 2011 Birdsall-Dreiss Lecture Rainfall Event Increase in Streamflow Deuterium isotope profile shows that event streamflow is predominantly “old” water (i.e. water that has been subject to ET processes) Conclusion: Storm event streamflow is mobilized shallow groundwater! Time
  • 15.
    15 More Trouble… ► Garthvan der Kamp, Research Scientist (Groundwater and surface water interactions), National Hydrology Research Centre, Saskatoon, SK ► Slide from Garth’s IAH 2012 World Congress Keynote Presentation: ► Conceptual flownet models are wrong – fail to recognize exponential decrease in K ► Active flow in the shallow zone dominates ► Agreement with the event mobilized groundwater theory
  • 16.
    16 NSF “Critical Zone”Conceptual Model ► In 2001 the US National Science Foundation (NSF) began work on a new “framework” for shallow earth science research  More comprehensive approach than just GW/SW, unsat flow, etc.  Includes water, climate, vegetation (carbon cycle), energy processes ► New terminology: the “Critical Zone”  Definition: “where rock meets life”  “From the tops of the vegetation down into the groundwater” ► NSF funding of “Critical Zone Observatories” (CZOs)  Multiple research sites set up to study CZ processes  http://www.criticalzone.org
  • 17.
    17 NSF “Critical Zone”Research Approach
  • 18.
    18 Critical Zone ConceptualModel ► Macropores ► Interflow!! ► Throughflow ► Event mobilized GW ► Soil/rock contact zone interface flow ► Seepage faces ► 1D Richard’s eqn. unsat flow? ► 2D Diffusive wave runoff? from Lin, 2010
  • 19.
    19 Integrated Modelling isDifferent ► Integrated modelling forces us to address the blind spots (assumptions and simplifications) we make about the “other” (SW or GW) system ► Integrated modelling is better for GW modelers, because:  It allows the use of measured fluxes (precip and total streamflow)  Forces us to fully address transient response, storage and the wide range of GW flow rates ► Integrated modelling is better for SW modelers, because:  Storm response (runoff generation) can be include water table feedback and event mobilized shallow system storage  Integrated modelling is physically based and distributed (no “lumped” parameters)
  • 20.
    20 Next: Integrated Modellingat the Engineering Scale
  • 21.
  • 22.
  • 23.
    23 Integrated Assessment ofOffsite Discharge ► Whether it is GW or SW discharging from the quarry pit does not matter ► Integrated assessment:  No blind spots or pre-conceived assumptions  No need to partition the assessment of impact
  • 24.
    24 Conclusions ► Integrated Modellingis different; It requires:  Integrated data management ► Data silos and barriers will only hide the relationships and response lag between the systems ► You cannot build an integrated model without an integrated database See: Sitefx 6.0 and VIEWLOG 4.0  Integrated Conceptualization: Start now.  Integrated calibration ► Don’t become attached to your initial uncoupled calibration estimates! ► Consider re-conceptualization, even late in the integrated calibration  An integrated and balanced modelling team ► The skill, multi-disciplinary knowledge, and ability of the SW and GW experts to address their “blind spots” is far more important than the choice of model code
  • 25.
    25 Integrated Modelling: FinalInsight ► Blind Spot: Process flow charts are a good way to communicate the concepts of integrated modelling ► Insight: FAIL  A good conceptual cartoon always helps  Look at those clouds!