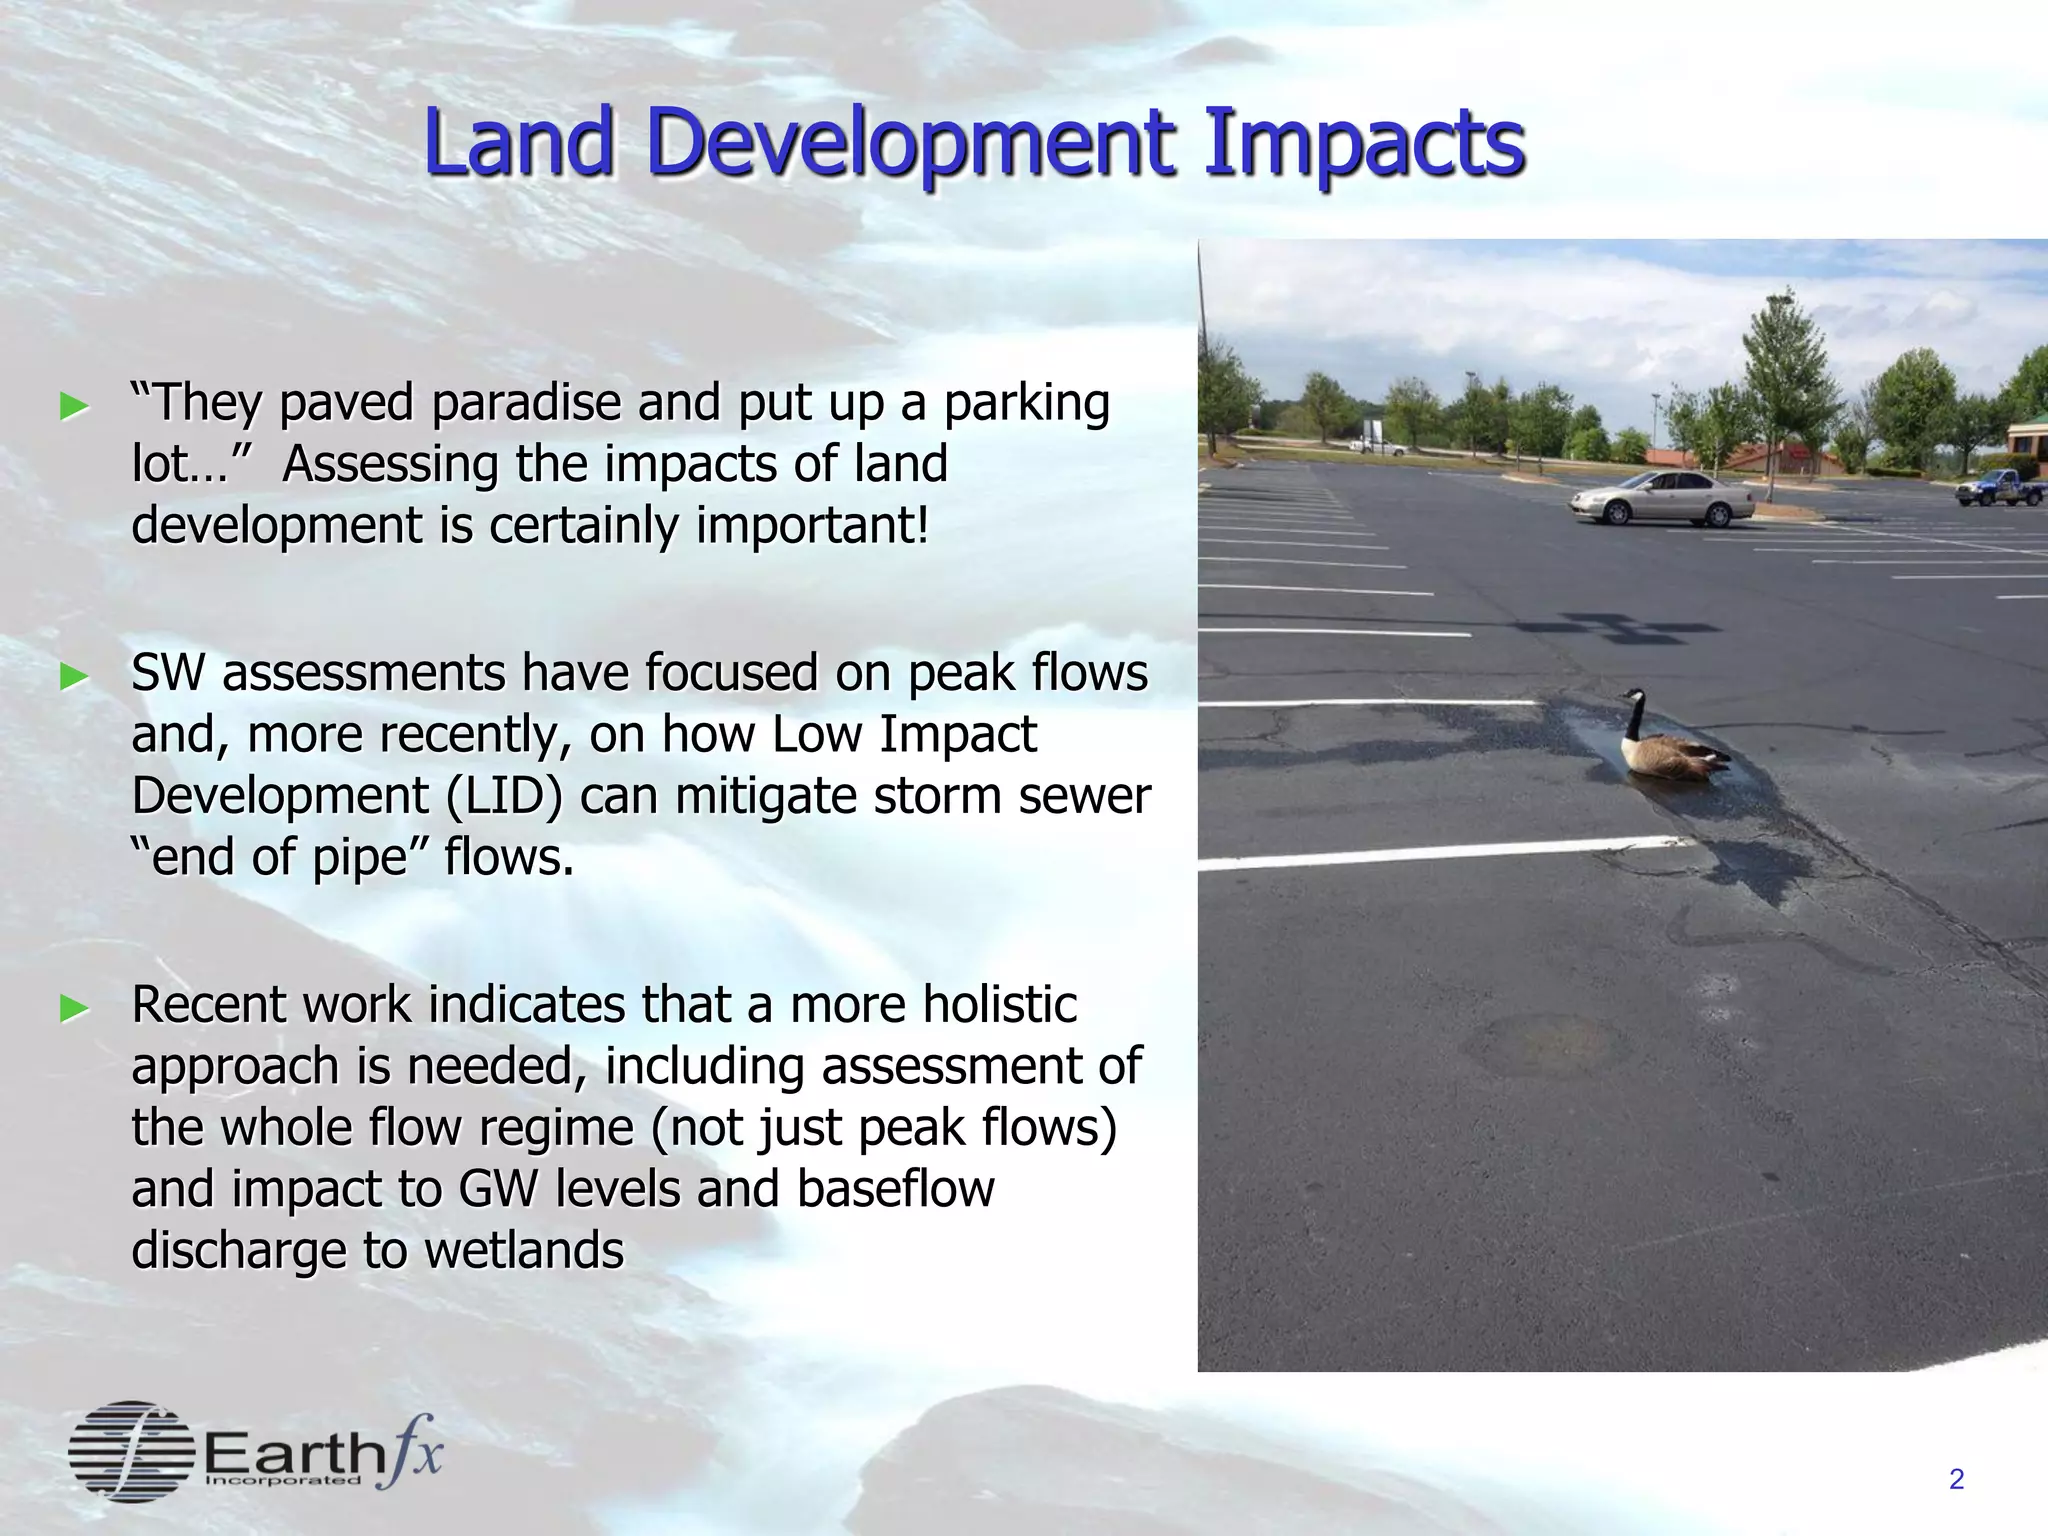
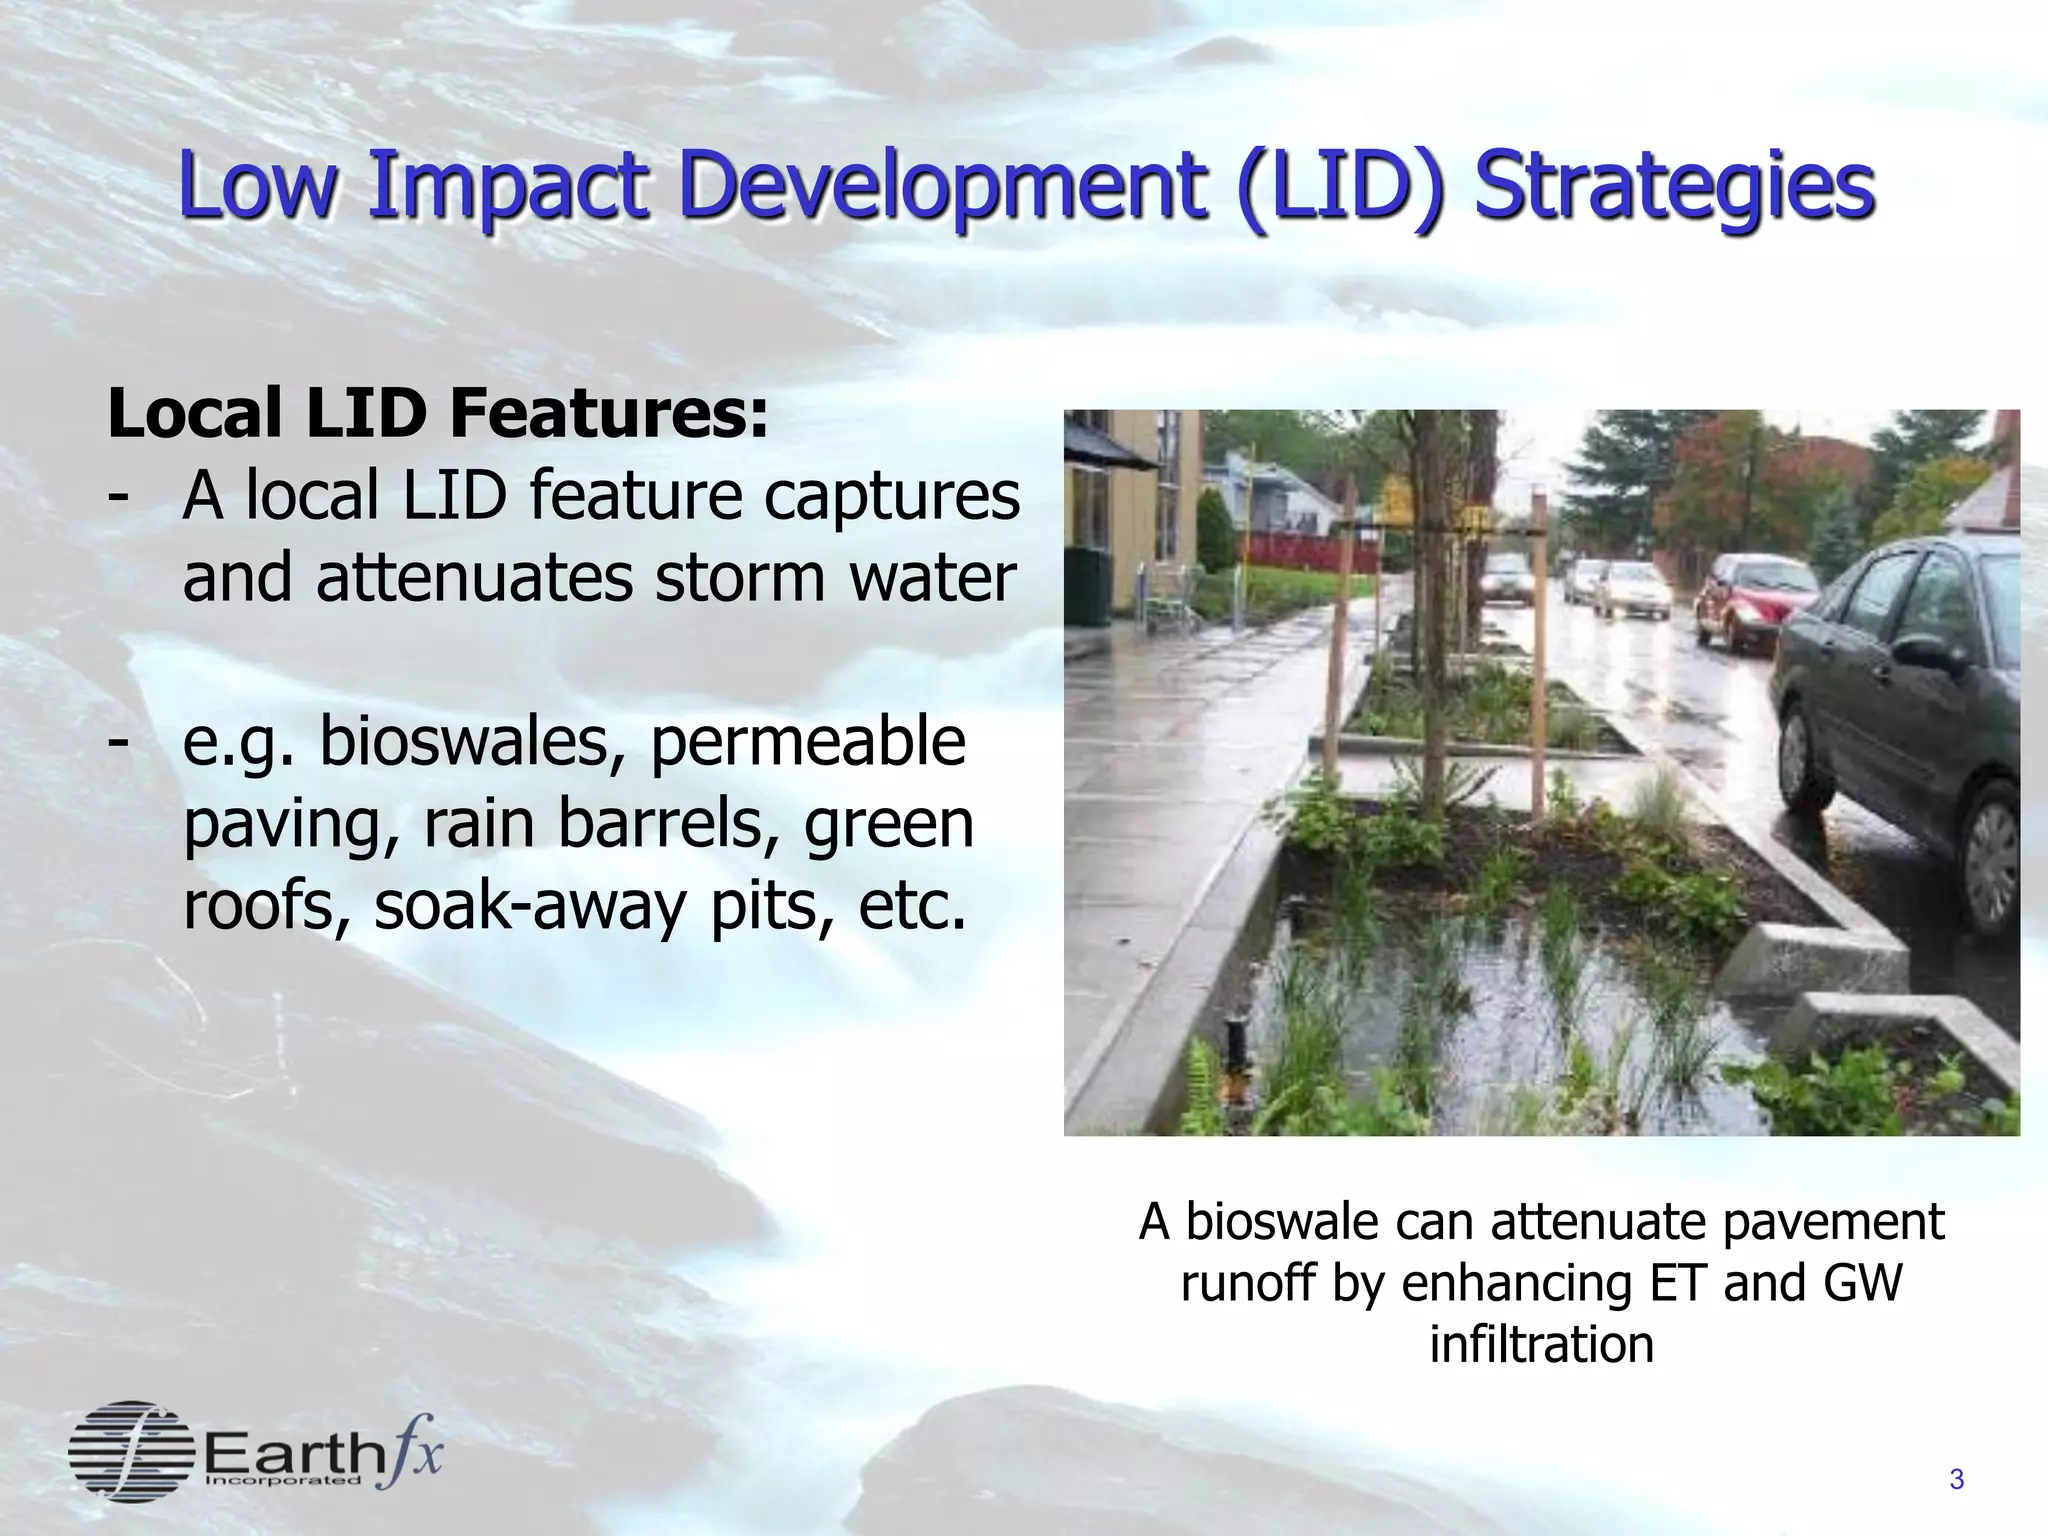
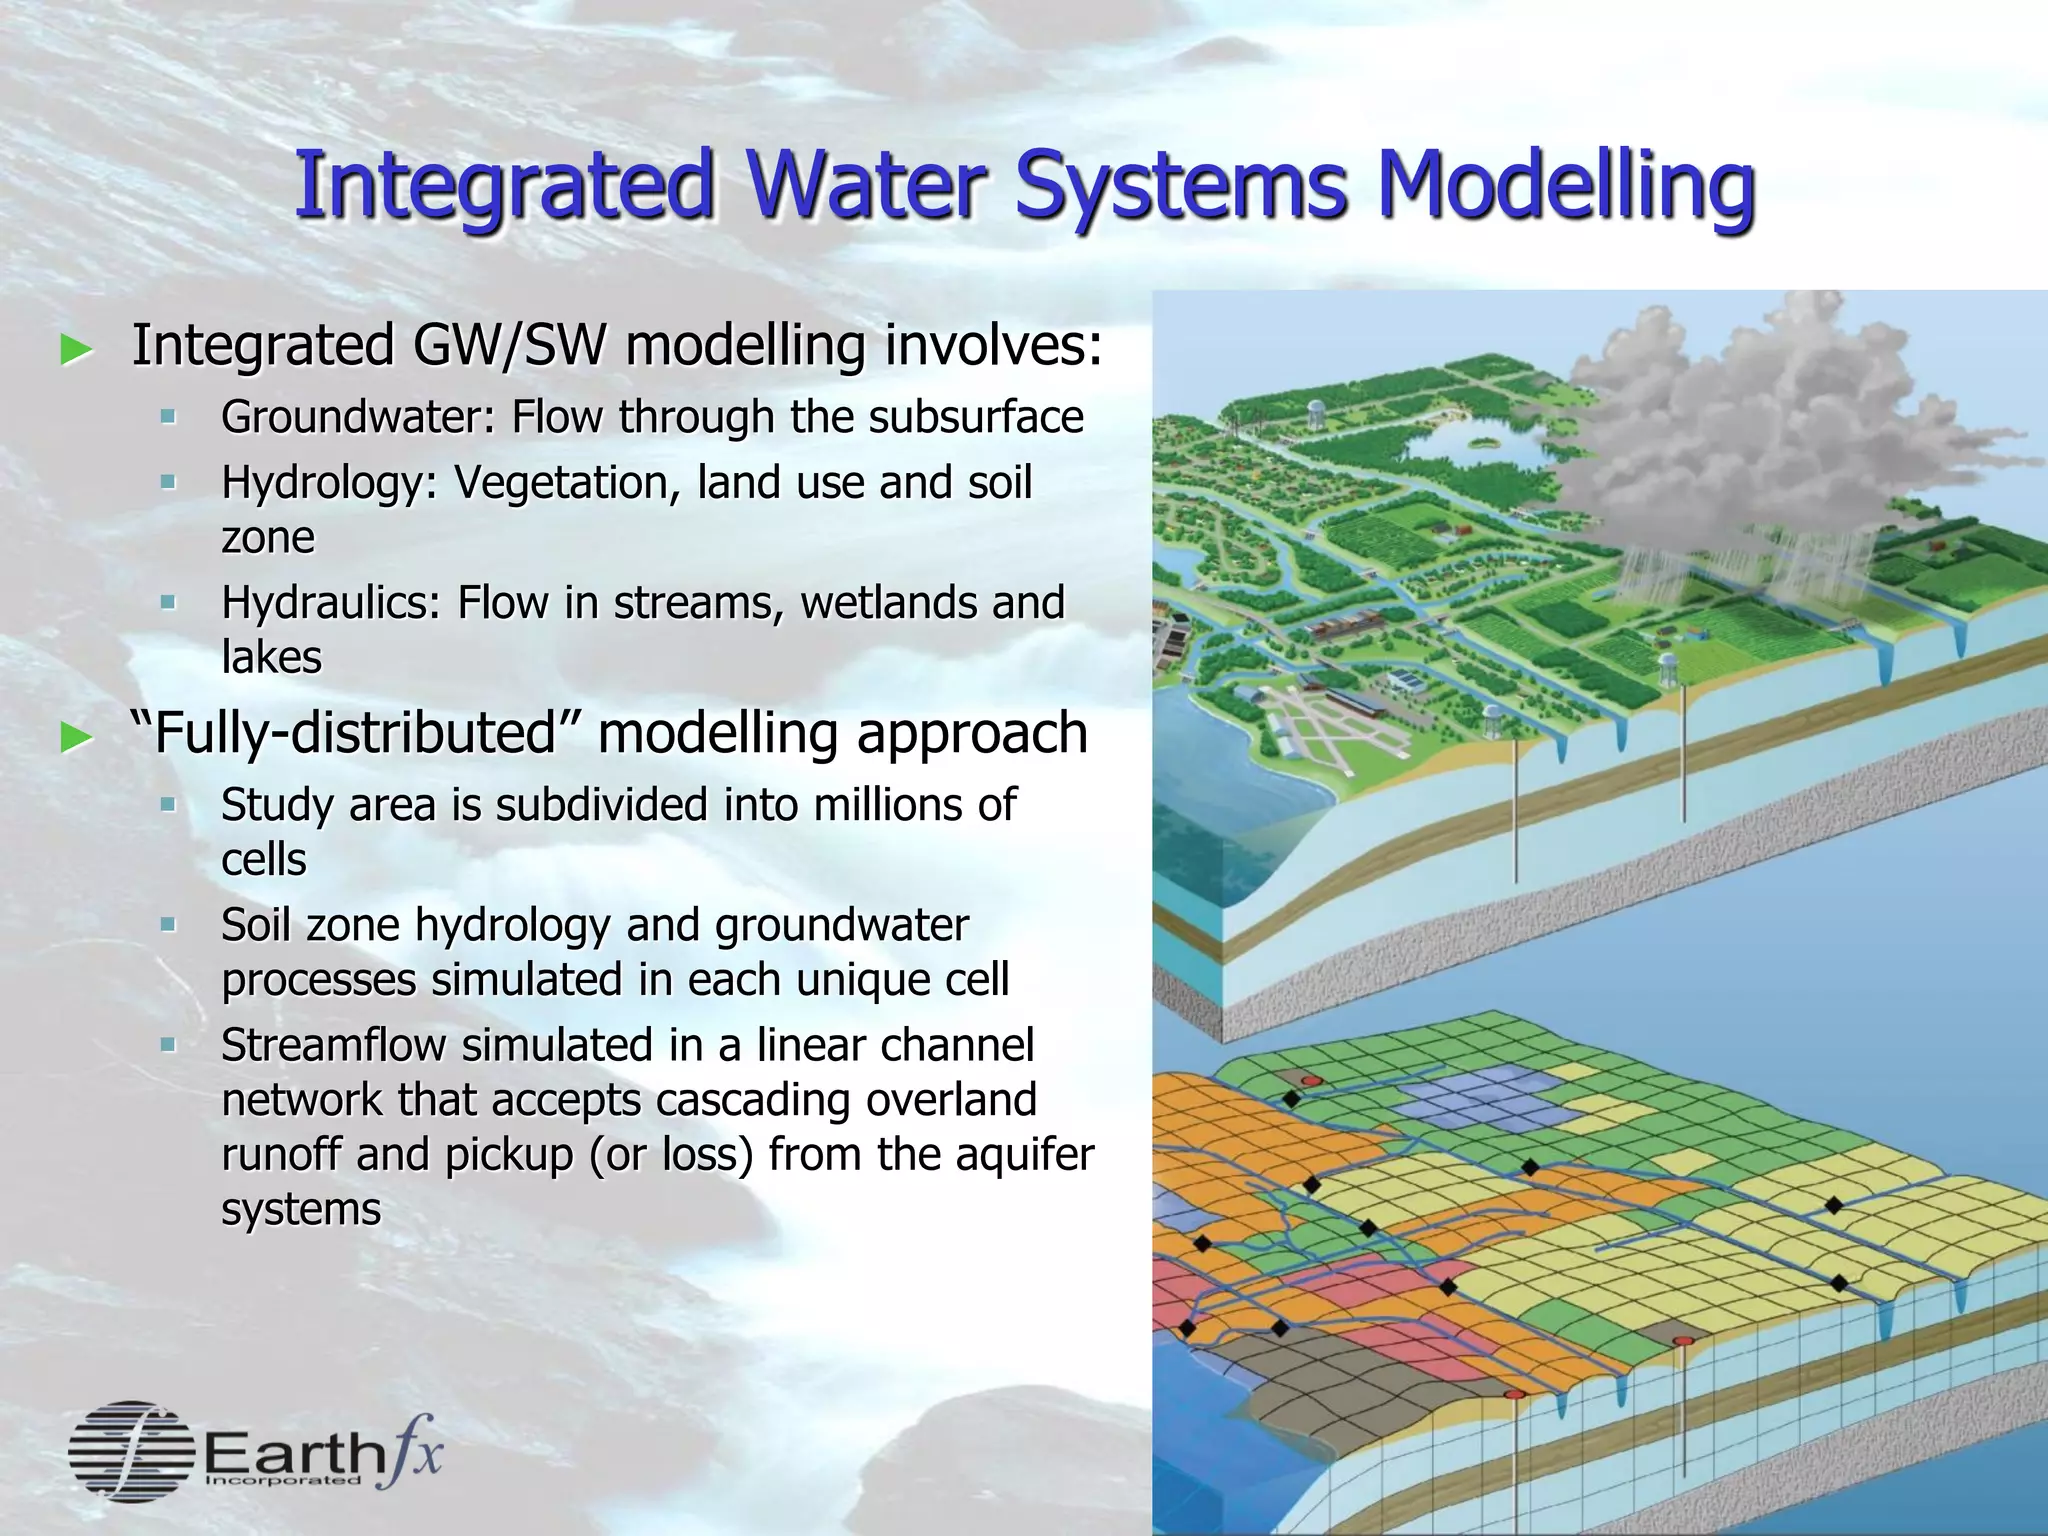
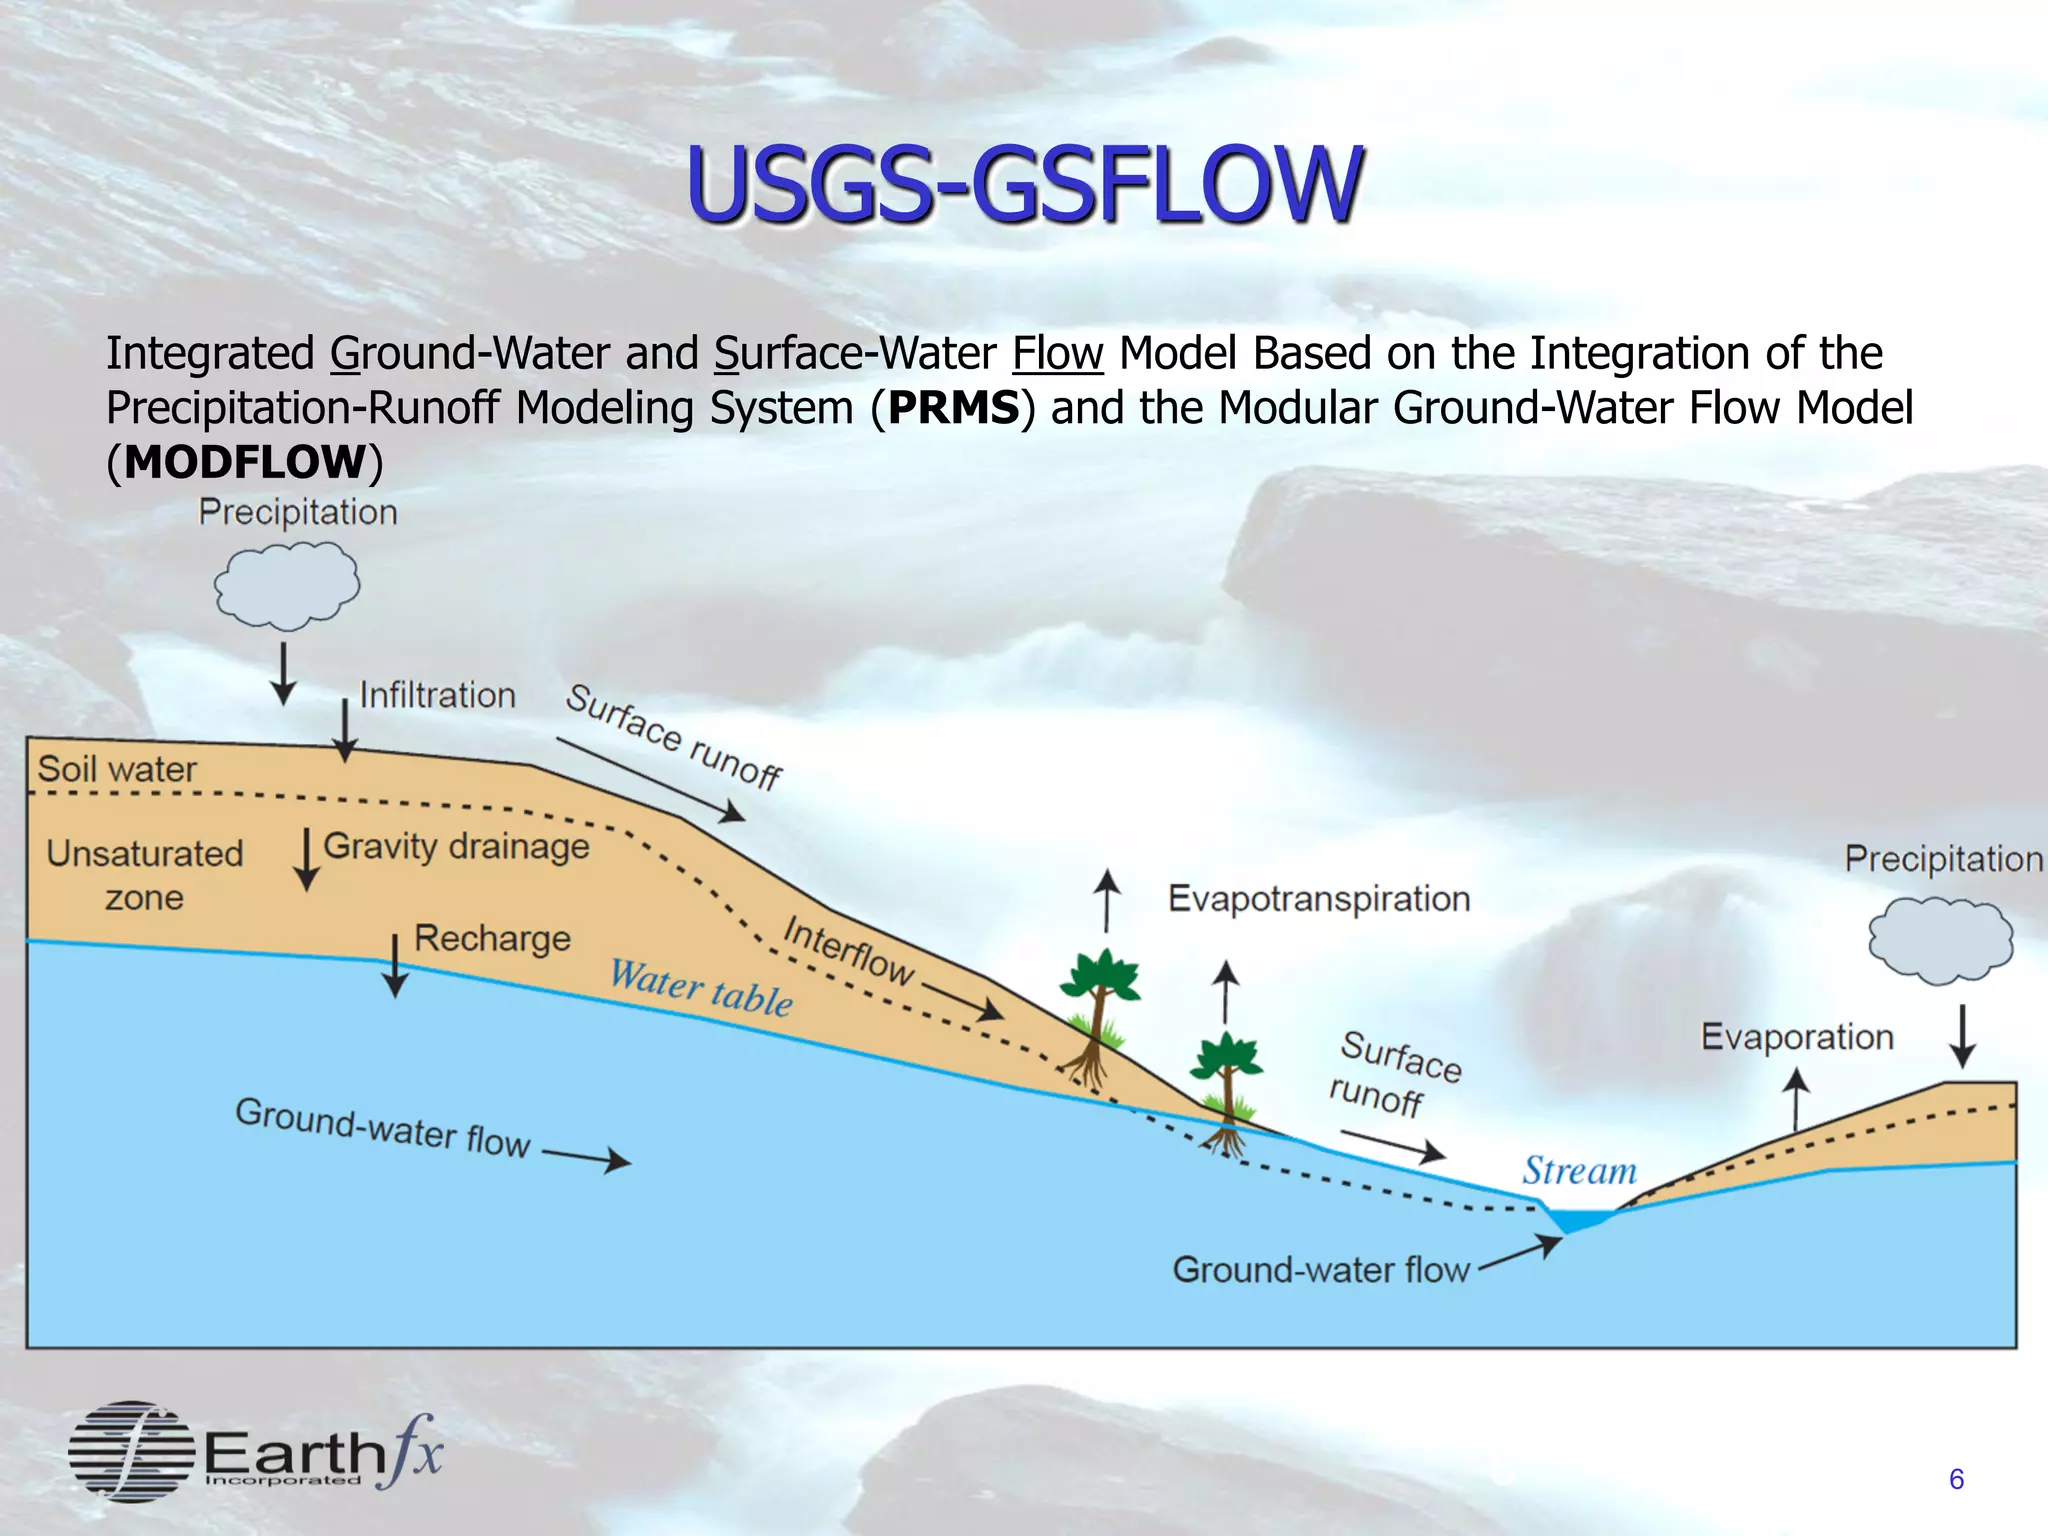
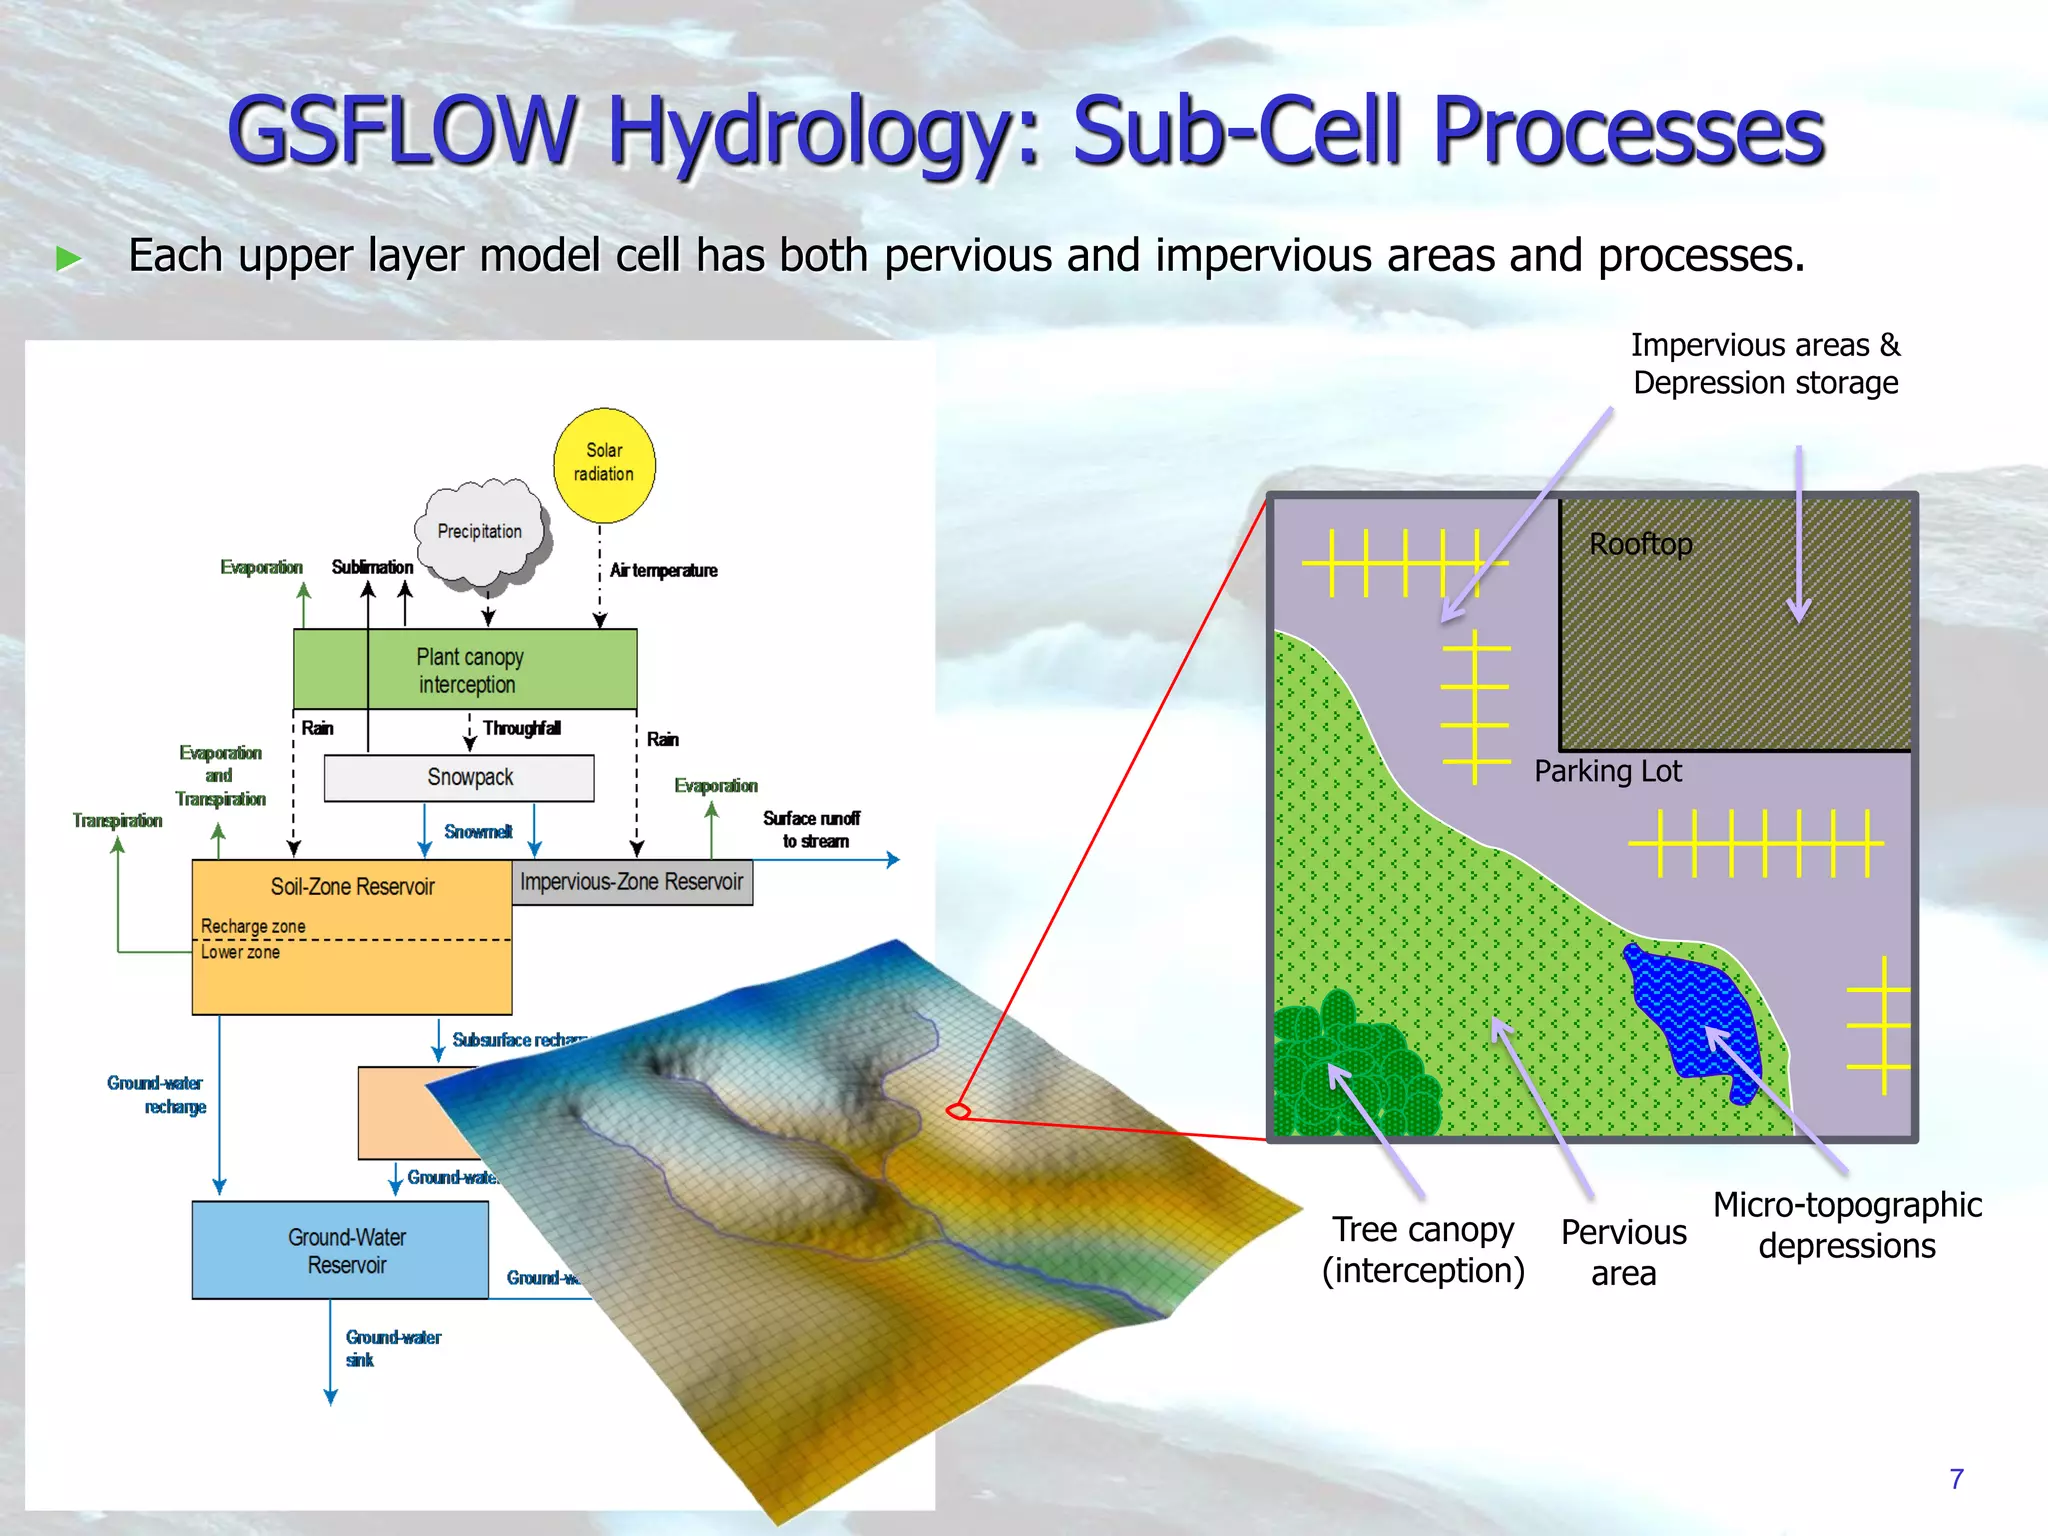
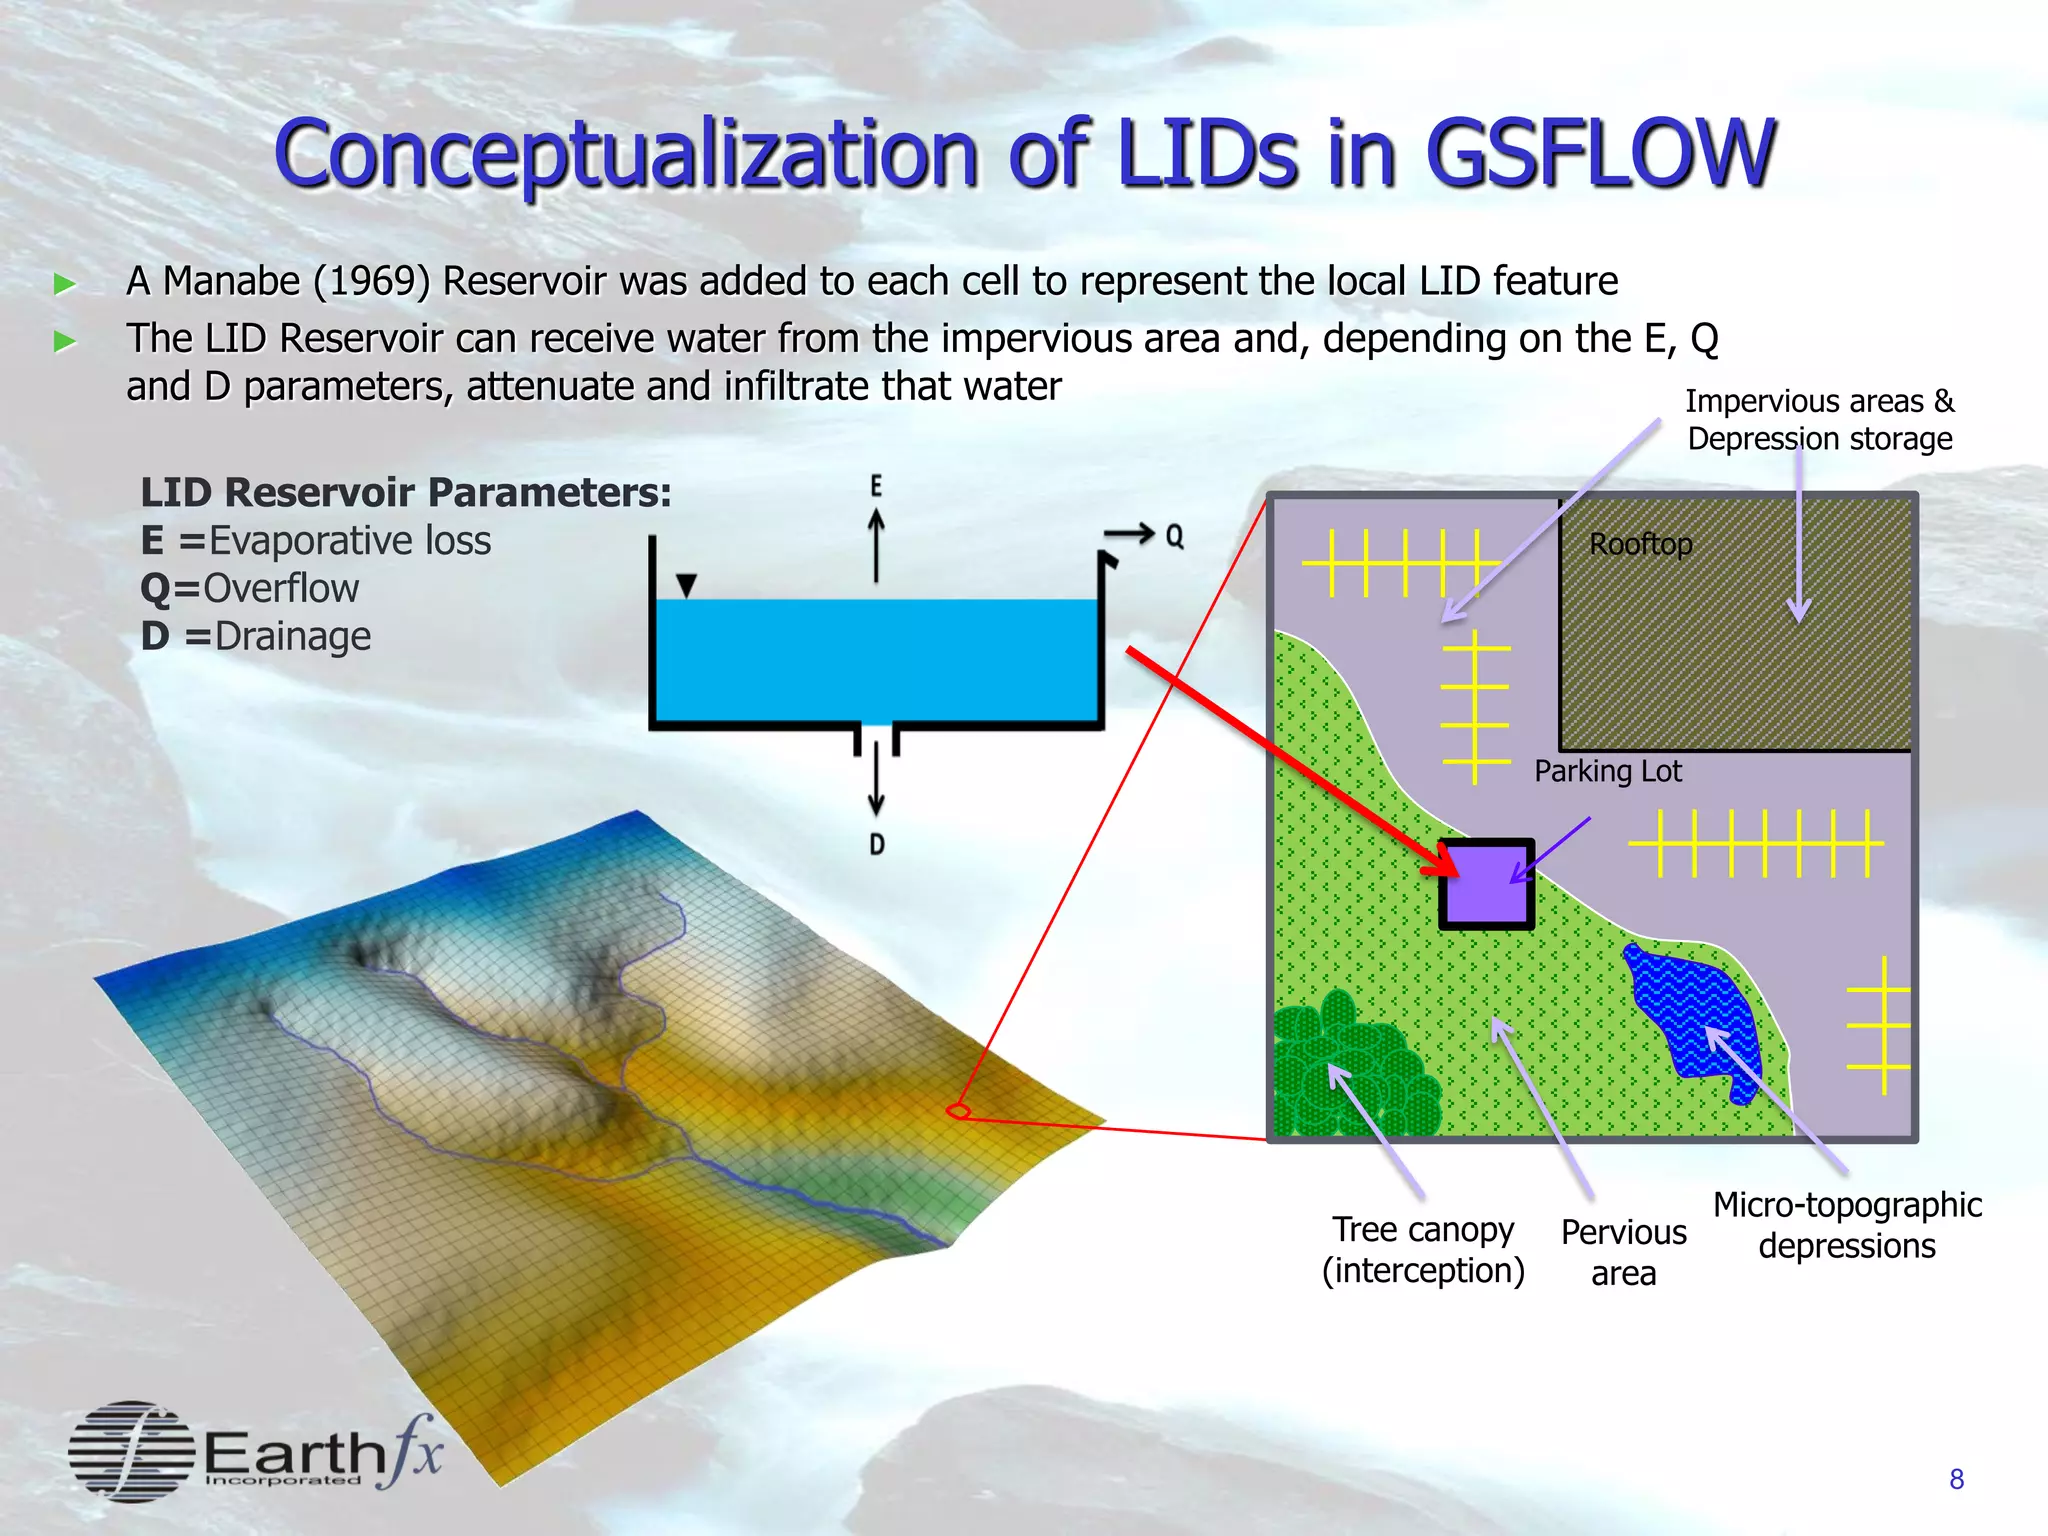
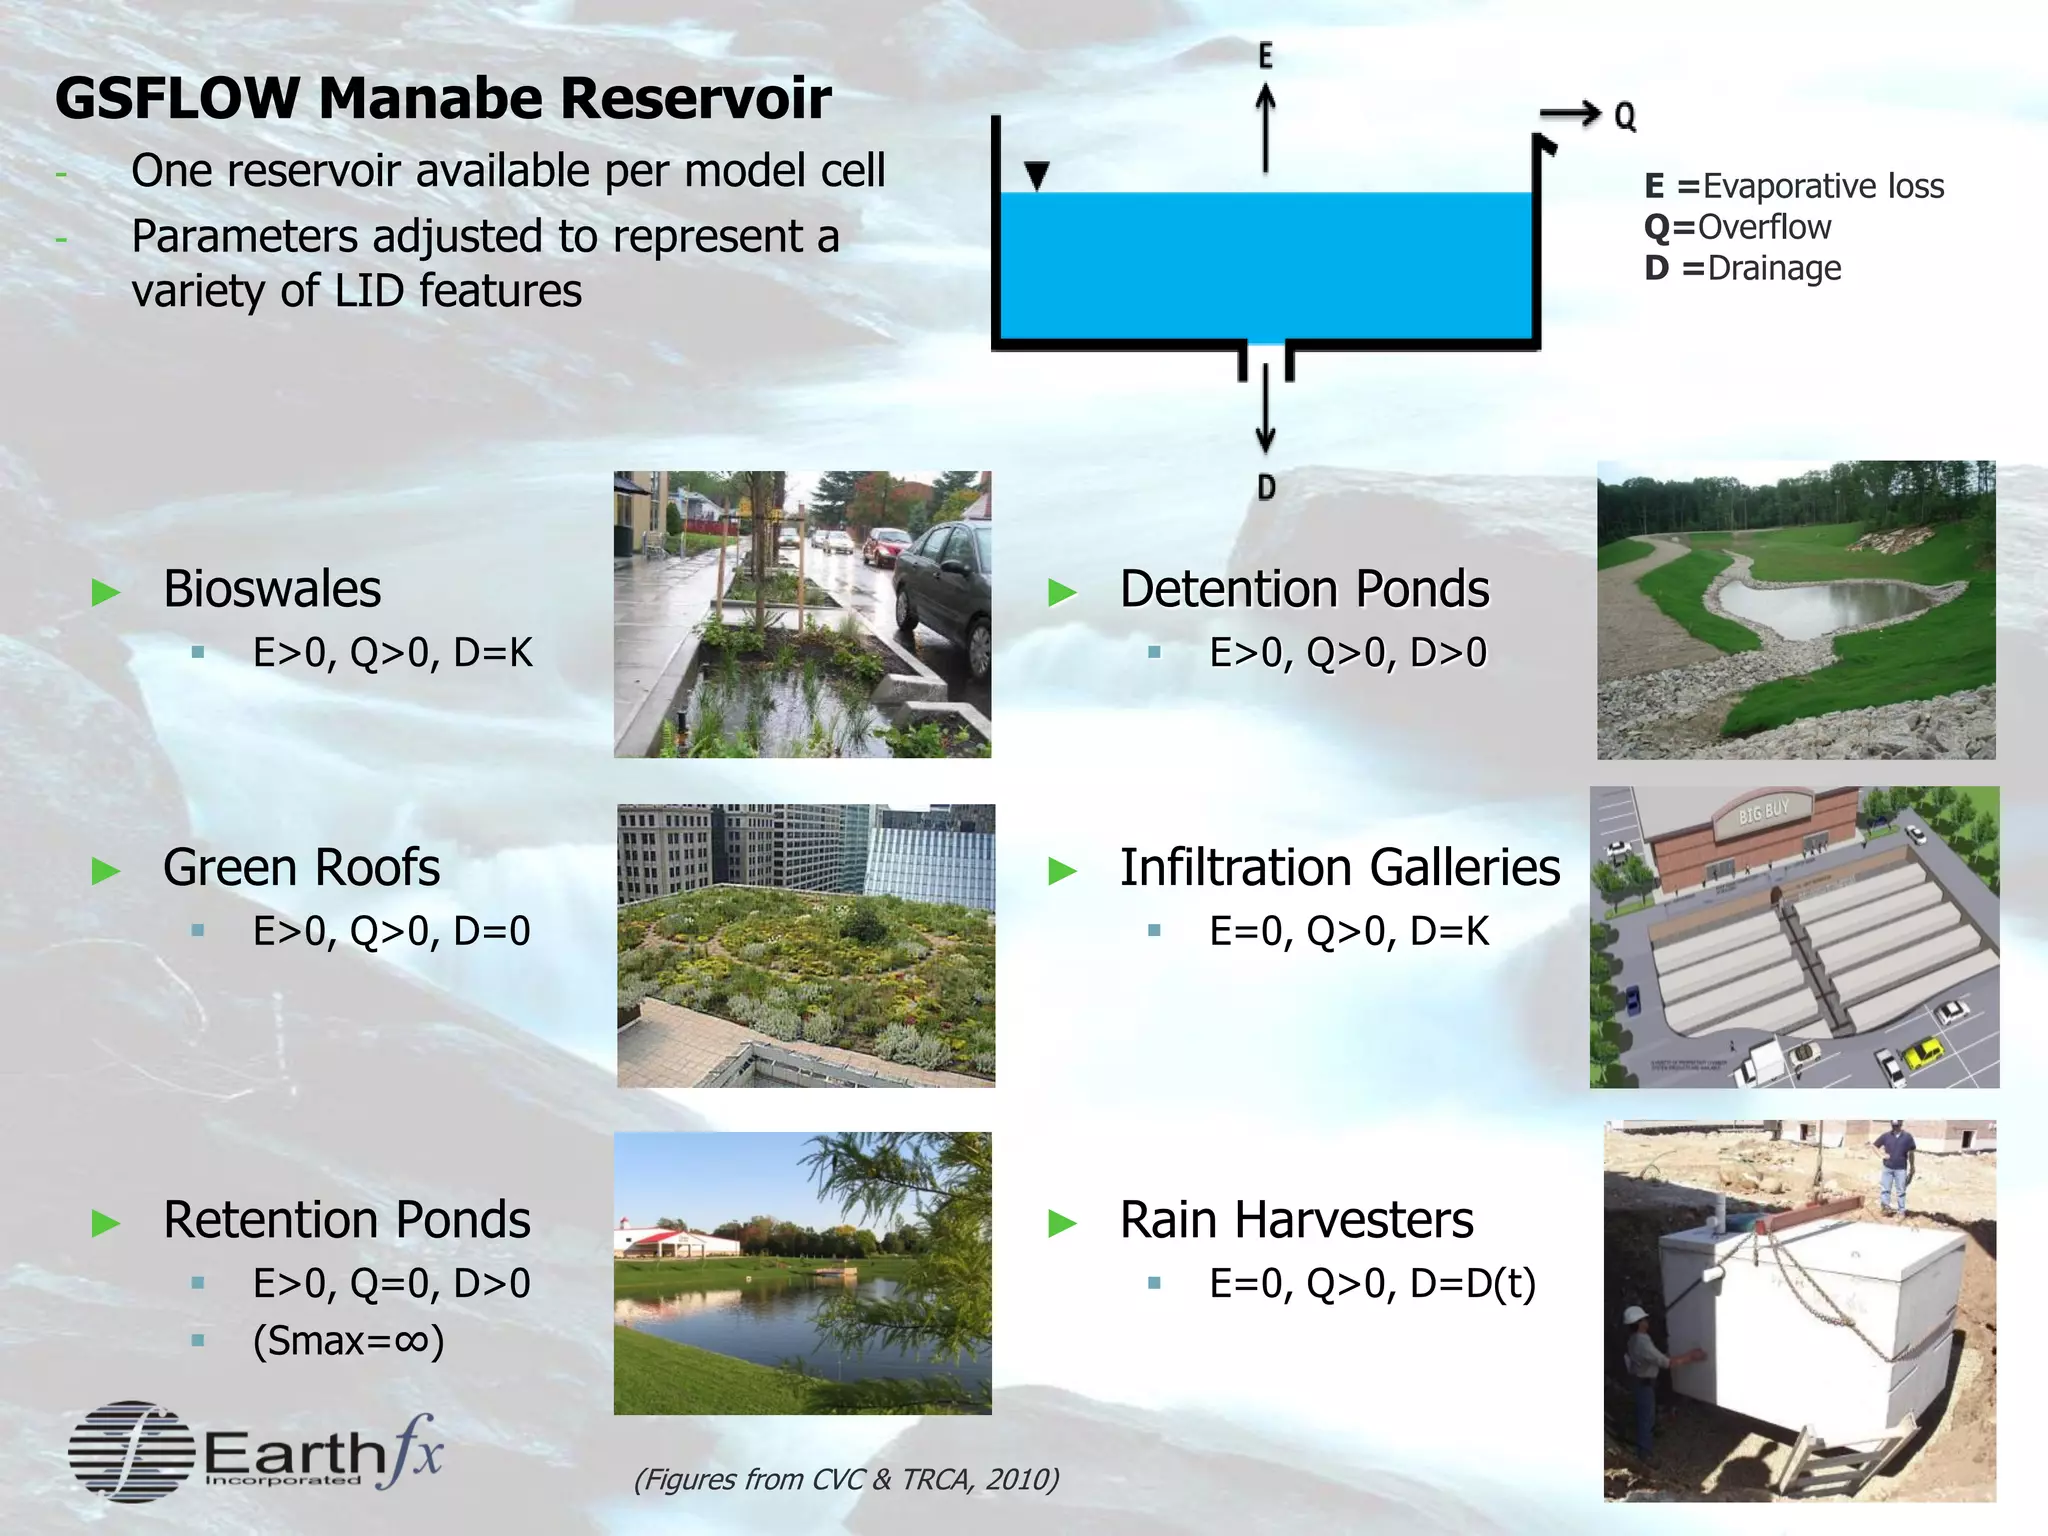
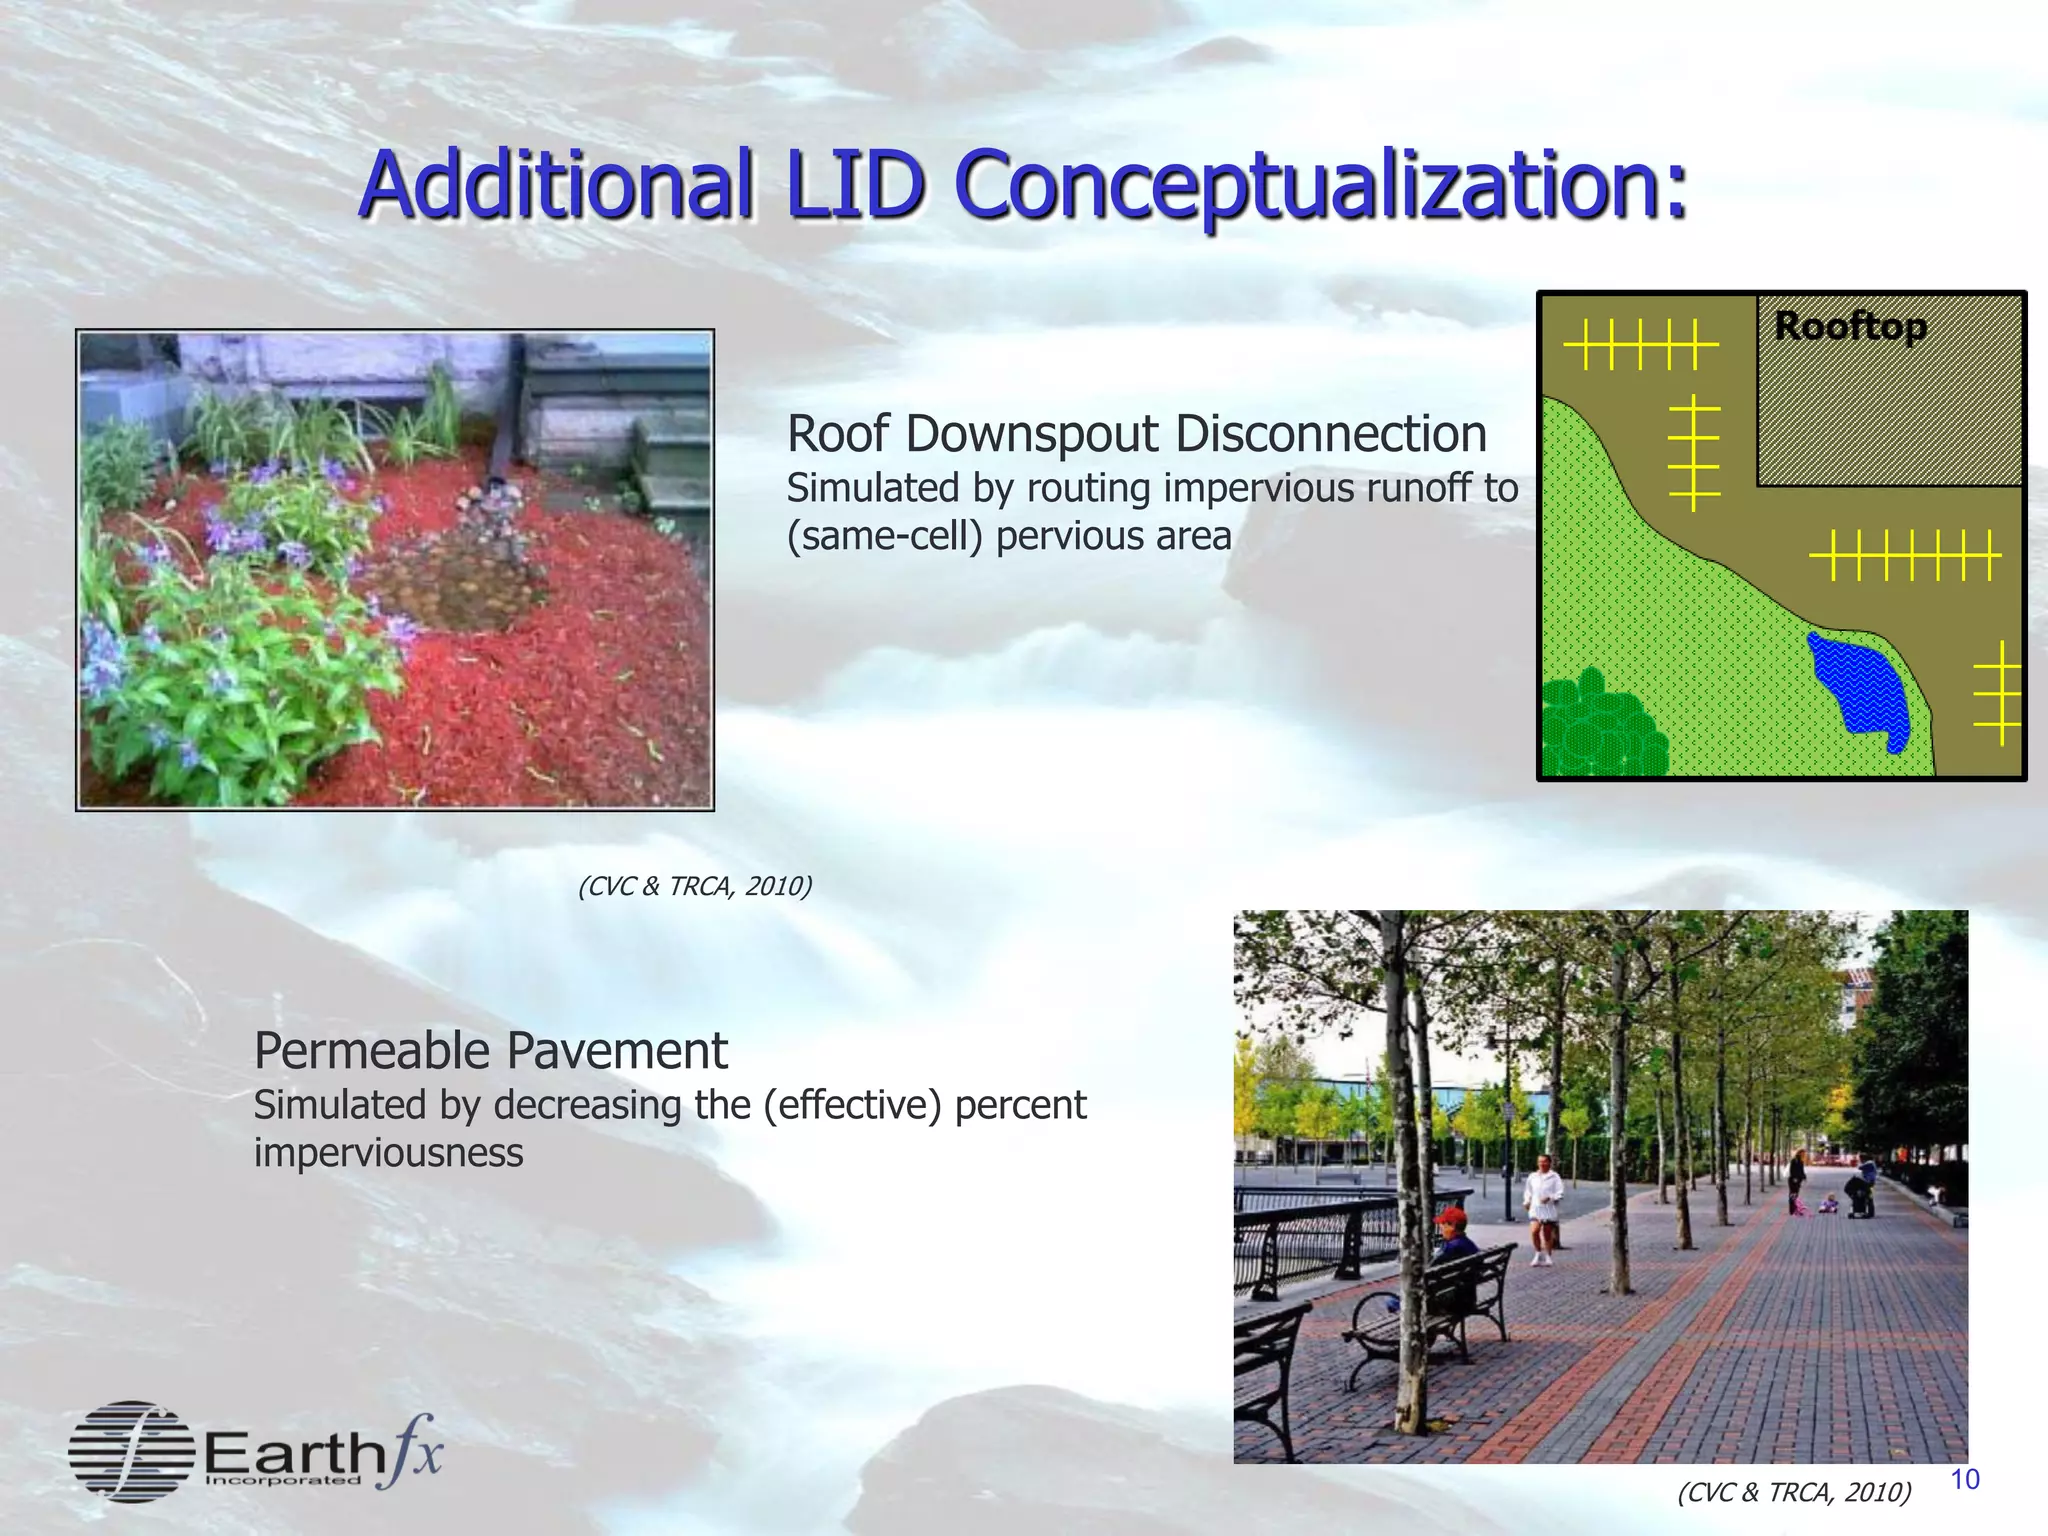
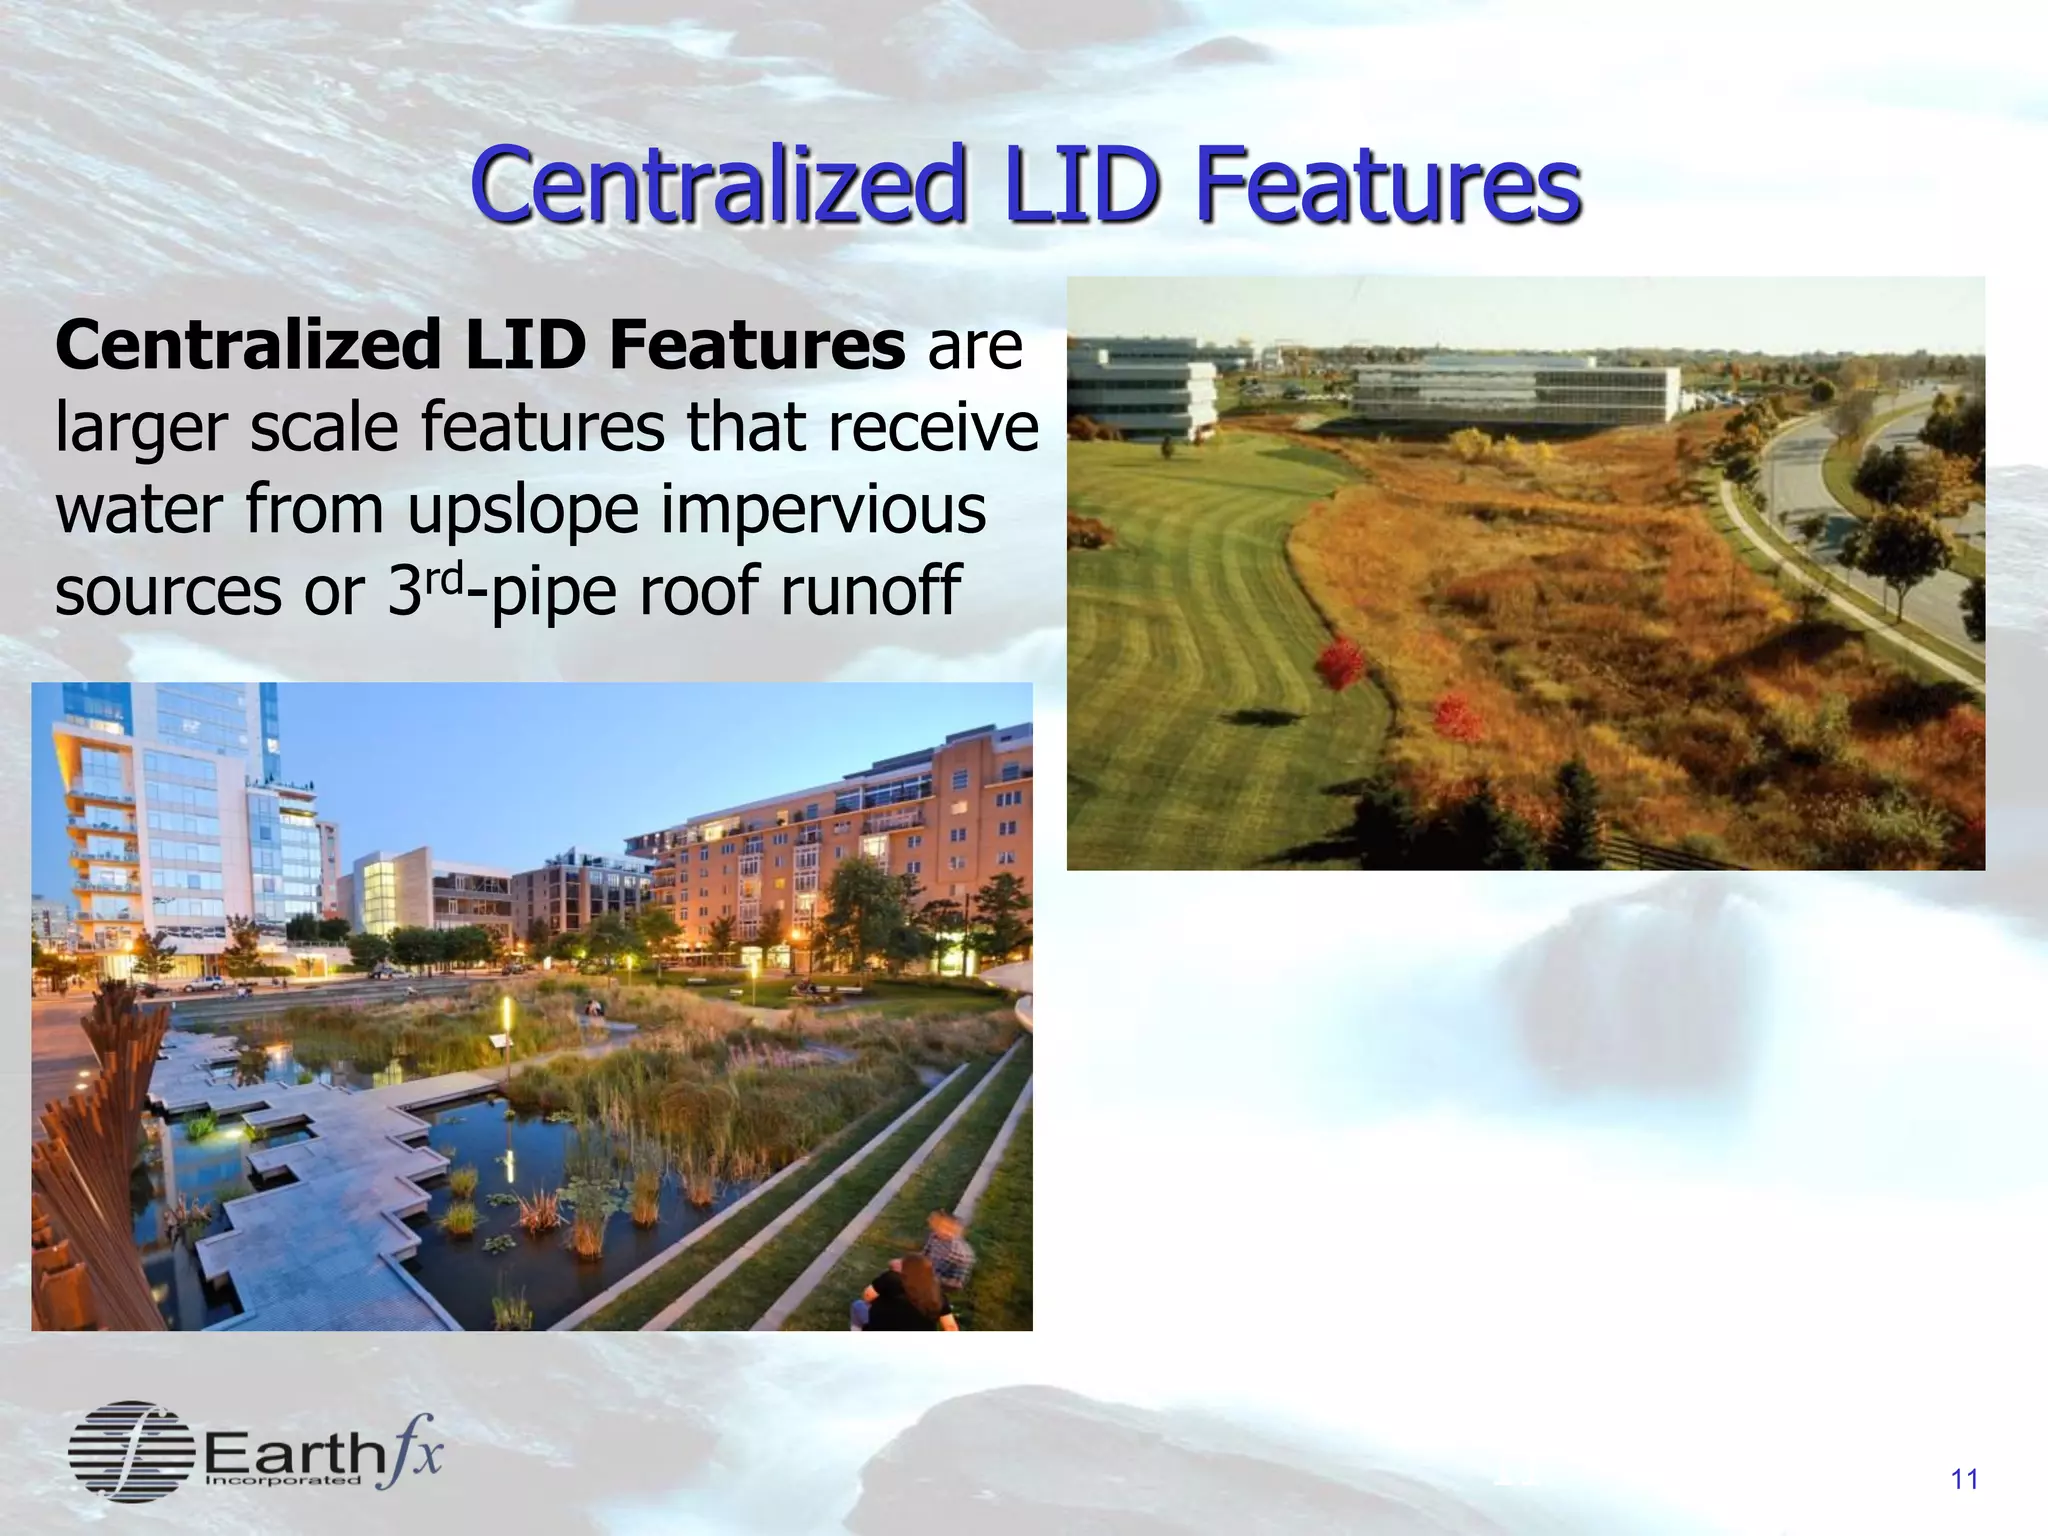
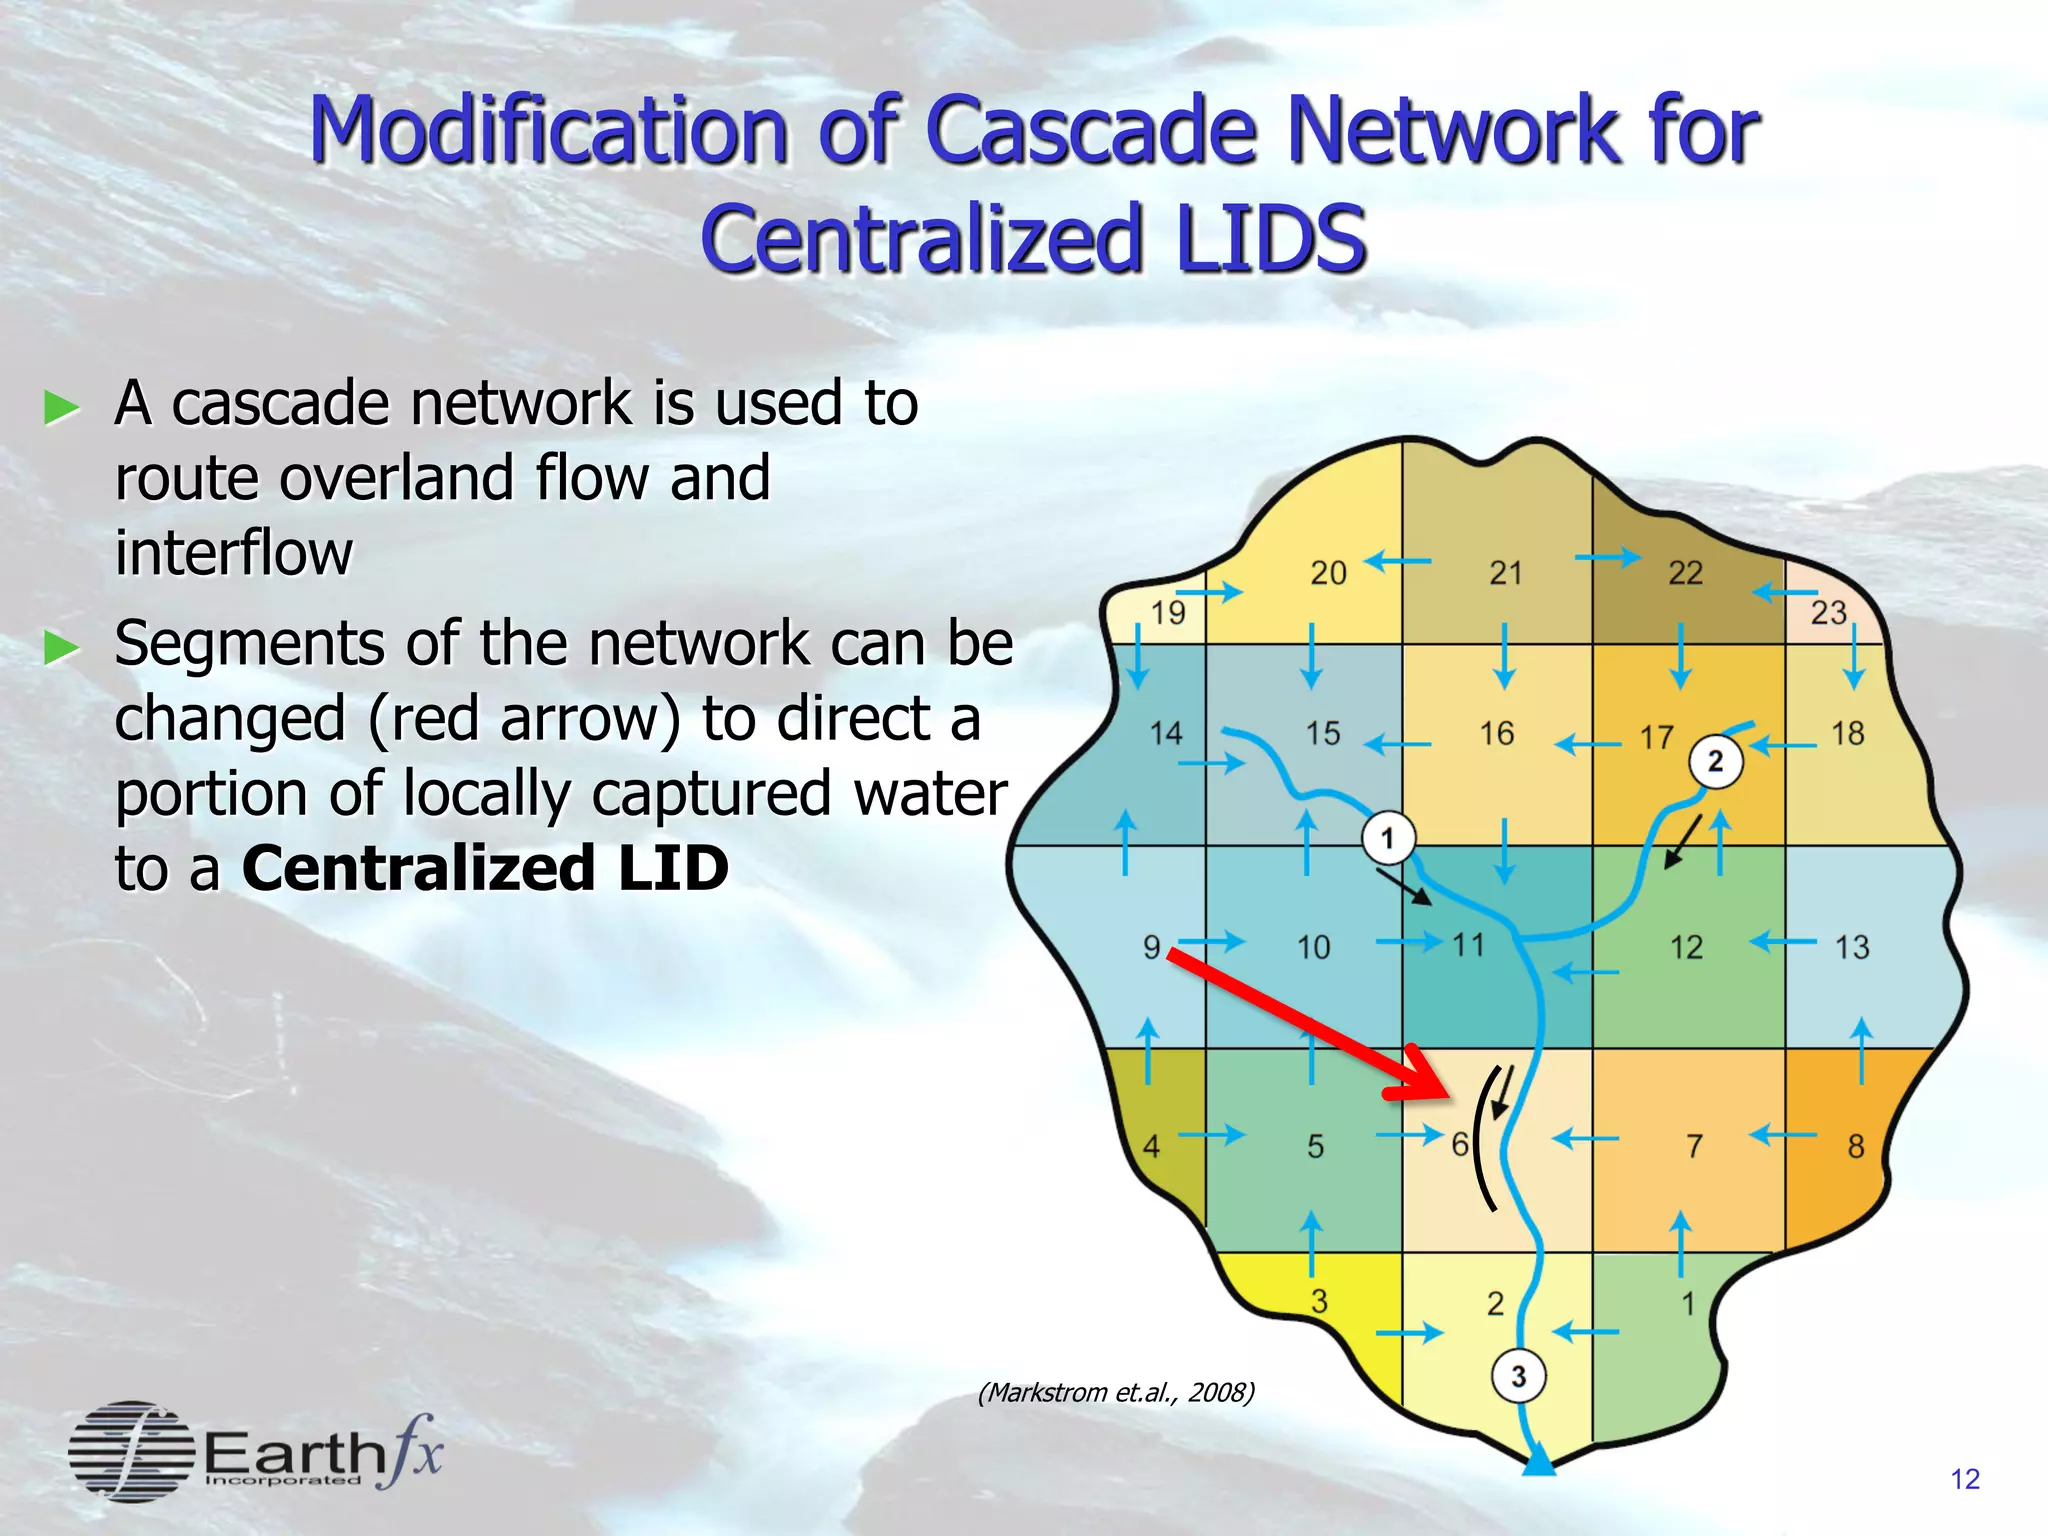
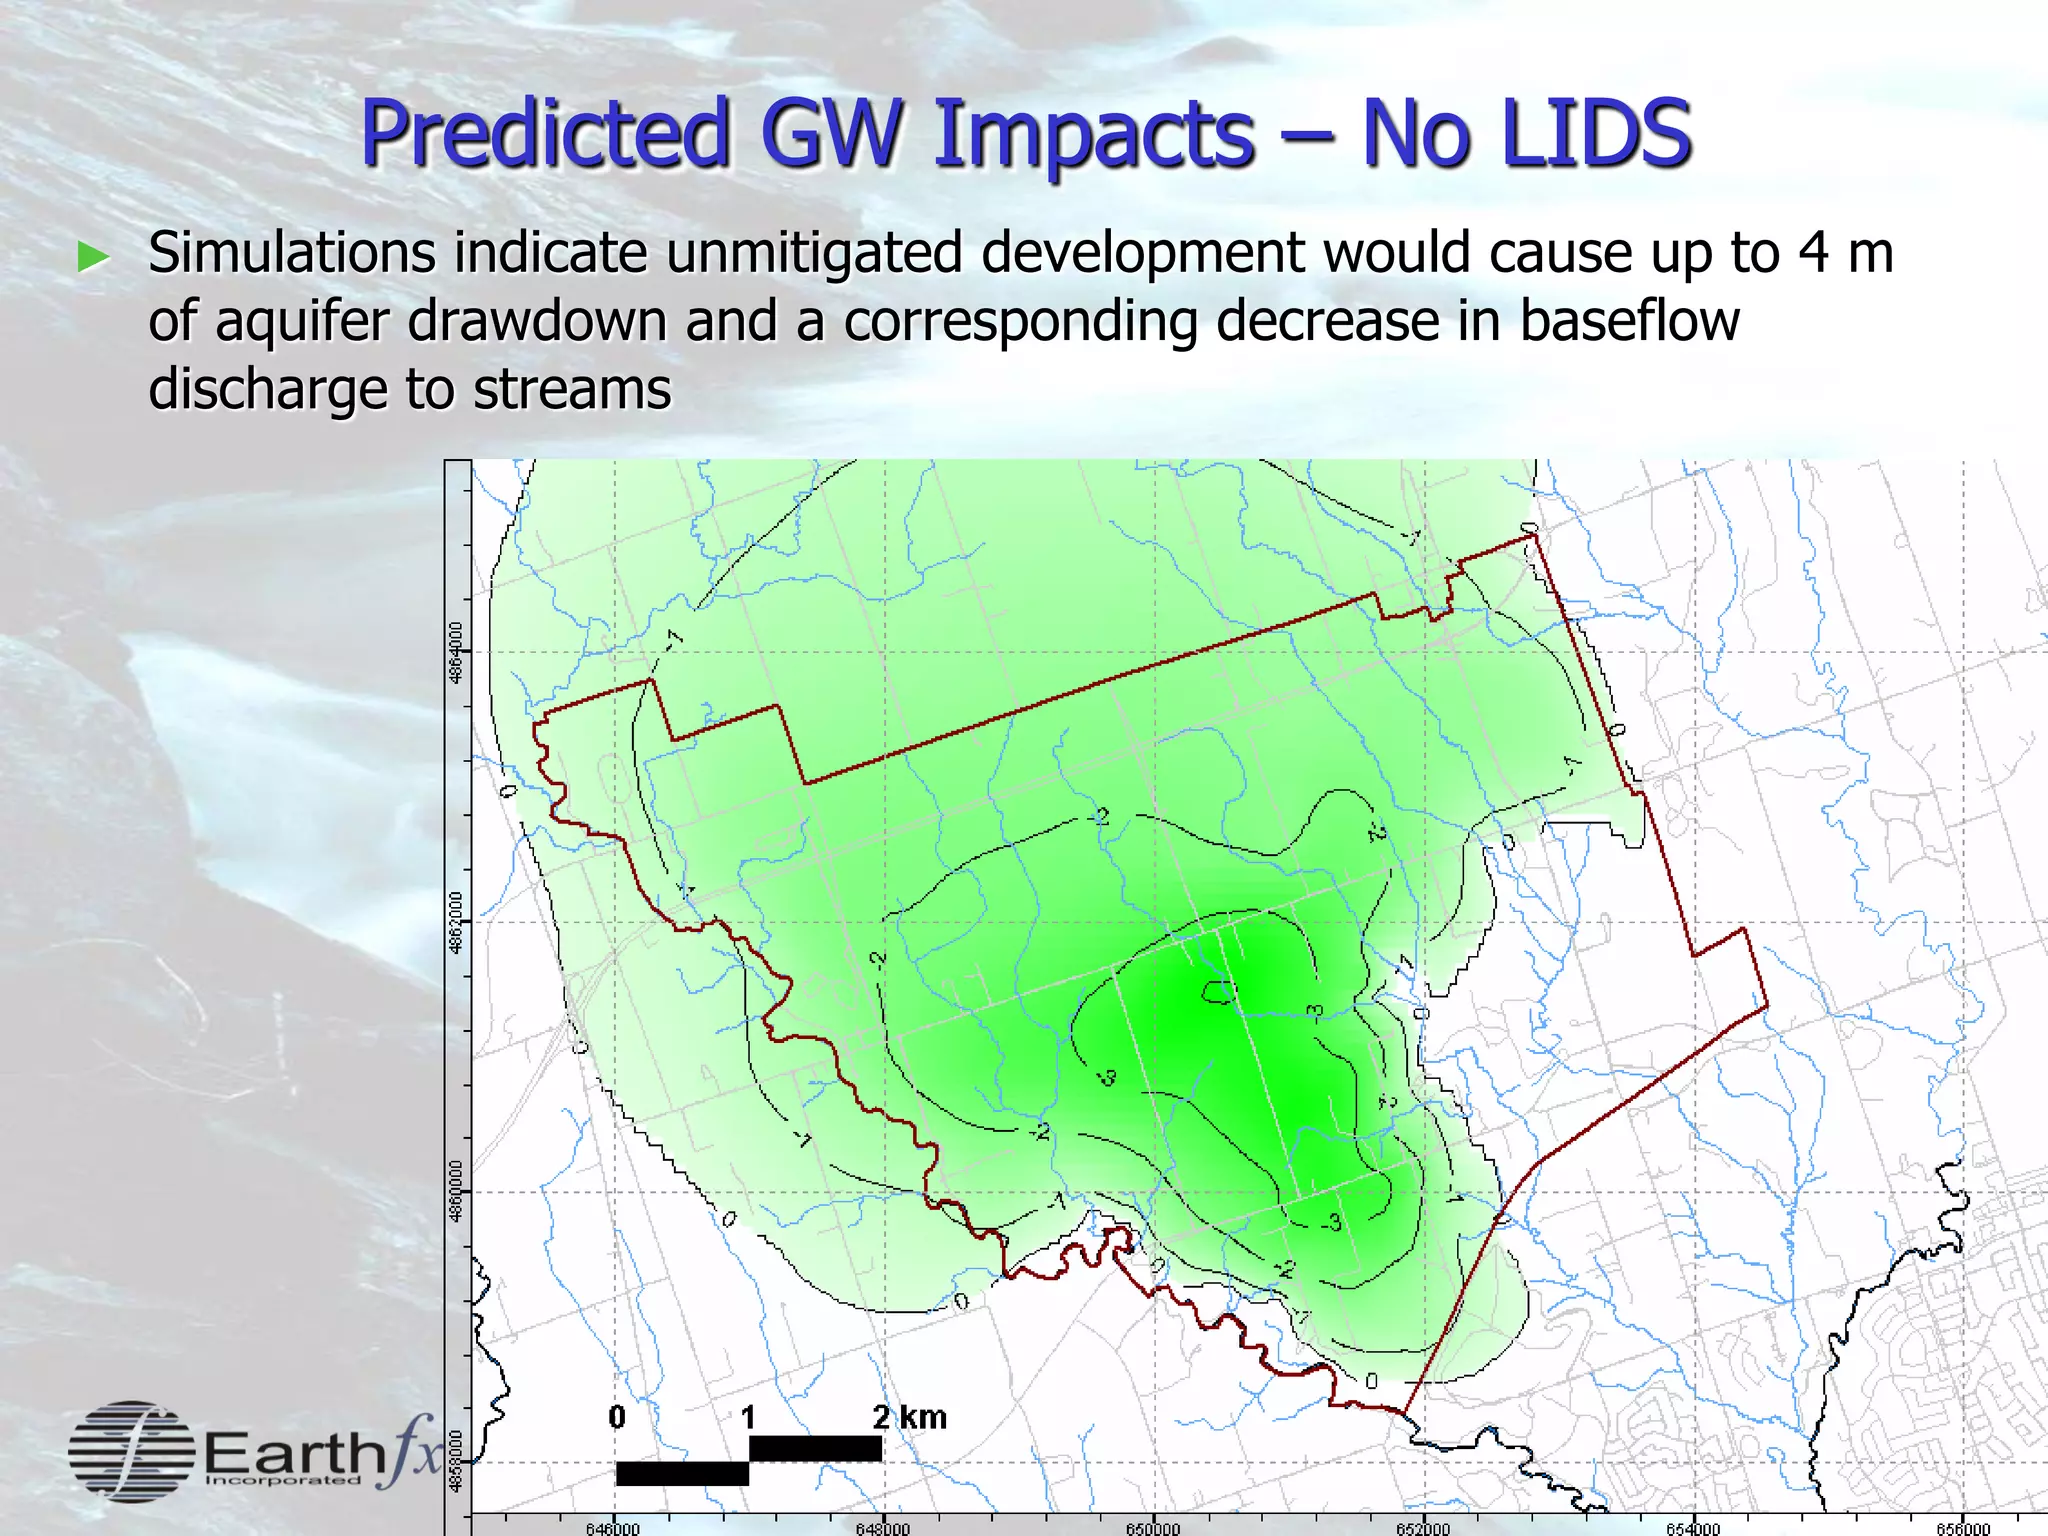
Assessment of Low Impact Design (LID)
Strategies using Integrated and Distributed
Surface Water/Groundwater Models
Presented to:
IAH Conference
October 2, 2013
Dirk Kassenaar, M.Sc. P.Eng.
M.A. Marchildon, M.Sc. P.Eng.
2
Land Development Impacts
► “They paved paradise and put up a parking
lot…” Assessing the impacts of land
development is certainly important!
► SW assessments have focused on peak flows
and, more recently, on how Low Impact
Development (LID) can mitigate storm sewer
“end of pipe” flows.
► Recent work indicates that a more holistic
approach is needed, including assessment of
the whole flow regime (not just peak flows)
and impact to GW levels and baseflow
discharge to wetlands
3
Low Impact Development (LID) Strategies
Local LID Features:
- A local LID feature captures
and attenuates storm water
- e.g. bioswales, permeable
paving, rain barrels, green
roofs, soak-away pits, etc.
A bioswale can attenuate pavement
runoff by enhancing ET and GW
infiltration
4
Assessment of Low Impact Development
► Low Impact Development strategies offer significant benefits
► Not all LID strategies will work in all locations. Need to consider:
 Soil and surficial geologic conditions (infiltration capacity)
 Depth to water table (possible rejected infiltration)
 Other factors such as terrain, slope accumulation, and pervious/impervious
configuration
► SW-only models are focussed on end of pipe sewer flows and
stormwater ponds:
 Cannot predict if hydrogeologic conditions are suitable for a specific LID design
 Cannot predict if ecologic and hydrogeologic benefits will actually be achieved.
► GW-only models cannot predict the complex change in 3D recharge
► Only an integrated GW/SW model approach can assess all aspects of a
LID implementation
 Which LID is optimal and where? Will the ecological benefits be achieved?
5
Integrated Water Systems Modelling
► Integrated GW/SW modelling involves:
 Groundwater: Flow through the subsurface
 Hydrology: Vegetation, land use and soil
zone
 Hydraulics: Flow in streams, wetlands and
lakes
► “Fully-distributed” modelling approach
 Study area is subdivided into millions of
cells
 Soil zone hydrology and groundwater
processes simulated in each unique cell
 Streamflow simulated in a linear channel
network that accepts cascading overland
runoff and pickup (or loss) from the aquifer
systems
6
USGS-GSFLOW
6
Integrated Ground-Water and Surface-Water Flow Model Based on the Integration of the
Precipitation-Runoff Modeling System (PRMS) and the Modular Ground-Water Flow Model
(MODFLOW)
7
GSFLOW Hydrology: Sub-Cell Processes
► Each upper layer model cell has both pervious and impervious areas and processes.
Impervious areas &
Depression storage
Pervious
area
Tree canopy
(interception)
Micro-topographic
depressions
Parking Lot
Rooftop
8
Conceptualization of LIDs in GSFLOW
► A Manabe (1969) Reservoir was added to each cell to represent the local LID feature
► The LID Reservoir can receive water from the impervious area and, depending on the E, Q
and D parameters, attenuate and infiltrate that water Impervious areas &
Depression storage
Pervious
area
Tree canopy
(interception)
Micro-topographic
depressions
Parking Lot
Rooftop
LID Reservoir Parameters:
E =Evaporative loss
Q=Overflow
D =Drainage
9
► Bioswales
 E>0, Q>0, D=K
► Green Roofs
 E>0, Q>0, D=0
► Retention Ponds
 E>0, Q=0, D>0
 (Smax=∞)
E =Evaporative loss
Q=Overflow
D =Drainage
► Detention Ponds
 E>0, Q>0, D>0
► Infiltration Galleries
 E=0, Q>0, D=K
► Rain Harvesters
 E=0, Q>0, D=D(t)
GSFLOW Manabe Reservoir
- One reservoir available per model cell
- Parameters adjusted to represent a
variety of LID features
(Figures from CVC & TRCA, 2010)
10
Additional LID Conceptualization:
Permeable Pavement
Simulated by decreasing the (effective) percent
imperviousness
Roof Downspout Disconnection
Simulated by routing impervious runoff to
(same-cell) pervious area
(CVC & TRCA, 2010)
(CVC & TRCA, 2010)
11
Centralized LID Features
11
Centralized LID Features are
larger scale features that receive
water from upslope impervious
sources or 3rd-pipe roof runoff
12
Modification of Cascade Network for
Centralized LIDS
► A cascade network is used to
route overland flow and
interflow
► Segments of the network can be
changed (red arrow) to direct a
portion of locally captured water
to a Centralized LID
12
(Markstrom et.al., 2008)
13
Seaton MESP LID Assessment Objectives
► Proposed new development for 70,000 residents north of Pickering,
Ontario
► Simulation Objectives:
 Evaluate overall cumulative effects of various LID configurations
► Which LID strategy (or combination) should be used, and where?
 Will the ecological function of the wetlands and ponds be preserved?
► Will buffers around the NHS lands be sufficient?
 Can the impacts on the underlying aquifers be mitigated through LIDS?
► Issues:
 Commercial-industrial land use planned for high recharge Iroquois Beach sands
 Need for quantitative comparison of alternatives
14
Seaton Lands - Hydrogeologic Conditions
► Complex hydrogeology: 3 Aquifers day-lighting along Duffins Creek
► Extensive wetland connectivity and riparian zones
A A’
A
A’
15
Seaton Existing Landuse
Agricultural
Natural Heritage
Urban
15
16
Seaton Proposed Landuse
16
Agricultural
Natural Heritage
Residential
Parks
Commercial
Institutional
17
Implemented LIDs
► Employment areas: Rooftop capture and 90% of the overflow being
redirected to bioswales
► Residential, recreational and school areas
 Roof-to-lawn routing of impervious runoff (amount dependent on roof coverage as a
proportion of modelled cell);
► Unlined (leaky) storm water management ponds
► Infiltration gallery for commercial developments on the Iroqouois
Beach
► Road side ditches along rural cross sections as opposed to serviced
roadways.
18
Existing Conditions: Generated Runoff
19
Post Development: Generated Runoff
20
Post Development with LID: Generated Runoff
21
Existing Conditions: Cascading Runoff
Click for Animation
22
Post Development: Cascading Runoff
Click for Animation
23
Existing Conditions: Actual ET
24
Post Development: Actual ET
25
Post Development with LID: Actual ET
Bioswales
26
Existing Conditions: GW Recharge
Iroquois Beach Sands
27
Post Development: GW Recharge
Iroquois Beach Sands
28
Post Development with LID: GW Recharge
Iroquois Beach Sands
29
Predicted GW Impacts – No LIDS
► Simulations indicate unmitigated development would cause up to 4 m
of aquifer drawdown and a corresponding decrease in baseflow
discharge to streams
30
Predicted GW Impacts – With LIDS
► Simulations indicate LIDS would sustain groundwater recharge and
mitigate effects on aquifer levels and stream baseflow
31
Seaton LIDS Analysis: Conclusions
► Integrated modelling identified the unique and site specific recharge
functions in the Seaton Lands MESP area
► Detailed cell-based simulations were able to represent site specific LID
implement issues and benefits
► Modelling provided a framework for comparison of LID scenarios, and
facilitated discussions with the Municipality and TRCA

Assessment of Low Impact Design (LID)

  • 1.
    Assessment of LowImpact Design (LID) Strategies using Integrated and Distributed Surface Water/Groundwater Models Presented to: IAH Conference October 2, 2013 Dirk Kassenaar, M.Sc. P.Eng. M.A. Marchildon, M.Sc. P.Eng.
  • 2.
    2 Land Development Impacts ►“They paved paradise and put up a parking lot…” Assessing the impacts of land development is certainly important! ► SW assessments have focused on peak flows and, more recently, on how Low Impact Development (LID) can mitigate storm sewer “end of pipe” flows. ► Recent work indicates that a more holistic approach is needed, including assessment of the whole flow regime (not just peak flows) and impact to GW levels and baseflow discharge to wetlands
  • 3.
    3 Low Impact Development(LID) Strategies Local LID Features: - A local LID feature captures and attenuates storm water - e.g. bioswales, permeable paving, rain barrels, green roofs, soak-away pits, etc. A bioswale can attenuate pavement runoff by enhancing ET and GW infiltration
  • 4.
    4 Assessment of LowImpact Development ► Low Impact Development strategies offer significant benefits ► Not all LID strategies will work in all locations. Need to consider:  Soil and surficial geologic conditions (infiltration capacity)  Depth to water table (possible rejected infiltration)  Other factors such as terrain, slope accumulation, and pervious/impervious configuration ► SW-only models are focussed on end of pipe sewer flows and stormwater ponds:  Cannot predict if hydrogeologic conditions are suitable for a specific LID design  Cannot predict if ecologic and hydrogeologic benefits will actually be achieved. ► GW-only models cannot predict the complex change in 3D recharge ► Only an integrated GW/SW model approach can assess all aspects of a LID implementation  Which LID is optimal and where? Will the ecological benefits be achieved?
  • 5.
    5 Integrated Water SystemsModelling ► Integrated GW/SW modelling involves:  Groundwater: Flow through the subsurface  Hydrology: Vegetation, land use and soil zone  Hydraulics: Flow in streams, wetlands and lakes ► “Fully-distributed” modelling approach  Study area is subdivided into millions of cells  Soil zone hydrology and groundwater processes simulated in each unique cell  Streamflow simulated in a linear channel network that accepts cascading overland runoff and pickup (or loss) from the aquifer systems
  • 6.
    6 USGS-GSFLOW 6 Integrated Ground-Water andSurface-Water Flow Model Based on the Integration of the Precipitation-Runoff Modeling System (PRMS) and the Modular Ground-Water Flow Model (MODFLOW)
  • 7.
    7 GSFLOW Hydrology: Sub-CellProcesses ► Each upper layer model cell has both pervious and impervious areas and processes. Impervious areas & Depression storage Pervious area Tree canopy (interception) Micro-topographic depressions Parking Lot Rooftop
  • 8.
    8 Conceptualization of LIDsin GSFLOW ► A Manabe (1969) Reservoir was added to each cell to represent the local LID feature ► The LID Reservoir can receive water from the impervious area and, depending on the E, Q and D parameters, attenuate and infiltrate that water Impervious areas & Depression storage Pervious area Tree canopy (interception) Micro-topographic depressions Parking Lot Rooftop LID Reservoir Parameters: E =Evaporative loss Q=Overflow D =Drainage
  • 9.
    9 ► Bioswales  E>0,Q>0, D=K ► Green Roofs  E>0, Q>0, D=0 ► Retention Ponds  E>0, Q=0, D>0  (Smax=∞) E =Evaporative loss Q=Overflow D =Drainage ► Detention Ponds  E>0, Q>0, D>0 ► Infiltration Galleries  E=0, Q>0, D=K ► Rain Harvesters  E=0, Q>0, D=D(t) GSFLOW Manabe Reservoir - One reservoir available per model cell - Parameters adjusted to represent a variety of LID features (Figures from CVC & TRCA, 2010)
  • 10.
    10 Additional LID Conceptualization: PermeablePavement Simulated by decreasing the (effective) percent imperviousness Roof Downspout Disconnection Simulated by routing impervious runoff to (same-cell) pervious area (CVC & TRCA, 2010) (CVC & TRCA, 2010)
  • 11.
    11 Centralized LID Features 11 CentralizedLID Features are larger scale features that receive water from upslope impervious sources or 3rd-pipe roof runoff
  • 12.
    12 Modification of CascadeNetwork for Centralized LIDS ► A cascade network is used to route overland flow and interflow ► Segments of the network can be changed (red arrow) to direct a portion of locally captured water to a Centralized LID 12 (Markstrom et.al., 2008)
  • 13.
    13 Seaton MESP LIDAssessment Objectives ► Proposed new development for 70,000 residents north of Pickering, Ontario ► Simulation Objectives:  Evaluate overall cumulative effects of various LID configurations ► Which LID strategy (or combination) should be used, and where?  Will the ecological function of the wetlands and ponds be preserved? ► Will buffers around the NHS lands be sufficient?  Can the impacts on the underlying aquifers be mitigated through LIDS? ► Issues:  Commercial-industrial land use planned for high recharge Iroquois Beach sands  Need for quantitative comparison of alternatives
  • 14.
    14 Seaton Lands -Hydrogeologic Conditions ► Complex hydrogeology: 3 Aquifers day-lighting along Duffins Creek ► Extensive wetland connectivity and riparian zones A A’ A A’
  • 15.
  • 16.
    16 Seaton Proposed Landuse 16 Agricultural NaturalHeritage Residential Parks Commercial Institutional
  • 17.
    17 Implemented LIDs ► Employmentareas: Rooftop capture and 90% of the overflow being redirected to bioswales ► Residential, recreational and school areas  Roof-to-lawn routing of impervious runoff (amount dependent on roof coverage as a proportion of modelled cell); ► Unlined (leaky) storm water management ponds ► Infiltration gallery for commercial developments on the Iroqouois Beach ► Road side ditches along rural cross sections as opposed to serviced roadways.
  • 18.
  • 19.
  • 20.
    20 Post Development withLID: Generated Runoff
  • 21.
    21 Existing Conditions: CascadingRunoff Click for Animation
  • 22.
    22 Post Development: CascadingRunoff Click for Animation
  • 23.
  • 24.
  • 25.
    25 Post Development withLID: Actual ET Bioswales
  • 26.
    26 Existing Conditions: GWRecharge Iroquois Beach Sands
  • 27.
    27 Post Development: GWRecharge Iroquois Beach Sands
  • 28.
    28 Post Development withLID: GW Recharge Iroquois Beach Sands
  • 29.
    29 Predicted GW Impacts– No LIDS ► Simulations indicate unmitigated development would cause up to 4 m of aquifer drawdown and a corresponding decrease in baseflow discharge to streams
  • 30.
    30 Predicted GW Impacts– With LIDS ► Simulations indicate LIDS would sustain groundwater recharge and mitigate effects on aquifer levels and stream baseflow
  • 31.
    31 Seaton LIDS Analysis:Conclusions ► Integrated modelling identified the unique and site specific recharge functions in the Seaton Lands MESP area ► Detailed cell-based simulations were able to represent site specific LID implement issues and benefits ► Modelling provided a framework for comparison of LID scenarios, and facilitated discussions with the Municipality and TRCA