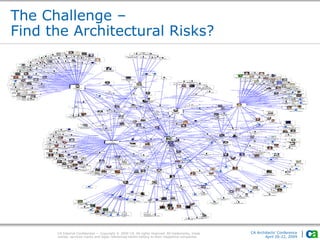
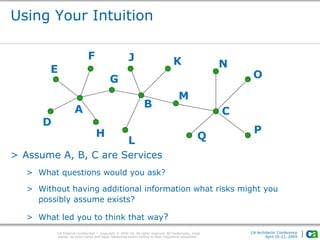
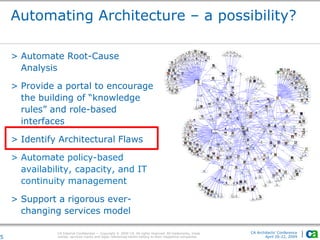
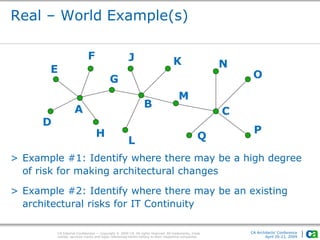
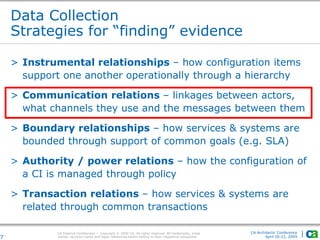
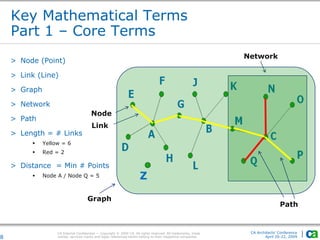
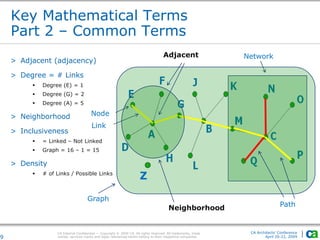
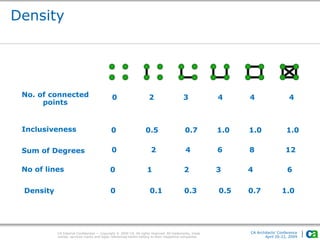
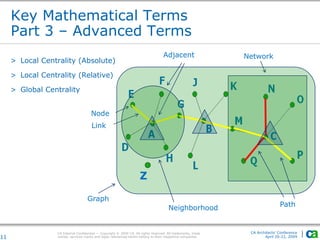
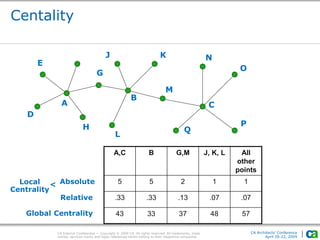
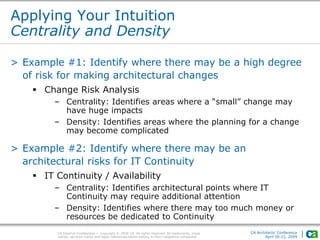
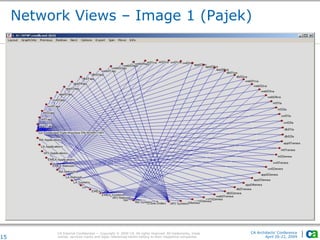
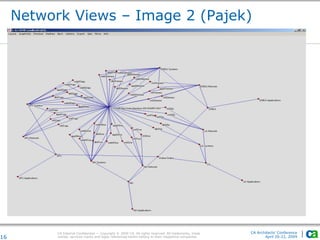
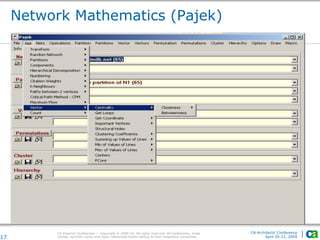
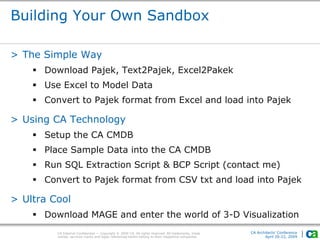
CA Council for
Technical Excellence
Information
Mining and the
CMDB
CA Architects’
Conference
Presented By:
David A Messineo
CA Internal Confidential — Copyright © 2009 CA. All rights reserved. All trademarks, trade
names, services marks and logos referenced herein belong to their respective companies.
CA Architects’ Conference
April 20-22, 2009
The Challenge –
Find the Architectural Risks?
CA Internal Confidential — Copyright © 2009 CA. All rights reserved. All trademarks, trade
names, services marks and logos referenced herein belong to their respective companies.
CA Architects’ Conference
April 20-22, 2009
Using Your Intuition
E
F
D
A
H
G
J
B
K
L
M
C
Q
P
O
N
> Assume A, B, C are Services
> What questions would you ask?
> Without having additional information what risks might you
possibly assume exists?
> What led you to think that way?
CA Internal Confidential — Copyright © 2009 CA. All rights reserved. All trademarks, trade
names, services marks and logos referenced herein belong to their respective companies.
CA Architects’ Conference
April 20-22, 20094
What would Charlie do?
> Mathematics has an inner beauty but
only satisfies its true capabilities
when driven by interpretation by
novices and experts alike
> NUMB3RS – It’s not just a bunch of
actors acting like geniuses to
entertain you – it’s actually a true
model for how math is functional
> Using Math is all about identifying the
germ of an idea, making reasonable
assumptions, building a model, and
applying it to real life
> The CMDB is one such example using
the concept of “Network Algebra” (i.e
Graph Theory)
CA Internal Confidential — Copyright © 2009 CA. All rights reserved. All trademarks, trade
names, services marks and logos referenced herein belong to their respective companies.
CA Architects’ Conference
April 20-22, 20095
Automating Architecture – a possibility?
> Automate Root-Cause
Analysis
> Provide a portal to encourage
the building of “knowledge
rules” and role-based
interfaces
> Identify Architectural Flaws
> Automate policy-based
availability, capacity, and IT
continuity management
> Support a rigorous ever-
changing services model
CA Internal Confidential — Copyright © 2009 CA. All rights reserved. All trademarks, trade
names, services marks and logos referenced herein belong to their respective companies.
CA Architects’ Conference
April 20-22, 2009
Real – World Example(s)
E
F
D
A
H
G
J
B
K
L
M
C
Q
P
O
N
> Example #1: Identify where there may be a high degree
of risk for making architectural changes
> Example #2: Identify where there may be an existing
architectural risks for IT Continuity
CA Internal Confidential — Copyright © 2009 CA. All rights reserved. All trademarks, trade
names, services marks and logos referenced herein belong to their respective companies.
CA Architects’ Conference
April 20-22, 20097
Data Collection
Strategies for “finding” evidence
> Instrumental relationships – how configuration items
support one another operationally through a hierarchy
> Communication relations – linkages between actors,
what channels they use and the messages between them
> Boundary relationships – how services & systems are
bounded through support of common goals (e.g. SLA)
> Authority / power relations – how the configuration of
a CI is managed through policy
> Transaction relations – how services & systems are
related through common transactions
CA Internal Confidential — Copyright © 2009 CA. All rights reserved. All trademarks, trade
names, services marks and logos referenced herein belong to their respective companies.
CA Architects’ Conference
April 20-22, 20098
Key Mathematical Terms
Part 1 – Core Terms
> Node (Point)
> Link (Line)
> Graph
> Network
> Path
> Length = # Links
ď‚§ Yellow = 6
ď‚§ Red = 2
> Distance = Min # Points
ď‚§ Node A / Node Q = 5
Node
Link
Network
Graph
Path
Z
CA Internal Confidential — Copyright © 2009 CA. All rights reserved. All trademarks, trade
names, services marks and logos referenced herein belong to their respective companies.
CA Architects’ Conference
April 20-22, 20099
Key Mathematical Terms
Part 2 – Common Terms
> Adjacent (adjacency)
> Degree = # Links
ď‚§ Degree (E) = 1
ď‚§ Degree (G) = 2
ď‚§ Degree (A) = 5
> Neighborhood
> Inclusiveness
 = Linked – Not Linked
 Graph = 16 – 1 = 15
> Density
ď‚§ # of Links / Possible Links
Node
Link
Network
Graph
Path
Adjacent
Z
Neighborhood
CA Internal Confidential — Copyright © 2009 CA. All rights reserved. All trademarks, trade
names, services marks and logos referenced herein belong to their respective companies.
CA Architects’ Conference
April 20-22, 2009
Density
No. of connected
points
0 2 3 4 4 4
Inclusiveness 0 0.5 0.7 1.0 1.0 1.0
Sum of Degrees 0 2 4 6 8 12
No of lines 0 1 2 3 4 6
Density 0 0.1 0.3 0.5 0.7 1.0
CA Internal Confidential — Copyright © 2009 CA. All rights reserved. All trademarks, trade
names, services marks and logos referenced herein belong to their respective companies.
CA Architects’ Conference
April 20-22, 200911
Key Mathematical Terms
Part 3 – Advanced Terms
> Local Centrality (Absolute)
> Local Centrality (Relative)
> Global Centrality
Node
Link
Network
Graph
Path
Adjacent
Z
Neighborhood
CA Internal Confidential — Copyright © 2009 CA. All rights reserved. All trademarks, trade
names, services marks and logos referenced herein belong to their respective companies.
CA Architects’ Conference
April 20-22, 2009
Centality
E
F
D
A
H
G
J
B
K
L
M
C
Q
P
O
N
A,C B G,M J, K, L All
other
points
5 5 2 1 1
.33 .33 .13 .07 .07
43 33 37 48 57Global Centrality
Local
Centrality
Absolute
Relative
<
J
CA Internal Confidential — Copyright © 2009 CA. All rights reserved. All trademarks, trade
names, services marks and logos referenced herein belong to their respective companies.
CA Architects’ Conference
April 20-22, 2009
Applying Your Intuition
Centrality and Density
> Example #1: Identify where there may be a high degree
of risk for making architectural changes
ď‚§ Change Risk Analysis
– Centrality: Identifies areas where a “small” change may
have huge impacts
– Density: Identifies areas where the planning for a change
may become complicated
> Example #2: Identify where there may be an
architectural risks for IT Continuity
ď‚§ IT Continuity / Availability
– Centrality: Identifies architectural points where IT
Continuity may require additional attention
– Density: Identifies where there may too much money or
resources be dedicated to Continuity
Software Tools
CA Internal Confidential — Copyright © 2009 CA. All rights reserved. All trademarks, trade
names, services marks and logos referenced herein belong to their respective companies.
CA Architects’ Conference
April 20-22, 2009
Network Views – Image 1 (Pajek)
15
CA Internal Confidential — Copyright © 2009 CA. All rights reserved. All trademarks, trade
names, services marks and logos referenced herein belong to their respective companies.
CA Architects’ Conference
April 20-22, 2009
Network Views – Image 2 (Pajek)
16
CA Internal Confidential — Copyright © 2009 CA. All rights reserved. All trademarks, trade
names, services marks and logos referenced herein belong to their respective companies.
CA Architects’ Conference
April 20-22, 2009
Network Mathematics (Pajek)
17
CA Internal Confidential — Copyright © 2009 CA. All rights reserved. All trademarks, trade
names, services marks and logos referenced herein belong to their respective companies.
CA Architects’ Conference
April 20-22, 2009
Building Your Own Sandbox
> The Simple Way
ď‚§ Download Pajek, Text2Pajek, Excel2Pakek
ď‚§ Use Excel to Model Data
ď‚§ Convert to Pajek format from Excel and load into Pajek
> Using CA Technology
ď‚§ Setup the CA CMDB
ď‚§ Place Sample Data into the CA CMDB
ď‚§ Run SQL Extraction Script & BCP Script (contact me)
ď‚§ Convert to Pajek format from CSV txt and load into Pajek
> Ultra Cool
ď‚§ Download MAGE and enter the world of 3-D Visualization

Information Mining and the CMDB

  • 1.
    CA Council for TechnicalExcellence Information Mining and the CMDB CA Architects’ Conference Presented By: David A Messineo
  • 2.
    CA Internal Confidential— Copyright © 2009 CA. All rights reserved. All trademarks, trade names, services marks and logos referenced herein belong to their respective companies. CA Architects’ Conference April 20-22, 2009 The Challenge – Find the Architectural Risks?
  • 3.
    CA Internal Confidential— Copyright © 2009 CA. All rights reserved. All trademarks, trade names, services marks and logos referenced herein belong to their respective companies. CA Architects’ Conference April 20-22, 2009 Using Your Intuition E F D A H G J B K L M C Q P O N > Assume A, B, C are Services > What questions would you ask? > Without having additional information what risks might you possibly assume exists? > What led you to think that way?
  • 4.
    CA Internal Confidential— Copyright © 2009 CA. All rights reserved. All trademarks, trade names, services marks and logos referenced herein belong to their respective companies. CA Architects’ Conference April 20-22, 20094 What would Charlie do? > Mathematics has an inner beauty but only satisfies its true capabilities when driven by interpretation by novices and experts alike > NUMB3RS – It’s not just a bunch of actors acting like geniuses to entertain you – it’s actually a true model for how math is functional > Using Math is all about identifying the germ of an idea, making reasonable assumptions, building a model, and applying it to real life > The CMDB is one such example using the concept of “Network Algebra” (i.e Graph Theory)
  • 5.
    CA Internal Confidential— Copyright © 2009 CA. All rights reserved. All trademarks, trade names, services marks and logos referenced herein belong to their respective companies. CA Architects’ Conference April 20-22, 20095 Automating Architecture – a possibility? > Automate Root-Cause Analysis > Provide a portal to encourage the building of “knowledge rules” and role-based interfaces > Identify Architectural Flaws > Automate policy-based availability, capacity, and IT continuity management > Support a rigorous ever- changing services model
  • 6.
    CA Internal Confidential— Copyright © 2009 CA. All rights reserved. All trademarks, trade names, services marks and logos referenced herein belong to their respective companies. CA Architects’ Conference April 20-22, 2009 Real – World Example(s) E F D A H G J B K L M C Q P O N > Example #1: Identify where there may be a high degree of risk for making architectural changes > Example #2: Identify where there may be an existing architectural risks for IT Continuity
  • 7.
    CA Internal Confidential— Copyright © 2009 CA. All rights reserved. All trademarks, trade names, services marks and logos referenced herein belong to their respective companies. CA Architects’ Conference April 20-22, 20097 Data Collection Strategies for “finding” evidence > Instrumental relationships – how configuration items support one another operationally through a hierarchy > Communication relations – linkages between actors, what channels they use and the messages between them > Boundary relationships – how services & systems are bounded through support of common goals (e.g. SLA) > Authority / power relations – how the configuration of a CI is managed through policy > Transaction relations – how services & systems are related through common transactions
  • 8.
    CA Internal Confidential— Copyright © 2009 CA. All rights reserved. All trademarks, trade names, services marks and logos referenced herein belong to their respective companies. CA Architects’ Conference April 20-22, 20098 Key Mathematical Terms Part 1 – Core Terms > Node (Point) > Link (Line) > Graph > Network > Path > Length = # Links  Yellow = 6  Red = 2 > Distance = Min # Points  Node A / Node Q = 5 Node Link Network Graph Path Z
  • 9.
    CA Internal Confidential— Copyright © 2009 CA. All rights reserved. All trademarks, trade names, services marks and logos referenced herein belong to their respective companies. CA Architects’ Conference April 20-22, 20099 Key Mathematical Terms Part 2 – Common Terms > Adjacent (adjacency) > Degree = # Links  Degree (E) = 1  Degree (G) = 2  Degree (A) = 5 > Neighborhood > Inclusiveness  = Linked – Not Linked  Graph = 16 – 1 = 15 > Density  # of Links / Possible Links Node Link Network Graph Path Adjacent Z Neighborhood
  • 10.
    CA Internal Confidential— Copyright © 2009 CA. All rights reserved. All trademarks, trade names, services marks and logos referenced herein belong to their respective companies. CA Architects’ Conference April 20-22, 2009 Density No. of connected points 0 2 3 4 4 4 Inclusiveness 0 0.5 0.7 1.0 1.0 1.0 Sum of Degrees 0 2 4 6 8 12 No of lines 0 1 2 3 4 6 Density 0 0.1 0.3 0.5 0.7 1.0
  • 11.
    CA Internal Confidential— Copyright © 2009 CA. All rights reserved. All trademarks, trade names, services marks and logos referenced herein belong to their respective companies. CA Architects’ Conference April 20-22, 200911 Key Mathematical Terms Part 3 – Advanced Terms > Local Centrality (Absolute) > Local Centrality (Relative) > Global Centrality Node Link Network Graph Path Adjacent Z Neighborhood
  • 12.
    CA Internal Confidential— Copyright © 2009 CA. All rights reserved. All trademarks, trade names, services marks and logos referenced herein belong to their respective companies. CA Architects’ Conference April 20-22, 2009 Centality E F D A H G J B K L M C Q P O N A,C B G,M J, K, L All other points 5 5 2 1 1 .33 .33 .13 .07 .07 43 33 37 48 57Global Centrality Local Centrality Absolute Relative < J
  • 13.
    CA Internal Confidential— Copyright © 2009 CA. All rights reserved. All trademarks, trade names, services marks and logos referenced herein belong to their respective companies. CA Architects’ Conference April 20-22, 2009 Applying Your Intuition Centrality and Density > Example #1: Identify where there may be a high degree of risk for making architectural changes  Change Risk Analysis – Centrality: Identifies areas where a “small” change may have huge impacts – Density: Identifies areas where the planning for a change may become complicated > Example #2: Identify where there may be an architectural risks for IT Continuity  IT Continuity / Availability – Centrality: Identifies architectural points where IT Continuity may require additional attention – Density: Identifies where there may too much money or resources be dedicated to Continuity
  • 14.
  • 15.
    CA Internal Confidential— Copyright © 2009 CA. All rights reserved. All trademarks, trade names, services marks and logos referenced herein belong to their respective companies. CA Architects’ Conference April 20-22, 2009 Network Views – Image 1 (Pajek) 15
  • 16.
    CA Internal Confidential— Copyright © 2009 CA. All rights reserved. All trademarks, trade names, services marks and logos referenced herein belong to their respective companies. CA Architects’ Conference April 20-22, 2009 Network Views – Image 2 (Pajek) 16
  • 17.
    CA Internal Confidential— Copyright © 2009 CA. All rights reserved. All trademarks, trade names, services marks and logos referenced herein belong to their respective companies. CA Architects’ Conference April 20-22, 2009 Network Mathematics (Pajek) 17
  • 18.
    CA Internal Confidential— Copyright © 2009 CA. All rights reserved. All trademarks, trade names, services marks and logos referenced herein belong to their respective companies. CA Architects’ Conference April 20-22, 2009 Building Your Own Sandbox > The Simple Way  Download Pajek, Text2Pajek, Excel2Pakek  Use Excel to Model Data  Convert to Pajek format from Excel and load into Pajek > Using CA Technology  Setup the CA CMDB  Place Sample Data into the CA CMDB  Run SQL Extraction Script & BCP Script (contact me)  Convert to Pajek format from CSV txt and load into Pajek > Ultra Cool  Download MAGE and enter the world of 3-D Visualization