Information Design Tool -Tutorial5
•
2 likes•7,875 views
SAP Business Objects 4.0 (SP02) Information Design Tool (Universe Designer) Creating Queries (SQL Traps (CHASM and FAN trap))
Report
Share
Report
Share
Download to read offline

Recommended
Information Design Tool -Tutorial4
SAP Business Objects 4.0 (SP02)
Information Design Tool (Universe Designer)
Creating Queries (Delegated measures, Loops (Alias and Contexts), Filters)
Information Design Tool -Tutorial1
SAP Business Objects 4.0 (SP02)
Information Design Tool (Universe Designer)
How to create a project and connect to a database?
Information Design Tool -Tutorial3
SAP Business Objects 4.0 (SP02)
Information Design Tool (Universe Designer)
Creating Business Layer
Creating Folders/Classes and Objects in BLX layer
Creating Queries to Test
Information Design Tool -Tutorial 6
SAP Business Objects 4.0 (SP02)
Information Design Tool (Universe Designer)
List of Values and Publishing Universe to repository
Information Design Tool -Tutorial2
SAP Business Objects 4.0 (SP02)
Information Design Tool (Universe Designer)
How to create a Data Foundation Layer?
Web Intelligence - Tutorial7
SAP Business Objects 4.0 (SP02)
Beginners guide to Web Intelligence
Analyzing Data and Managing Reports
Web Intelligence - Tutorial1
SAP Business Objects 4.0 (SP02)
Beginners guide to Web Intelligence
Introduction to WEBi. Creating Documents and Queries
Web Intelligence - Tutorial2
This document provides an introduction to Web Intelligence, an SAP Business Objects tool for creating reports from data. It outlines the basics of Web Intelligence, including documents and queries, data restrictions using query filters, report creation and enhancement, formulas and variables, synchronizing multiple data sources, and data analysis and report management. Query filters allow restricting the data obtained from a query based on business requirements and can be predefined, single or multi-value, prompted, or complex using multiple filters joined with logical conditions.
Web Intelligence - Tutorial6
SAP Business Objects 4.0 (SP02)
Beginners guide to Web Intelligence
Synchronizing Data from multiple sources
Web Intelligence - Tutorial3
The document provides a beginner's guide to Web Intelligence, which is a tool for designing reports from business data. It discusses topics like documents and queries, data restrictions, creating reports, enhancing reports, formulas and variables, synchronizing multiple data sources, and analyzing data. The document also describes how to design Web Intelligence reports by adding different types of tables, charts, and other elements to organize and visualize information from a data source. Reports can be saved inside documents and modified later on.
Web Intelligence - Tutorial5
This document provides an overview of Web Intelligence, an SAP Business Objects tool for analyzing and reporting on data. It discusses topics like documents and queries, data restrictions, creating reports, enhancing reports, formulas and variables, synchronizing multiple data sources, and analyzing and managing reports. The document also provides examples of using formulas and variables in reports as well as conditionally hiding columns using dynamic visibility.
SAP BO Web Intelligence Basics
The document provides an overview of SAP Webi (Web Intelligence) reporting tools. It describes the history and architecture of Webi, how to create reports using various data sources, and how to use features like filters, formulas, and sending reports to other users. The document also discusses related tools like the Business Explorer (BEx) for strategic analysis and query functions.
Sap BusinessObjects 4
The document discusses new features in SAP BusinessObjects 4.0, with a focus on the Information Design Tool. Key points include:
- The Information Design Tool (IDT) is the new semantic layer for SAP BusinessObjects and replaces the Universe Designer. It allows for multi-source universes that can connect to multiple data sources.
- New features of the IDT include the ability to create derived tables directly from the interface, replace tables easily, and merge multiple tables. Dimensional and OLAP support is also improved.
- SAP BusinessObjects 4.0 offers improvements like 64-bit architecture, increased performance, new applications like the Upgrade Management Tool, and changes to the deployment
SAP BusinessObjects Web Intelligence Report
Watch Here SAP BusinessObjects Web Intelligence Report
and with Video tutorial ,Learn SAP BusinessObjects Web Intelligence Report and how to use.
SAP BW - Info cube
An info cube is a data storage area that maintains summarized and aggregated data in a star schema structure. It consists of one fact table containing key figures and dimensions tables. There are 11 steps to create a standard info cube which stores data physically in the cube: 1) Create a data source, 2) Create an info package to load data, 3) Create the info cube, 4) Assign info objects to dimensions, 5) Create a transformation, 6) Create the data transfer process, 7) Execute to load data, 8) Check loaded data. Standard info cubes allow only read access while virtual cubes access live data and real-time cubes allow read/write.
SAP BusinessObject's Webi Rich Client
SAP BusinessObjects Web Intelligence Rich Client is a full-client reporting tool offered with Business Objects XI R3. This reporting tool is very similar to the Webi Java version that most end users are used to seeing in XI R2; however it offers a very important functionality of being able to work on reports offline without being connected to a CMS. It also provides equivalent report creation, editing, formatting, printing, and saving functionality that is found in Business Object’s original full-client reporting tool, Desktop Intelligence.
Sap business objects BI4.0 reporting presentation
The document discusses SAP Business Objects reporting tools. It provides an overview of ERP Technicals Inc. and their expertise in SAP Business Objects components like data warehousing, rapid marts, data cleansing, product migration, reporting, dashboards, proofs of concept, and training. The agenda outlines topics on SAP Business Objects architecture, universes, Web Intelligence, Crystal Xcelsius dashboards, and a demonstration.
Power Bi Basics
Power BI is a self-service business intelligence tool that allows users to analyze and visualize data. It consists of Power BI Desktop, the Power BI web service, and the Power BI mobile app. Power BI Desktop is used to build reports and dashboards locally, while the web service allows users to publish, share, and collaborate on reports and dashboards online. To create a dashboard in Power BI, a user would connect to a data source, build visualizations with the data, publish the report to the web, combine reports into a dashboard, and then share the dashboard.
Business Intelligence in Excel 2013
The new release of Excel enables business users to do self-service Business Intelligence directly in the client, which now becomes a complete and powerful self-service BI tool - Basically users have all they need in one familiar environment in order to do data modeling, exploration and visualization of the data. New capabilities and features delivered for end users in Excel 2013; - ability to analyze data ranging from a few rows to hundred of millions of rows with extreme analytical performance - opportunity to speed up analysis in Excel by easily cleaning up and shaping your data with Flash Fill and Quick Explore - mash-up and analyze data from virtually any source quickly and create compelling analytical apps with PowerPivot - provide stunning data visualization to discover new insights with interactive and familiar data exploration, visualization and presentation experience with Power View
Power bi
What is the Power BI and learn the Power BI by self and this presentation contains some use full links which help us at time of developing the Power BI.
Al kannan obiee implementation with ebs
The document provides an overview of implementing Oracle Business Intelligence Enterprise Edition (OBIEE) using an Oracle E-Business data source. It outlines the objectives to introduce OBIEE, demonstrate installation basics, repository creation, and sample reports. It describes OBIEE architecture with clients, presentation services, server, and data sources. It also covers installation options, the report development process, creating simple and star schema reports, and next steps.
Unit 2 b_ex_query_designer
BEx Query Designer allows users to define queries on data in SAP Business Warehouse (BW) by selecting characteristics and key figures from InfoProviders. Queries can be parameterized and data selection can be restricted by characteristic values, intervals, and hierarchy nodes. Once defined, queries can be saved and executed in BEx Analyzer or on the web. The tool provides functionality to open, modify, find, and filter existing queries defined on various types of InfoProviders in BW, including InfoCubes, ODS objects, and InfoSets.
Power bi components
Power BI consists of several components for data transformation, modeling, visualization, and natural language querying. Power Query is used to connect to data sources, clean the data, and publish to Power BI or Excel. Power Pivot is an in-memory data modeling tool using DAX. Power View enables creation of reports and visualizations. Power Map visualizes geospatial data in 3D. Power BI Desktop is a development tool and Power Q&A allows natural language questions over published models.
SYBIS - Power BI
Sydney BI Social Group (SYBIS) - Presentation about Power BI: exciting new BI features in Excel 2013 and 365
Oracle OBIEE Data integration
How do you easily example OBIEE users in what way they can easily combine data from different kind of data sources. In this presentation you will find some easy examples of how to example this.
Bo df b_layer
The document summarizes the new Information Design Tool (IDT) in SAP BusinessObjects 4.0 for creating universes. The IDT breaks the universe down into three components - the Connection, Data Foundation, and Business Layer. Key updates include allowing multiple database connections per universe, improved editors for each component, and built-in data federation capabilities. The IDT provides improved functionality for developing universes over prior versions.
MS SQL SERVER: Using the data mining tools
This document provides an overview of using various Microsoft tools for data mining, including:
1. Business Intelligence Development Studio (BI Dev Studio) which is used to develop data mining models and contains tools like Solution Explorer and Designers.
2. Creating data sources and data source views (DSVs) to connect to and organize data for modeling.
3. Using the Data Mining Wizard to create mining structures and models by selecting data, algorithms, and parameters.
4. Refining models using the Data Mining Designer and tools like the Mining Structure Editor.
5. Generating reports on model results using SQL Server Reporting Services.
6. Managing databases and models using SQL Server
Power BI
Power BI is a business intelligence tool that converts data from different sources into attractive dashboards and reports. It includes Power BI Desktop for creating reports, Power BI Service for publishing reports, and Power BI mobile apps for viewing reports and dashboards. Power BI Desktop can import or directly query data from various sources like files, databases, and the web. It allows users to transform, visualize, and analyze data to gain insights. The imported data is stored in the Power BI service, while direct query leaves the data in its source.
Web Intelligence - Tutorial4
This document provides a tutorial on Web Intelligence, which is a tool for analyzing and reporting on business data. The tutorial covers topics such as creating reports, enhancing reports with features like breaks, filters, and alerts, formatting reports, and synchronizing multiple data sources. Web Intelligence allows users to analyze data and create customizable reports for sharing insights.
Enterprise Cloud Computing - Analytics, Planning & Digital Boardroom
Objective: This is my first attempt to bring practical business insights on SAP’s Cloud for Analytics (C4A) platform and also demonstrating the key implementation steps to deploy analytics on cloud from concept to realization.
Goal: Empower mainstream enterprise users to develop self-servicing analytics, planning, budgeting & forecasting solutions on cloud using SAP BusinessObjects Cloud Computing Platform.
Vision: Make business to quickly realize the measurable business values of SAP BusinessObjects Cloud
Simplify SAP BusinessObjects Cloud Implementation
Reduce the Implementation Cost of SAP BusinessObjects Cloud Implementation
Make SAP BusinessObjects Cloud Implementation Processes as a Repeatable Processes
What would be the Best and Risk Free Path to Implement and Adopt Analytics on Cloud?
Cloud for Analytics is an evolving area, so the first step in implementing cloud for analytics would be learning the fundamentals and understanding the key concepts, framework, architecture and building blocks of cloud for analytics solution. The following section describes the required key steps to implement and adopt SAP's cloud for analytics solutions.
1. Molder
2. Allocation
3. Stories
4. Digital Boardroom
5. Files
6. Events
7. Users
8. Deployment
9. Connection
10. System
More Related Content
What's hot
Web Intelligence - Tutorial6
SAP Business Objects 4.0 (SP02)
Beginners guide to Web Intelligence
Synchronizing Data from multiple sources
Web Intelligence - Tutorial3
The document provides a beginner's guide to Web Intelligence, which is a tool for designing reports from business data. It discusses topics like documents and queries, data restrictions, creating reports, enhancing reports, formulas and variables, synchronizing multiple data sources, and analyzing data. The document also describes how to design Web Intelligence reports by adding different types of tables, charts, and other elements to organize and visualize information from a data source. Reports can be saved inside documents and modified later on.
Web Intelligence - Tutorial5
This document provides an overview of Web Intelligence, an SAP Business Objects tool for analyzing and reporting on data. It discusses topics like documents and queries, data restrictions, creating reports, enhancing reports, formulas and variables, synchronizing multiple data sources, and analyzing and managing reports. The document also provides examples of using formulas and variables in reports as well as conditionally hiding columns using dynamic visibility.
SAP BO Web Intelligence Basics
The document provides an overview of SAP Webi (Web Intelligence) reporting tools. It describes the history and architecture of Webi, how to create reports using various data sources, and how to use features like filters, formulas, and sending reports to other users. The document also discusses related tools like the Business Explorer (BEx) for strategic analysis and query functions.
Sap BusinessObjects 4
The document discusses new features in SAP BusinessObjects 4.0, with a focus on the Information Design Tool. Key points include:
- The Information Design Tool (IDT) is the new semantic layer for SAP BusinessObjects and replaces the Universe Designer. It allows for multi-source universes that can connect to multiple data sources.
- New features of the IDT include the ability to create derived tables directly from the interface, replace tables easily, and merge multiple tables. Dimensional and OLAP support is also improved.
- SAP BusinessObjects 4.0 offers improvements like 64-bit architecture, increased performance, new applications like the Upgrade Management Tool, and changes to the deployment
SAP BusinessObjects Web Intelligence Report
Watch Here SAP BusinessObjects Web Intelligence Report
and with Video tutorial ,Learn SAP BusinessObjects Web Intelligence Report and how to use.
SAP BW - Info cube
An info cube is a data storage area that maintains summarized and aggregated data in a star schema structure. It consists of one fact table containing key figures and dimensions tables. There are 11 steps to create a standard info cube which stores data physically in the cube: 1) Create a data source, 2) Create an info package to load data, 3) Create the info cube, 4) Assign info objects to dimensions, 5) Create a transformation, 6) Create the data transfer process, 7) Execute to load data, 8) Check loaded data. Standard info cubes allow only read access while virtual cubes access live data and real-time cubes allow read/write.
SAP BusinessObject's Webi Rich Client
SAP BusinessObjects Web Intelligence Rich Client is a full-client reporting tool offered with Business Objects XI R3. This reporting tool is very similar to the Webi Java version that most end users are used to seeing in XI R2; however it offers a very important functionality of being able to work on reports offline without being connected to a CMS. It also provides equivalent report creation, editing, formatting, printing, and saving functionality that is found in Business Object’s original full-client reporting tool, Desktop Intelligence.
Sap business objects BI4.0 reporting presentation
The document discusses SAP Business Objects reporting tools. It provides an overview of ERP Technicals Inc. and their expertise in SAP Business Objects components like data warehousing, rapid marts, data cleansing, product migration, reporting, dashboards, proofs of concept, and training. The agenda outlines topics on SAP Business Objects architecture, universes, Web Intelligence, Crystal Xcelsius dashboards, and a demonstration.
Power Bi Basics
Power BI is a self-service business intelligence tool that allows users to analyze and visualize data. It consists of Power BI Desktop, the Power BI web service, and the Power BI mobile app. Power BI Desktop is used to build reports and dashboards locally, while the web service allows users to publish, share, and collaborate on reports and dashboards online. To create a dashboard in Power BI, a user would connect to a data source, build visualizations with the data, publish the report to the web, combine reports into a dashboard, and then share the dashboard.
Business Intelligence in Excel 2013
The new release of Excel enables business users to do self-service Business Intelligence directly in the client, which now becomes a complete and powerful self-service BI tool - Basically users have all they need in one familiar environment in order to do data modeling, exploration and visualization of the data. New capabilities and features delivered for end users in Excel 2013; - ability to analyze data ranging from a few rows to hundred of millions of rows with extreme analytical performance - opportunity to speed up analysis in Excel by easily cleaning up and shaping your data with Flash Fill and Quick Explore - mash-up and analyze data from virtually any source quickly and create compelling analytical apps with PowerPivot - provide stunning data visualization to discover new insights with interactive and familiar data exploration, visualization and presentation experience with Power View
Power bi
What is the Power BI and learn the Power BI by self and this presentation contains some use full links which help us at time of developing the Power BI.
Al kannan obiee implementation with ebs
The document provides an overview of implementing Oracle Business Intelligence Enterprise Edition (OBIEE) using an Oracle E-Business data source. It outlines the objectives to introduce OBIEE, demonstrate installation basics, repository creation, and sample reports. It describes OBIEE architecture with clients, presentation services, server, and data sources. It also covers installation options, the report development process, creating simple and star schema reports, and next steps.
Unit 2 b_ex_query_designer
BEx Query Designer allows users to define queries on data in SAP Business Warehouse (BW) by selecting characteristics and key figures from InfoProviders. Queries can be parameterized and data selection can be restricted by characteristic values, intervals, and hierarchy nodes. Once defined, queries can be saved and executed in BEx Analyzer or on the web. The tool provides functionality to open, modify, find, and filter existing queries defined on various types of InfoProviders in BW, including InfoCubes, ODS objects, and InfoSets.
Power bi components
Power BI consists of several components for data transformation, modeling, visualization, and natural language querying. Power Query is used to connect to data sources, clean the data, and publish to Power BI or Excel. Power Pivot is an in-memory data modeling tool using DAX. Power View enables creation of reports and visualizations. Power Map visualizes geospatial data in 3D. Power BI Desktop is a development tool and Power Q&A allows natural language questions over published models.
SYBIS - Power BI
Sydney BI Social Group (SYBIS) - Presentation about Power BI: exciting new BI features in Excel 2013 and 365
Oracle OBIEE Data integration
How do you easily example OBIEE users in what way they can easily combine data from different kind of data sources. In this presentation you will find some easy examples of how to example this.
Bo df b_layer
The document summarizes the new Information Design Tool (IDT) in SAP BusinessObjects 4.0 for creating universes. The IDT breaks the universe down into three components - the Connection, Data Foundation, and Business Layer. Key updates include allowing multiple database connections per universe, improved editors for each component, and built-in data federation capabilities. The IDT provides improved functionality for developing universes over prior versions.
MS SQL SERVER: Using the data mining tools
This document provides an overview of using various Microsoft tools for data mining, including:
1. Business Intelligence Development Studio (BI Dev Studio) which is used to develop data mining models and contains tools like Solution Explorer and Designers.
2. Creating data sources and data source views (DSVs) to connect to and organize data for modeling.
3. Using the Data Mining Wizard to create mining structures and models by selecting data, algorithms, and parameters.
4. Refining models using the Data Mining Designer and tools like the Mining Structure Editor.
5. Generating reports on model results using SQL Server Reporting Services.
6. Managing databases and models using SQL Server
Power BI
Power BI is a business intelligence tool that converts data from different sources into attractive dashboards and reports. It includes Power BI Desktop for creating reports, Power BI Service for publishing reports, and Power BI mobile apps for viewing reports and dashboards. Power BI Desktop can import or directly query data from various sources like files, databases, and the web. It allows users to transform, visualize, and analyze data to gain insights. The imported data is stored in the Power BI service, while direct query leaves the data in its source.
What's hot (20)
Viewers also liked
Web Intelligence - Tutorial4
This document provides a tutorial on Web Intelligence, which is a tool for analyzing and reporting on business data. The tutorial covers topics such as creating reports, enhancing reports with features like breaks, filters, and alerts, formatting reports, and synchronizing multiple data sources. Web Intelligence allows users to analyze data and create customizable reports for sharing insights.
Enterprise Cloud Computing - Analytics, Planning & Digital Boardroom
Objective: This is my first attempt to bring practical business insights on SAP’s Cloud for Analytics (C4A) platform and also demonstrating the key implementation steps to deploy analytics on cloud from concept to realization.
Goal: Empower mainstream enterprise users to develop self-servicing analytics, planning, budgeting & forecasting solutions on cloud using SAP BusinessObjects Cloud Computing Platform.
Vision: Make business to quickly realize the measurable business values of SAP BusinessObjects Cloud
Simplify SAP BusinessObjects Cloud Implementation
Reduce the Implementation Cost of SAP BusinessObjects Cloud Implementation
Make SAP BusinessObjects Cloud Implementation Processes as a Repeatable Processes
What would be the Best and Risk Free Path to Implement and Adopt Analytics on Cloud?
Cloud for Analytics is an evolving area, so the first step in implementing cloud for analytics would be learning the fundamentals and understanding the key concepts, framework, architecture and building blocks of cloud for analytics solution. The following section describes the required key steps to implement and adopt SAP's cloud for analytics solutions.
1. Molder
2. Allocation
3. Stories
4. Digital Boardroom
5. Files
6. Events
7. Users
8. Deployment
9. Connection
10. System
SECh78
System modeling techniques are used during requirements engineering and design to represent different perspectives of a system. Context models show the system and its environment, while process models illustrate system processes. Behavioral models include data flow diagrams for data processing and state machine diagrams for event-driven behavior. Semantic data models describe logical data structures. Object models represent system entities and relationships. CASE tools support creating and analyzing various system models during development. Prototyping, through evolutionary or throw-away approaches, helps validate requirements by allowing users to interact with early versions of the system. Rapid prototyping techniques include visual programming and reusing components.
CS554 � Introduction to Rational Rose
Rational Rose is a visual modeling tool that allows users to graphically represent different views of a software system using diagrams. The document introduces various diagram types in Rational Rose, including use case diagrams, class diagrams, sequence diagrams, collaboration diagrams, activity diagrams, component diagrams, deployment diagrams, and statechart diagrams. Each diagram type shows a different perspective and can be used at different stages of the software development process to help with requirements, design, and communication.
System analyst and design
This document provides an overview of the system development life cycle (SDLC) and object-oriented analysis and design. It discusses the four main phases of the SDLC - planning, analysis, design, and implementation. Within each phase, common techniques and deliverables are described, such as creating use case diagrams and class diagrams during analysis, and designing system architecture and user interfaces during design. Object-oriented concepts like classes, objects, and relationships are also explained.
BusinessObjects Cloud and How to Take Advantage of it for Your Planning Purposes
BusinessObjects Cloud and How to Take Advantage of it for Your Planning PurposesDickinson + Associates
BusinessObjects Cloud on HANA provides a Software as a Service (SAAS) on a public cloud platform to address a wide range of business issues. BusinessObjects Cloud for Planning offers the ability to roll out a public cloud planning application to strategic business units or an entire company that can leverage your existing BPC models as well as other BW or flat file data to provide a planning solution suited to fit your needs. BusinessObjects Cloud includes many delivered functionalities including allocations and easy to build reports and charts.
Join us as we take a look at real-world business planning scenarios and functionality with BusinessObjects Cloud. In this 60-minute webinar, we will:
• Take a detailed look at BusinessObjects Cloud running on SAP HANA
• Discuss integration of BPC and SAP Cloud for Planning
• Review delivered functionality
• Demonstrate BW or other non-BPC data in your stories
• Setting up personal Home pages specific to key users
• Demonstrate planning scenarios with BusinessObjects Cloud
• Answer questions and discuss how BusinessObjects Cloud can improve your business planning processes
Introduction To Uml
This document provides an introduction to structural and use case modeling using the Unified Modeling Language (UML). It defines structural modeling as emphasizing the structure of objects, including their classifiers, relationships, attributes and operations. Use case modeling partitions system functionality into meaningful transactions ("use cases") between users ("actors") and the system. The document then reviews the core concepts and diagram types for both structural and use case modeling in UML.
Webinar SAP BusinessObjects Cloud (English)
SAP BusinessObjects Cloud is a new generation of Software-as-a-Service (SaaS) that provides all analytics capabilities like business intelligence, planning, predictive analytics, governance, risk and compliance in one product. It is built natively on the SAP HANA Cloud Platform. SAP BusinessObjects Cloud allows users to analyze, plan, predict and decide in real-time with a consumer-grade user experience. Key capabilities include personalized dashboards, data visualization, planning, collaboration and geospatial analytics.
RMySQL Tutorial For Beginners
In this tutorial, we learn to access MySQL database from R using the RMySQL package. The tutorial covers everything from creating tables, appending data to removing tables from the database.
SAP BI Dashboards (Xcelsius) - Tutorial1
This document provides an introduction to SAP BI dashboards and the Xcelsius tool. It describes the key components of the Xcelsius interface including the component browser, canvas, properties panel, and object browser. It also explains how to add and format components on the canvas, set properties, group and lock objects, and navigate between components using the object browser. The goal of Xcelsius is to transform raw data into interactive and visually appealing dashboard presentations.
SAP Business Objects Universe Designer & Introduction to Business Intelligenc...
Universe is a middle layer between the database and reports that includes only required table structures to avoid burdening the database. It can generate multiple reports from a single universe. Changes to the database will impact the universe and reports, while changes to the universe only impact reports, not the database. The new release of SAP Business Objects BI 4.0 introduces native connectivity to SAP BW and SAP HANA via BICS connections for Web Intelligence reporting.
Database Project Airport management System
This document outlines the details of an airport management system project for a database management systems course. It includes the group members, instructor, table of contents, and overview of key aspects of setting up the database system. The document describes the entities, attributes, and relationships that will be modeled in the database using an entity-relationship diagram. It also discusses how SQL will be used to perform queries on the database.
Linked Data Tutorial
This document provides an overview of a Linked Data tutorial presented on March 6, 2009. The tutorial covered topics such as the motivation for Linked Open Data, relevant technologies like URIs, RDF, and SPARQL, and principles for publishing and interlinking data on the web in a way that is accessible to both humans and machines. The goal of Linked Data is to open up data silos and make public data available on the web in a standardized format.
Project of Airline booking system
This document provides an overview of a project done by Group 4. It lists the 15 project members by their student IDs. The contents section outlines the topics to be covered in the project report, including introductions to UML, an overview of UML diagrams, modeling techniques such as use cases, class diagrams, state diagrams and more. Relational database design is also mentioned as a UML extension that will be covered.
analysis and design of information system
Information systems analysis and design involves developing and maintaining computer-based information systems through a system development life cycle (SDLC) with phases like planning, analysis, design, implementation, and maintenance. Analysis involves breaking down a system to understand its components and functionality, while design creates a blueprint for how the system will be developed based on requirements. Key concepts in analysis and design include requirement analysis, abstraction, refinement, modularity, and tools like data flow diagrams and data dictionaries.
Personas, Scenarios, User Stories, Use Cases (IxDworks.com)
This document discusses user-centered design approaches like personas, scenarios, and user stories. It provides templates and examples for creating a persona profile with background, goals, and mapping. Scenarios are described as stories that illustrate user interactions and goals. User stories are goals the user wants to accomplish with the product in a simple format, while use cases describe step-by-step processes. The document advises creating these artifacts based on research to understand users and explore design solutions from their perspective.
Viewers also liked (16)
Enterprise Cloud Computing - Analytics, Planning & Digital Boardroom
Enterprise Cloud Computing - Analytics, Planning & Digital Boardroom
BusinessObjects Cloud and How to Take Advantage of it for Your Planning Purposes
BusinessObjects Cloud and How to Take Advantage of it for Your Planning Purposes
SAP Business Objects Universe Designer & Introduction to Business Intelligenc...
SAP Business Objects Universe Designer & Introduction to Business Intelligenc...
Personas, Scenarios, User Stories, Use Cases (IxDworks.com)
Personas, Scenarios, User Stories, Use Cases (IxDworks.com)
Similar to Information Design Tool -Tutorial5
excel 2010 pivot tables
This document provides instructions on how to create and manipulate PivotTables in Microsoft Excel 2010. It discusses the different field types in a PivotTable, how to create a PivotTable from an Excel data list, and how to rearrange, update, and add or remove fields after initial creation. The goal is to teach users how to use PivotTables to analyze and reveal insights from their data.
Benedutch 2011 ew_ppt
This document describes a generic ETL process to load data into a Data Vault model using Pentaho Data Integration. Key points include:
- A single parameterized job and transformation was created for loading each type of Data Vault entity (hub, link, hub satellite, link satellite) driven by metadata from Excel and database tables.
- Loading is done in a loop with jobs logging details for easy debugging. Errors are captured in error tables to identify design issues.
- The process is available for free and supports MySQL and PostgreSQL backends initially with Oracle planned. Recipients can obtain the code by sending Belgian beer to the author.
In press checking with crossref API
Instructions from University of Leeds on their in press checking process using the crossref API. From UKCORR members' day 2018.
DSN_Power BIDSN_Power BIDSN_Power BIDSN_Power BIDSN_Power BIDSN_Power BI
This document provides an overview of a training on Microsoft Power BI. It introduces Power BI as a business intelligence tool consisting of three core applications: connecting to data sources, data preparation and analysis, and visualization and collaboration. It outlines the key topics that will be covered in the training, including connecting and transforming data in Power BI Desktop, data modeling, analyzing data with DAX calculations, visualizing and formatting data, filters, and refreshing and scheduling reports in Power BI Service. The training will cover the components and building blocks of Power BI, how to use the Power BI Desktop interface, and include hands-on exercises for working with data, creating reports and dashboards, and publishing to Power BI Service.
Mapping inheritance structures_mapping_class
This document discusses different approaches for mapping object-oriented class hierarchies and properties to a relational database schema. It describes mapping an entire class hierarchy to a single table, mapping each concrete class to its own table, mapping each class to its own table, and using a generic table structure. It also discusses strategies for mapping class-scope properties that apply to all instances of a class, including using single-column single-row tables, multi-column single-row tables, multi-column single-row tables for all classes, and a multi-row generic schema.
Assignment # 2PreliminariesImportant Points· Evidence of acad.docx
Assignment # 2Preliminaries
Important Points
· Evidence of academic misconduct (e.g., plagiarism, collaboration/collusion among students) will be taken seriously and University regulations strictly followed.
· You are expected to produce a word-processed answer to this assignment. Please use Arial font and a font size of 12. For SQL code and output, you can use courier new, which preserves SQL format and layout.
· You are required to use the Harvard Style of referencing and citation. The “Cite them right” guide is recommended for referencing and citation (Pears and Shields, 2008) which should be followed throughout your answer especially Part 3.
· Late submissions will be given zero marks unless prior permission is gained from the school office/programme leader.
Module Learning Outcomes (MLOs) assessed:
Knowledge & Understanding:
2. Key concepts of data warehousing.
Intellectual / Professional skills & abilities:
3. Conceptual data modelling, relational database design and implementation in SQL & PL/SQL, and object-based databases.
4. Design and Implementation of a data warehouse using Oracle database system.
Tasks of the Assignment
Part 1 (50 marks) Scenario: Mechanical Production Factories (MPF) Database System
MPF is a company that produces customised mechanical products within Europe. The company produces a rang of mechanical products at several factories. Information about which work force are assigned to which production orders and kept in the force usage register.
In order to access information quickly and to ensure that all past records are available for audit purposes, the company developed a database. Figure 1 shows a UML class diagram, which provides a conceptual model of the database. Relational Design for MPF Database System
A conceptual model of a database may be implemented using any database system (e.g. relational, object-relational, object-oriented). However, to start with, we have mapped the MPF’s conceptual model onto a relational logical model. Figure 2 details the relations for an implementation of the database using a relational database system. Note that Figure 2 uses shorthand / abbreviated notation for data types / domains for describing various attributes of the relations involved in the database.
Figure 1: UML Class Diagram for the MPF Database
Domains/Data Types: ID = Number(6) LTXT = Varchar(50)
STXT = Varchar(30) DEC = Number(8, 2) INT = Number(6)
Factory (FactoryId: ID, Location: LTXT, Country: LTXT)
Product (ProdId: ID, Description: LTXT, CostPerItem: DEC, LabCostPerItem: DEC)
FactoryProduct (FactoryId: ID *: ID, ProdId*: ID)
Workforce (wfId: ID, wfName: STXT, yearlyIncome: DEC, yearlyTax: DEC, taxCode: INT, factoryId*: ID)
Production (prodOrderId: ID, quantity: INT, itemPrice: DEC,orderDate: Date, promiseDate: Date, completionDate: Date, shipmentDate: Date, status: CHAR, prodID*: ID)
ForceUsage (wfId*:ID, prodOrderId*:I.
01 data modeling-and-er-diagrams
The document discusses database modeling concepts and how to create entity relationship (E/R) diagrams using SQL Server Management Studio and MySQL Workbench. It covers topics such as identifying entities and relationships from requirements, defining primary keys, creating tables, defining column data types, and establishing relationships between tables. Screenshots and step-by-step instructions are provided for creating databases, tables, and relationships in SQL Server and MySQL. Sample exercises are included at the end for creating E/R diagrams based on university and dictionary schemas.
Sap bo 4.2 course content
SAP BO 4.2 Training Online and job support
Online Training SAP BO 4.2
Manasa
Contact numbers : +91 9972971235,
+91-9663233300(India)
Email Id : Madhukar.dwbi@gmail.com
Website:http://www.sapboonlinetrainings.com
SAP BusinessObjects Design Studio 1.7
SAP BusinessObjects Design Studio 1.7
In this SAP Design Studio webinar replay,SAP BusinessObjects Design Studio, presents the key capabilities of the recently released SAP BusinessObjects Design Studio 1.6. Jie’s presentation includes a review of the scorecard, spreadsheet, CSV file as data source, and geomap enhancements and is followed by a product demonstration as well as a glimpse at the product roadmap.
Agenda:
- Introduction
- Overview of the SAP BI Client Portfolio
- What is SAP BusinessObjects Design Studio?
- New features and functions in release 1.6
- Product Demonstration
- Roadmap
- Q&A
suman training
Contact numbers : +91 9972971235,+91-9663233300(India)
Email Id : Madhukar.dwbi@gmail.com,
YouTube: https://www.youtube.com/channel/UCyjP...
Facebook: https://www.facebook.com/?sw_fnr_id=7...
Twitter: https://twitter.com/suman4tr
Website: http://onlinebusinessobjectstraining.com
http://www.sap-bo-online-training.com/
http://sapboonlinetrainings.com
Online SAP BO 4.2 Training
Online SAP BO 4.2 Training
Ashok
Contact numbers : +91 9972971235,
+91-9663233300(India)
Email Id : Madhukar.dwbi@gmail.com
Website:http://onlinebusinessobjectstraining.com
SAP Business Objects 4.2 Training Online
SAP Business Objects 4.2 Training Online
Ashok
Contact numbers : +91 9972971235,
+91-9663233300(India)
Email Id : Madhukar.dwbi@gmail.com
Website:http://onlinebusinessobjectstraining.com
BOBJ Training Online
BOBJ Training Online
Ashok
Contact numbers : +91 9972971235,
+91-9663233300(India)
Email Id : Madhukar.dwbi@gmail.com
Website:http://www.sapboonlinetrainings.com
Linq to sql
What is ORM
What is LINQ to SQL
Querying and updating a database
Lazy loading and eager loading
Joining two tables
SAP BO Dashboard Training Online
The document provides an overview of the topics covered in the SAP BO 4.1 Online Training course, including Web Intelligence for report creation and querying, the Universe Design Tool for building and securing universes, Information Design Tool concepts, server administration, dashboards, Crystal Reports, Design Studio, Lumira, and more. The course covers concepts, getting started tutorials, and advanced techniques for each topic area.
SAP BO 4.1 Training
The document provides an overview of the topics covered in the SAP BO 4.1 Online Training course, including Web Intelligence for report creation and querying, the Universe Design Tool for building and securing universes, Information Design Tool concepts, Server Administration, Dashboards, Crystal Reports, Design Studio, Lumira, and more. The course covers concepts, getting started exercises, and advanced techniques for each product area.
Lab 2 Work with Dictionary and Create Relational Database (60 pts.).docx
Lab 2: Work with Dictionary and Create Relational Database (60 pts.)
iLAB OVERVIEW
Scenario and Summary
In this lab, you will prepare a Data Dictionary based on the list of elements. Also, your task will be determined the tables, their relationships, primary and foreign keys. Based on this analysis, you will create Database Schema, relational tables, Entity –Relational Diagram (ERD), establish connection to your local MySQL Server, create physical database and insert data to the tables.
MySQL provides two primary types of file management: dictionary-managed files and MySQL Workbench-managed files. As part of this iLab, you will need to supply some information as to how you would use both of these approaches, and you will have to discuss some of the advantages of each.
For Step 3, you need access to your database instance. If you have any difficulties connecting your database instance, let's take error messages, screen shots, descriptions of the situation to the graded threads and work as a team to resolve issues.
Now you are ready to proceed.
Deliverables
Your assignment will be graded based on the following.
Assignment Step
Description
Points
Step 1
Create Data Dictionary for provided elements (Word document)
15
Step 2
Create SCHEMA and database tables in MySQL Workbench
15
Step 3
Establish connection to the MySQL Server (screenshots)
15
Step 4
Insert data to tables using MySQL Workbench
15
Total Lab Points
60
For Steps 1, 2, 3 and 4 create a single Word document and include the answers or solutions to all problems. Be sure to label your document and include your name and course number in the heading. Save your document as "yourname_Lab_2.docx."
Submit both "yourname_Lab_2.docx" to the Dropbox for this week.
iLAB STEPS
STEP 1: Create Data Dictionary for provided elements
As the DBA for your company, you have decided to install a new version of the MySQL database to replace the current database version being used. The old database has become a constant headache and seems to be causing an overload on the disk drive's I/O channels. Further analysis has also shown that two primary large tables are the main points of access. The new tables will be DEPT, EMPLOYEE, and BONUS.
Describe how you plan to compile the Data Dictionary and decide on the table’s structure with the new MySQL database.
Given list of elements:
NN
Attribute Name
Column name
Data Type
1
Employee number (PK)
EMPNO
NUMBER(4)
2
Employee first name
EFNAME
VARCHAR2(10)
3
Employee last name
ELNAME
VARCHAR2(20)
4
Job category (FK)
JOBCATEGORY
VARCHAR2(4)
5
Manager
MGR
NUMBER (4)
6
Hire date
HIREDATE
DATE
7
Salary
SAL
NUMBER (7.2)
8
Commission
COMM
NUMBER (7.2)
9
Department number(FK)
DEPTNO
NUMBER(2)
10
Department name
DEPTNAME
VARCHAR2(14)
11
Location
LOC
VARCHAR2(13)
12
Job title
JOBTITLE
VARCHAR2(20)
13
Job description
JOBDESC
VARCHAR2(20)
Compile Data Dictionary (in alphabetic order):
NN
Attribute Name
Column name
Data Type
Data element description
Table name
Primary key/ Foreign k.
Sap business objects bobi training
SAP Business Objects XIR3.0/3.1, BI 4.0 & 4.1 Course Content
SAP Business Objects Web Intelligence and BI Launch Pad 4.0
Introducing Web Intelligence
BI launch pad: What's new in 4.0
Customizing BI launch pad
Creating Web Intelligence Documents with Queries
Restricting Data Returned by a Query
Report Design in the Java Report Panel
Enhancing the Presentation of Reports
Formatting Reports
Creating Formulas and Variables
Synchronizing Data
Analyzing Data
Drilling
Filtering data
Alerts
Input Control
Scheduling (email)
Data Refresh introduction
Sharing Web Intelligence Documents
SAP Business Objects BI Information Design Tool 4.0
Create a project
Create a connection to a relational database
Create a data foundation based on a single source relational database
Create a business layer based on a single relational data source
Publish a new universe file based on a single data source
Retrieve a universe from a repository location
Publish a universe to a local folder
Retrieve a universe from a local folder
Open a local project
Delete a local project
Convert a repository universe from a UNV to a UNX
Convert a local universe from a UNV to a UNX
Connecting to Data Sources
Create a connection shortcut
View and filter data source values in the connection editor
Create a connection to an OLAP data source
Create a BICS connection to SAP BW for client tools
Create a relational connection to SQL Server using OLEDB providers
Building the Structure of a Universe
Arrange tables in a data foundation
View table values in a data foundation
View values from multiple tables in a data foundation
Filter table values in a data foundation
Filter values from multiple tables in a data foundation
Apply a wildcard to filter table values in a data foundation
Apply a wildcard to filter values from multiple tables in a data foundation
Sort and re-order table columns in a data foundation
Edit table values in a data foundation
Create an equi-join, theta join, outer join, shortcut join
Create a self-restricting join using a column filter
Modify and remove a column filter
Detect join cardinalities in a data foundation
Manually set join cardinalities in a data foundation
Refresh the structure of a universe
Creating the Business Layer of a Universe
Create business layer folders and subfolders
Create a business layer folder and objects automatically from a table
Create a business layer subfolder and objects automatically from a table
Create dimension objects automatically from a table
Create a dimension, attribute , measure
Hide folders and objects in a business layer
Organize folders and subfolders in a business layer
View table and object dependencies
Create a custom navigation path
Create a dimensional business layer from an OLAP data source
Copy and paste folders and objects in a business layer
Filtering Data in Objects
Create a pre-defined
SAP BOBJ 4.2 Jobsupport and Online Training
The document outlines an online training course for SAP BO 4.1 that covers topics such as Web Intelligence, Universe Design Tool, Information Design Tool, Server Administration, Crystal Reports, Design Studio, and Lumira. The Web Intelligence section covers creating and designing reports with queries, filters, tables, charts and other features. The Universe Design Tool and Information Design Tool sections cover building and securing universes from data sources. Server administration covers security, scheduling and other platform tasks. Crystal Reports, Design Studio and Lumira sections provide overviews of those tools.
PDI data vault framework #pcmams 2012
The document describes the Data Vault modeling technique which involves storing historical data from multiple sources in a series of normalized tables. It outlines the key components of a Data Vault including hubs, links, and satellites. It then discusses how to implement a Data Vault using an ETL framework, metadata tables, and automation to load the Data Vault from source systems in a standardized, repeatable process.
Presentation pdi data_vault_framework_meetup2012
The document describes the Data Vault modeling technique which involves storing historical data from different sources in a series of normalized tables. It outlines the key components of a Data Vault including hubs, links, and satellites. It then discusses how to implement a Data Vault using the Pentaho Data Integration (Kettle) tool including generating and loading metadata, and executing jobs and transformations in parallel via a framework that standardizes the ETL process.
Similar to Information Design Tool -Tutorial5 (20)
DSN_Power BIDSN_Power BIDSN_Power BIDSN_Power BIDSN_Power BIDSN_Power BI
DSN_Power BIDSN_Power BIDSN_Power BIDSN_Power BIDSN_Power BIDSN_Power BI
Assignment # 2PreliminariesImportant Points· Evidence of acad.docx
Assignment # 2PreliminariesImportant Points· Evidence of acad.docx
Lab 2 Work with Dictionary and Create Relational Database (60 pts.).docx
Lab 2 Work with Dictionary and Create Relational Database (60 pts.).docx
Recently uploaded
Let's Integrate MuleSoft RPA, COMPOSER, APM with AWS IDP along with Slack
Discover the seamless integration of RPA (Robotic Process Automation), COMPOSER, and APM with AWS IDP enhanced with Slack notifications. Explore how these technologies converge to streamline workflows, optimize performance, and ensure secure access, all while leveraging the power of AWS IDP and real-time communication via Slack notifications.
Building Production Ready Search Pipelines with Spark and Milvus
Spark is the widely used ETL tool for processing, indexing and ingesting data to serving stack for search. Milvus is the production-ready open-source vector database. In this talk we will show how to use Spark to process unstructured data to extract vector representations, and push the vectors to Milvus vector database for search serving.
“I’m still / I’m still / Chaining from the Block”
“An Outlook of the Ongoing and Future Relationship between Blockchain Technologies and Process-aware Information Systems.” Invited talk at the joint workshop on Blockchain for Information Systems (BC4IS) and Blockchain for Trusted Data Sharing (B4TDS), co-located with with the 36th International Conference on Advanced Information Systems Engineering (CAiSE), 3 June 2024, Limassol, Cyprus.
Essentials of Automations: The Art of Triggers and Actions in FME
In this second installment of our Essentials of Automations webinar series, we’ll explore the landscape of triggers and actions, guiding you through the nuances of authoring and adapting workspaces for seamless automations. Gain an understanding of the full spectrum of triggers and actions available in FME, empowering you to enhance your workspaces for efficient automation.
We’ll kick things off by showcasing the most commonly used event-based triggers, introducing you to various automation workflows like manual triggers, schedules, directory watchers, and more. Plus, see how these elements play out in real scenarios.
Whether you’re tweaking your current setup or building from the ground up, this session will arm you with the tools and insights needed to transform your FME usage into a powerhouse of productivity. Join us to discover effective strategies that simplify complex processes, enhancing your productivity and transforming your data management practices with FME. Let’s turn complexity into clarity and make your workspaces work wonders!
20240605 QFM017 Machine Intelligence Reading List May 2024
Everything I found interesting about machines behaving intelligently during May 2024
Pushing the limits of ePRTC: 100ns holdover for 100 days
At WSTS 2024, Alon Stern explored the topic of parametric holdover and explained how recent research findings can be implemented in real-world PNT networks to achieve 100 nanoseconds of accuracy for up to 100 days.
HCL Notes und Domino Lizenzkostenreduzierung in der Welt von DLAU
Webinar Recording: https://www.panagenda.com/webinars/hcl-notes-und-domino-lizenzkostenreduzierung-in-der-welt-von-dlau/
DLAU und die Lizenzen nach dem CCB- und CCX-Modell sind für viele in der HCL-Community seit letztem Jahr ein heißes Thema. Als Notes- oder Domino-Kunde haben Sie vielleicht mit unerwartet hohen Benutzerzahlen und Lizenzgebühren zu kämpfen. Sie fragen sich vielleicht, wie diese neue Art der Lizenzierung funktioniert und welchen Nutzen sie Ihnen bringt. Vor allem wollen Sie sicherlich Ihr Budget einhalten und Kosten sparen, wo immer möglich. Das verstehen wir und wir möchten Ihnen dabei helfen!
Wir erklären Ihnen, wie Sie häufige Konfigurationsprobleme lösen können, die dazu führen können, dass mehr Benutzer gezählt werden als nötig, und wie Sie überflüssige oder ungenutzte Konten identifizieren und entfernen können, um Geld zu sparen. Es gibt auch einige Ansätze, die zu unnötigen Ausgaben führen können, z. B. wenn ein Personendokument anstelle eines Mail-Ins für geteilte Mailboxen verwendet wird. Wir zeigen Ihnen solche Fälle und deren Lösungen. Und natürlich erklären wir Ihnen das neue Lizenzmodell.
Nehmen Sie an diesem Webinar teil, bei dem HCL-Ambassador Marc Thomas und Gastredner Franz Walder Ihnen diese neue Welt näherbringen. Es vermittelt Ihnen die Tools und das Know-how, um den Überblick zu bewahren. Sie werden in der Lage sein, Ihre Kosten durch eine optimierte Domino-Konfiguration zu reduzieren und auch in Zukunft gering zu halten.
Diese Themen werden behandelt
- Reduzierung der Lizenzkosten durch Auffinden und Beheben von Fehlkonfigurationen und überflüssigen Konten
- Wie funktionieren CCB- und CCX-Lizenzen wirklich?
- Verstehen des DLAU-Tools und wie man es am besten nutzt
- Tipps für häufige Problembereiche, wie z. B. Team-Postfächer, Funktions-/Testbenutzer usw.
- Praxisbeispiele und Best Practices zum sofortigen Umsetzen
GraphRAG for Life Science to increase LLM accuracy
GraphRAG for life science domain, where you retriever information from biomedical knowledge graphs using LLMs to increase the accuracy and performance of generated answers
20240607 QFM018 Elixir Reading List May 2024
Everything I found interesting about the Elixir programming ecosystem in May 2024
Artificial Intelligence for XMLDevelopment
In the rapidly evolving landscape of technologies, XML continues to play a vital role in structuring, storing, and transporting data across diverse systems. The recent advancements in artificial intelligence (AI) present new methodologies for enhancing XML development workflows, introducing efficiency, automation, and intelligent capabilities. This presentation will outline the scope and perspective of utilizing AI in XML development. The potential benefits and the possible pitfalls will be highlighted, providing a balanced view of the subject.
We will explore the capabilities of AI in understanding XML markup languages and autonomously creating structured XML content. Additionally, we will examine the capacity of AI to enrich plain text with appropriate XML markup. Practical examples and methodological guidelines will be provided to elucidate how AI can be effectively prompted to interpret and generate accurate XML markup.
Further emphasis will be placed on the role of AI in developing XSLT, or schemas such as XSD and Schematron. We will address the techniques and strategies adopted to create prompts for generating code, explaining code, or refactoring the code, and the results achieved.
The discussion will extend to how AI can be used to transform XML content. In particular, the focus will be on the use of AI XPath extension functions in XSLT, Schematron, Schematron Quick Fixes, or for XML content refactoring.
The presentation aims to deliver a comprehensive overview of AI usage in XML development, providing attendees with the necessary knowledge to make informed decisions. Whether you’re at the early stages of adopting AI or considering integrating it in advanced XML development, this presentation will cover all levels of expertise.
By highlighting the potential advantages and challenges of integrating AI with XML development tools and languages, the presentation seeks to inspire thoughtful conversation around the future of XML development. We’ll not only delve into the technical aspects of AI-powered XML development but also discuss practical implications and possible future directions.
Unlock the Future of Search with MongoDB Atlas_ Vector Search Unleashed.pdf
Discover how MongoDB Atlas and vector search technology can revolutionize your application's search capabilities. This comprehensive presentation covers:
* What is Vector Search?
* Importance and benefits of vector search
* Practical use cases across various industries
* Step-by-step implementation guide
* Live demos with code snippets
* Enhancing LLM capabilities with vector search
* Best practices and optimization strategies
Perfect for developers, AI enthusiasts, and tech leaders. Learn how to leverage MongoDB Atlas to deliver highly relevant, context-aware search results, transforming your data retrieval process. Stay ahead in tech innovation and maximize the potential of your applications.
#MongoDB #VectorSearch #AI #SemanticSearch #TechInnovation #DataScience #LLM #MachineLearning #SearchTechnology
Observability Concepts EVERY Developer Should Know -- DeveloperWeek Europe.pdf
Monitoring and observability aren’t traditionally found in software curriculums and many of us cobble this knowledge together from whatever vendor or ecosystem we were first introduced to and whatever is a part of your current company’s observability stack.
While the dev and ops silo continues to crumble….many organizations still relegate monitoring & observability as the purview of ops, infra and SRE teams. This is a mistake - achieving a highly observable system requires collaboration up and down the stack.
I, a former op, would like to extend an invitation to all application developers to join the observability party will share these foundational concepts to build on:
GraphSummit Singapore | Enhancing Changi Airport Group's Passenger Experience...
Dr. Sean Tan, Head of Data Science, Changi Airport Group
Discover how Changi Airport Group (CAG) leverages graph technologies and generative AI to revolutionize their search capabilities. This session delves into the unique search needs of CAG’s diverse passengers and customers, showcasing how graph data structures enhance the accuracy and relevance of AI-generated search results, mitigating the risk of “hallucinations” and improving the overall customer journey.
Why You Should Replace Windows 11 with Nitrux Linux 3.5.0 for enhanced perfor...
The choice of an operating system plays a pivotal role in shaping our computing experience. For decades, Microsoft's Windows has dominated the market, offering a familiar and widely adopted platform for personal and professional use. However, as technological advancements continue to push the boundaries of innovation, alternative operating systems have emerged, challenging the status quo and offering users a fresh perspective on computing.
One such alternative that has garnered significant attention and acclaim is Nitrux Linux 3.5.0, a sleek, powerful, and user-friendly Linux distribution that promises to redefine the way we interact with our devices. With its focus on performance, security, and customization, Nitrux Linux presents a compelling case for those seeking to break free from the constraints of proprietary software and embrace the freedom and flexibility of open-source computing.
GraphSummit Singapore | Neo4j Product Vision & Roadmap - Q2 2024
Maruthi Prithivirajan, Head of ASEAN & IN Solution Architecture, Neo4j
Get an inside look at the latest Neo4j innovations that enable relationship-driven intelligence at scale. Learn more about the newest cloud integrations and product enhancements that make Neo4j an essential choice for developers building apps with interconnected data and generative AI.
Driving Business Innovation: Latest Generative AI Advancements & Success Story
Are you ready to revolutionize how you handle data? Join us for a webinar where we’ll bring you up to speed with the latest advancements in Generative AI technology and discover how leveraging FME with tools from giants like Google Gemini, Amazon, and Microsoft OpenAI can supercharge your workflow efficiency.
During the hour, we’ll take you through:
Guest Speaker Segment with Hannah Barrington: Dive into the world of dynamic real estate marketing with Hannah, the Marketing Manager at Workspace Group. Hear firsthand how their team generates engaging descriptions for thousands of office units by integrating diverse data sources—from PDF floorplans to web pages—using FME transformers, like OpenAIVisionConnector and AnthropicVisionConnector. This use case will show you how GenAI can streamline content creation for marketing across the board.
Ollama Use Case: Learn how Scenario Specialist Dmitri Bagh has utilized Ollama within FME to input data, create custom models, and enhance security protocols. This segment will include demos to illustrate the full capabilities of FME in AI-driven processes.
Custom AI Models: Discover how to leverage FME to build personalized AI models using your data. Whether it’s populating a model with local data for added security or integrating public AI tools, find out how FME facilitates a versatile and secure approach to AI.
We’ll wrap up with a live Q&A session where you can engage with our experts on your specific use cases, and learn more about optimizing your data workflows with AI.
This webinar is ideal for professionals seeking to harness the power of AI within their data management systems while ensuring high levels of customization and security. Whether you're a novice or an expert, gain actionable insights and strategies to elevate your data processes. Join us to see how FME and AI can revolutionize how you work with data!
AI 101: An Introduction to the Basics and Impact of Artificial Intelligence
Imagine a world where machines not only perform tasks but also learn, adapt, and make decisions. This is the promise of Artificial Intelligence (AI), a technology that's not just enhancing our lives but revolutionizing entire industries.
Recently uploaded (20)
Let's Integrate MuleSoft RPA, COMPOSER, APM with AWS IDP along with Slack
Let's Integrate MuleSoft RPA, COMPOSER, APM with AWS IDP along with Slack
Building Production Ready Search Pipelines with Spark and Milvus
Building Production Ready Search Pipelines with Spark and Milvus
Essentials of Automations: The Art of Triggers and Actions in FME
Essentials of Automations: The Art of Triggers and Actions in FME
20240605 QFM017 Machine Intelligence Reading List May 2024
20240605 QFM017 Machine Intelligence Reading List May 2024
Pushing the limits of ePRTC: 100ns holdover for 100 days
Pushing the limits of ePRTC: 100ns holdover for 100 days
HCL Notes und Domino Lizenzkostenreduzierung in der Welt von DLAU
HCL Notes und Domino Lizenzkostenreduzierung in der Welt von DLAU
GraphRAG for Life Science to increase LLM accuracy
GraphRAG for Life Science to increase LLM accuracy
Unlock the Future of Search with MongoDB Atlas_ Vector Search Unleashed.pdf
Unlock the Future of Search with MongoDB Atlas_ Vector Search Unleashed.pdf
Observability Concepts EVERY Developer Should Know -- DeveloperWeek Europe.pdf
Observability Concepts EVERY Developer Should Know -- DeveloperWeek Europe.pdf
GraphSummit Singapore | Enhancing Changi Airport Group's Passenger Experience...
GraphSummit Singapore | Enhancing Changi Airport Group's Passenger Experience...
Why You Should Replace Windows 11 with Nitrux Linux 3.5.0 for enhanced perfor...
Why You Should Replace Windows 11 with Nitrux Linux 3.5.0 for enhanced perfor...
GraphSummit Singapore | Neo4j Product Vision & Roadmap - Q2 2024
GraphSummit Singapore | Neo4j Product Vision & Roadmap - Q2 2024
Driving Business Innovation: Latest Generative AI Advancements & Success Story
Driving Business Innovation: Latest Generative AI Advancements & Success Story
AI 101: An Introduction to the Basics and Impact of Artificial Intelligence
AI 101: An Introduction to the Basics and Impact of Artificial Intelligence
Information Design Tool -Tutorial5
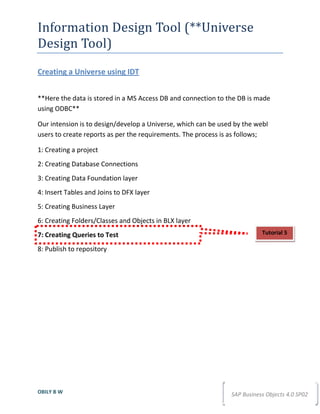
- 1. Information Design Tool (**Universe Design Tool) Creating a Universe using IDT **Here the data is stored in a MS Access DB and connection to the DB is made using ODBC** Our intension is to design/develop a Universe, which can be used by the webI users to create reports as per the requirements. The process is as follows; 1: Creating a project 2: Creating Database Connections 3: Creating Data Foundation layer 4: Insert Tables and Joins to DFX layer 5: Creating Business Layer 6: Creating Folders/Classes and Objects in BLX layer 7: Creating Queries to Test Tutorial 5 8: Publish to repository OBILY B W SAP Business Objects 4.0 SP02
- 2. INFORMATION DESIGN TOOL TUTORIAL 5 SQL Traps A trap is a situation during the Universe design where the query returns higher number of rows, than expected results. There are two types of SQL traps; CHASM trap This is a problem with join path between three tables, where a single table has 2 one-to-many join paths between the other two tables and there is no context to separate the converging path. The relationship between three tables will be “many-to-one-to-many”. In above case when a query includes object from table B and Table C and objects from table A, the CHASM trap causes a query to return every possible combination of one measure with other. This result gets multiplied by number of rows in result set and output is similar like a Cartesian product. Chasm trap is not dependent on object types. FAN trap This occurs when there is a one-to-many join to a table that fans out into another one-to-many join to another table. It does not result into fan trap unless a query includes a measure object on the middle table ('B') of the table path and an object (of any kind) from the subsequent table ('C'). The trap only occurs where a column in table B holds data values which are already a sum of those values held at table C. OBILY B W SAP Business Objects 4.0 SP02
- 3. INFORMATION DESIGN TOOL TUTORIAL 5 If we run a query with objects Y and Z, the SQL will relate table tables B and C which have 1: N relationship. The result will be inflated as the value for Y object being multiplied by the number of values of the Z object related to the Y object value. We cannot automatically detect FAN traps but needs to visually examine the direction of the cardinalities. OBILY B W SAP Business Objects 4.0 SP02
- 4. INFORMATION DESIGN TOOL TUTORIAL 5 How to resolve Chasm Trap? Analyze one –to-many join paths in the schema, Chasm trap is resolved by executing separate SELECT statements for object Y and object Z. OBILY B W SAP Business Objects 4.0 SP02
- 5. INFORMATION DESIGN TOOL TUTORIAL 5 This is why the Sale and Rental revenues got doubled Either modify the SQL parameters for the universe and generate separate SQL queries for each measure or simply use context for each fact table. How to resolve FAN Trap? For resolving the FAN trap the best method will be to use a combination of Aliases and Contexts. Create an Alias for the table which contain the aggregated value (B table in the example) and then detect and implement contexts to separate the query. OBILY B W SAP Business Objects 4.0 SP02
- 6. INFORMATION DESIGN TOOL TUTORIAL 5 Create an alias for a middle table (B). Create a join between new alias table (Ba) and first table (A) which is at one end. Set the cardinality and set context for the join. Change the parameter in Business layer of measure “Y” to refer to new alias table. OBILY B W SAP Business Objects 4.0 SP02