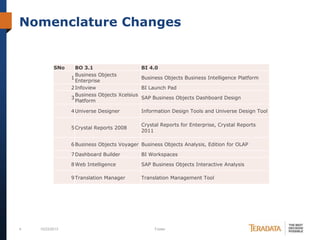
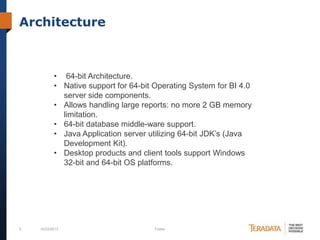
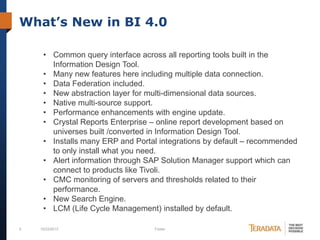
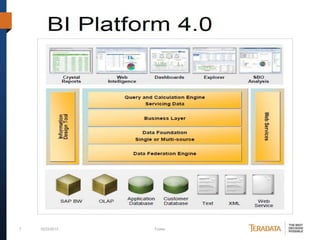
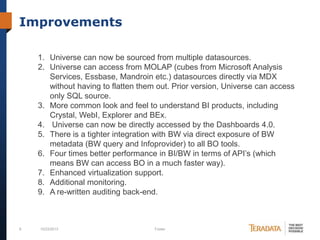
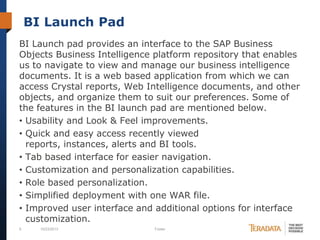
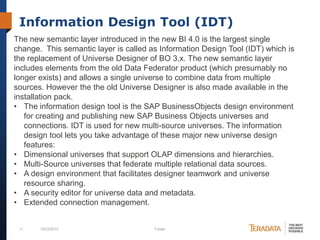
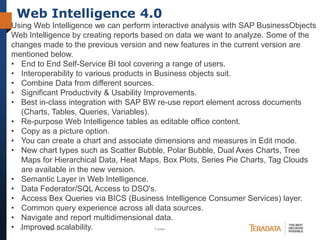
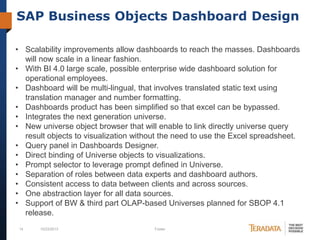
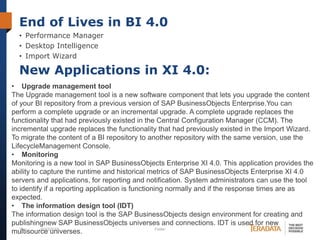
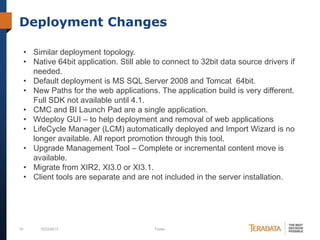
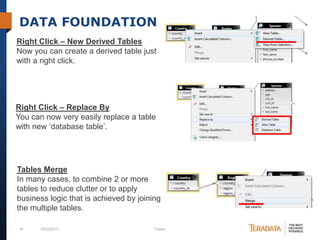
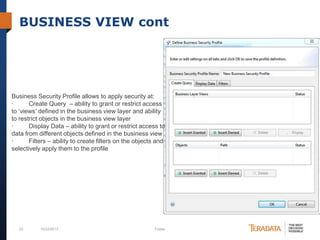
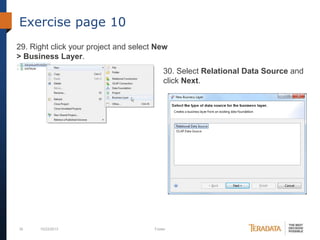
The document discusses new features in SAP BusinessObjects 4.0, with a focus on the Information Design Tool. Key points include:
- The Information Design Tool (IDT) is the new semantic layer for SAP BusinessObjects and replaces the Universe Designer. It allows for multi-source universes that can connect to multiple data sources.
- New features of the IDT include the ability to create derived tables directly from the interface, replace tables easily, and merge multiple tables. Dimensional and OLAP support is also improved.
- SAP BusinessObjects 4.0 offers improvements like 64-bit architecture, increased performance, new applications like the Upgrade Management Tool, and changes to the deployment
SAP Business Objects Universe Designer & Introduction to Business Intelligenc...BigClasses Com
SAP Business Objects Universe Designer & Introduction to Business Intelligence Consumer Services,BO universe diagram,SQL structured schema,creating schema with joins and tables.
Power BI: Introduction with a use case and solutionAlvina Verghis
This PPT gives a brief introduction to the Power BI software. It gives the brief intro of the software with a use case of how Power BI is used in Heathrow Airport for ease of functions
Get the inside scoop of the future innovations of the SAP BusinessObjects BI 4.3 platform: hybrid world, new BI Launchpad interface, simplified maintenance, as well as other exciting innovations.
What is the Power BI and learn the Power BI by self and this presentation contains some use full links which help us at time of developing the Power BI.
Power BI Tutorial For Beginners | Power BI Tutorial | Power BI Demo | Power B...Edureka!
( Power BI Training - https://www.edureka.co/power-bi-training )
This Edureka videoon "Power BI Tutorial" will provide you with the fundamental knowledge on Power BI (Blog: https://goo.gl/uFTDU3). Below are the topics covered in this tutorial:
1. Why do we need Business Intelligence?
2. What is Self Service Business Intelligence?
3. Why Power BI?
4. What is Power BI?
5. Demo: Report and Dashboard Creation
Presented to The Ottawa IT Community Meetup Group (Ottawa SQL - PASS Chapter) on Thursday September 19
Powerful Self-Service BI in Excel 2013 - Data search and discovery with Power Query (formerly "Data Explorer"), analyzing and modeling with Power Pivot, visualizing and exploring with Power View and Power Map (formerly codename "GeoFlow")
Power BI Full Course | Power BI Tutorial for Beginners | EdurekaEdureka!
YouTube Link: https://youtu.be/3u7MQz1EyPY
** Power BI Training - https://www.edureka.co/power-bi-training **
This Edureka PPT on "Power BI Full Course" will help you understand and learn Power BI in detail. This Power BI Tutorial is ideal for both beginners as well as professionals who want to master up their Power BI concepts.
Decoding SAP's BI Analytics SAP Statement of Direction Visual_BI
In Sep 2019, SAP announced its new BI & Analytics strategy and Statement of Direction. This webinar, from Visual BI, will dwell deep into this Statement of Direction, what this announcement means to you, it’s the potential impact to your landscape and existing investments, and how to plan your BI and Analytics Initiatives for 2020.
Get technically equipped to grow and build your Power BI (Business Intelligence) practice, enabling you to offer new solutions and services to customers. With Power BI, you can transform your customers' data into rich visuals they can collect and organize, helping them focus on what matters most to their businesses.
Slides for the Usergroup meeting for the Manchester Power BI User Group on June 27th, 2019.
Subject: Power BI for Developers about Power BI Embedded and Power BI Custom Visuals
Today, companies must react quickly to changing trends in the industry to spot and capitalize on new business opportunities. This calls for prompter decision-making, development cycles, and operations.
I am Murali.Below is a short summary on my professional experience,
Total years of experience - 13 (Releavant BO experience - 10 Years)
Technologies/Tools worked on : SAP BO 4.x - XI R2,BO Admin, Xcelsius Dashboard designing, Crystal Reports, SAP Design Studio, SAP BW 7,Unix,Oracle 10G PL/SQL, SQL Server and Microsoft Technologies(VB,ASP and VB.Net).
I am interested to take up new roles on different aspects in BO domain.
Overview SAP BO components, SAP BO Architecture, 16 reporting flavour of SAP BO,
More details: (blog: http://sandyclassic.wordpress.com ,
linkedin: https://www.linkedin.com/in/sandepsharma )
My Slidedeck about Common Data Service and Model. This technology is under development so content is subject to change and based on current service on 4/13/2018
Building Modern Data Platform with Microsoft AzureDmitry Anoshin
This presentation will cover Cloud history and Microsoft Azure Data Analytics capabilities. Moreover, it has a real-world example of DW modernization. Finally, we will check the alternative solution on Azure using Snowflake and Matillion ETL.
This presentation about Data Warehouse modernization and extending it to the modern data platform by adding Big Data solution using EMR and Spark and streaming data with Kinesis Firehose. In addition, it will cover the use case of complimentory data lake for data warehouse. Moreover, this presentation include ETL tool selection process and ML consideration.
This presentation was part of Mentoring program for HighTechU at CS Department of University of Victoria. This slides should help future engineers to understand value of data and help them think about data from beginning of any codding job.
Enterprise Data World 2018 - Building Cloud Self-Service Analytical SolutionDmitry Anoshin
This session will cover building the modern Data Warehouse by migration from the traditional DW platform into the cloud, using Amazon Redshift and Cloud ETL Matillion in order to provide Self-Service BI for the business audience. This topic will cover the technical migration path of DW with PL/SQL ETL to the Amazon Redshift via Matillion ETL, with a detailed comparison of modern ETL tools. Moreover, this talk will be focusing on working backward through the process, i.e. starting from the business audience and their needs that drive changes in the old DW. Finally, this talk will cover the idea of self-service BI, and the author will share a step-by-step plan for building an efficient self-service environment using modern BI platform Tableau.
AWS User Group: Building Cloud Analytics Solution with AWSDmitry Anoshin
Abebooks is one of Amazon Subsidiary and it treats data as an asset. It always looks the way to improve existing analytics solution and extract information from terabytes of data.
One of the recent initiatives was the migration from legacy DW platform to the AWS Redshift. During this journey, our data engineers met lots of challenges and sometimes tried to reinvent the wheel.
This talk will cover Abebooks journey towards Cloud DW. Moreover, we will cover the ETL tool selection process for the Cloud as well as the adoption process for the end users. This talk will help you understand the potential of the modern cloud DW and learn about our use case and save time for the future projects.
The Art of the Pitch: WordPress Relationships and SalesLaura Byrne
Clients don’t know what they don’t know. What web solutions are right for them? How does WordPress come into the picture? How do you make sure you understand scope and timeline? What do you do if sometime changes?
All these questions and more will be explored as we talk about matching clients’ needs with what your agency offers without pulling teeth or pulling your hair out. Practical tips, and strategies for successful relationship building that leads to closing the deal.
Neuro-symbolic is not enough, we need neuro-*semantic*Frank van Harmelen
Neuro-symbolic (NeSy) AI is on the rise. However, simply machine learning on just any symbolic structure is not sufficient to really harvest the gains of NeSy. These will only be gained when the symbolic structures have an actual semantics. I give an operational definition of semantics as “predictable inference”.
All of this illustrated with link prediction over knowledge graphs, but the argument is general.
JMeter webinar - integration with InfluxDB and GrafanaRTTS
Watch this recorded webinar about real-time monitoring of application performance. See how to integrate Apache JMeter, the open-source leader in performance testing, with InfluxDB, the open-source time-series database, and Grafana, the open-source analytics and visualization application.
In this webinar, we will review the benefits of leveraging InfluxDB and Grafana when executing load tests and demonstrate how these tools are used to visualize performance metrics.
Length: 30 minutes
Session Overview
-------------------------------------------
During this webinar, we will cover the following topics while demonstrating the integrations of JMeter, InfluxDB and Grafana:
- What out-of-the-box solutions are available for real-time monitoring JMeter tests?
- What are the benefits of integrating InfluxDB and Grafana into the load testing stack?
- Which features are provided by Grafana?
- Demonstration of InfluxDB and Grafana using a practice web application
To view the webinar recording, go to:
https://www.rttsweb.com/jmeter-integration-webinar
Elevating Tactical DDD Patterns Through Object CalisthenicsDorra BARTAGUIZ
After immersing yourself in the blue book and its red counterpart, attending DDD-focused conferences, and applying tactical patterns, you're left with a crucial question: How do I ensure my design is effective? Tactical patterns within Domain-Driven Design (DDD) serve as guiding principles for creating clear and manageable domain models. However, achieving success with these patterns requires additional guidance. Interestingly, we've observed that a set of constraints initially designed for training purposes remarkably aligns with effective pattern implementation, offering a more ‘mechanical’ approach. Let's explore together how Object Calisthenics can elevate the design of your tactical DDD patterns, offering concrete help for those venturing into DDD for the first time!
UiPath Test Automation using UiPath Test Suite series, part 4DianaGray10
Welcome to UiPath Test Automation using UiPath Test Suite series part 4. In this session, we will cover Test Manager overview along with SAP heatmap.
The UiPath Test Manager overview with SAP heatmap webinar offers a concise yet comprehensive exploration of the role of a Test Manager within SAP environments, coupled with the utilization of heatmaps for effective testing strategies.
Participants will gain insights into the responsibilities, challenges, and best practices associated with test management in SAP projects. Additionally, the webinar delves into the significance of heatmaps as a visual aid for identifying testing priorities, areas of risk, and resource allocation within SAP landscapes. Through this session, attendees can expect to enhance their understanding of test management principles while learning practical approaches to optimize testing processes in SAP environments using heatmap visualization techniques
What will you get from this session?
1. Insights into SAP testing best practices
2. Heatmap utilization for testing
3. Optimization of testing processes
4. Demo
Topics covered:
Execution from the test manager
Orchestrator execution result
Defect reporting
SAP heatmap example with demo
Speaker:
Deepak Rai, Automation Practice Lead, Boundaryless Group and UiPath MVP
Epistemic Interaction - tuning interfaces to provide information for AI supportAlan Dix
Paper presented at SYNERGY workshop at AVI 2024, Genoa, Italy. 3rd June 2024
https://alandix.com/academic/papers/synergy2024-epistemic/
As machine learning integrates deeper into human-computer interactions, the concept of epistemic interaction emerges, aiming to refine these interactions to enhance system adaptability. This approach encourages minor, intentional adjustments in user behaviour to enrich the data available for system learning. This paper introduces epistemic interaction within the context of human-system communication, illustrating how deliberate interaction design can improve system understanding and adaptation. Through concrete examples, we demonstrate the potential of epistemic interaction to significantly advance human-computer interaction by leveraging intuitive human communication strategies to inform system design and functionality, offering a novel pathway for enriching user-system engagements.
Encryption in Microsoft 365 - ExpertsLive Netherlands 2024Albert Hoitingh
In this session I delve into the encryption technology used in Microsoft 365 and Microsoft Purview. Including the concepts of Customer Key and Double Key Encryption.
Software Delivery At the Speed of AI: Inflectra Invests In AI-Powered QualityInflectra
In this insightful webinar, Inflectra explores how artificial intelligence (AI) is transforming software development and testing. Discover how AI-powered tools are revolutionizing every stage of the software development lifecycle (SDLC), from design and prototyping to testing, deployment, and monitoring.
Learn about:
• The Future of Testing: How AI is shifting testing towards verification, analysis, and higher-level skills, while reducing repetitive tasks.
• Test Automation: How AI-powered test case generation, optimization, and self-healing tests are making testing more efficient and effective.
• Visual Testing: Explore the emerging capabilities of AI in visual testing and how it's set to revolutionize UI verification.
• Inflectra's AI Solutions: See demonstrations of Inflectra's cutting-edge AI tools like the ChatGPT plugin and Azure Open AI platform, designed to streamline your testing process.
Whether you're a developer, tester, or QA professional, this webinar will give you valuable insights into how AI is shaping the future of software delivery.
Securing your Kubernetes cluster_ a step-by-step guide to success !KatiaHIMEUR1
Today, after several years of existence, an extremely active community and an ultra-dynamic ecosystem, Kubernetes has established itself as the de facto standard in container orchestration. Thanks to a wide range of managed services, it has never been so easy to set up a ready-to-use Kubernetes cluster.
However, this ease of use means that the subject of security in Kubernetes is often left for later, or even neglected. This exposes companies to significant risks.
In this talk, I'll show you step-by-step how to secure your Kubernetes cluster for greater peace of mind and reliability.
UiPath Test Automation using UiPath Test Suite series, part 3DianaGray10
Welcome to UiPath Test Automation using UiPath Test Suite series part 3. In this session, we will cover desktop automation along with UI automation.
Topics covered:
UI automation Introduction,
UI automation Sample
Desktop automation flow
Pradeep Chinnala, Senior Consultant Automation Developer @WonderBotz and UiPath MVP
Deepak Rai, Automation Practice Lead, Boundaryless Group and UiPath MVP
2. Agenda
1. SAP BusinessObjects 4.0 overview (information
from http://wiki.sdn.sap.com )
2. SAP BusinessObjects 4.0 Information Design Tool
new features in details
3. Example via Information Design Tool
2
10/23/2013
Footer
3. SAP BusinessObjects 4.0 overview
(information from http://wiki.sdn.sap.com )
3
10/23/2013
Footer
4. Nomenclature Changes
SNo
BO 3.1
BI 4.0
Business Objects
1
Business Objects Business Intelligence Platform
Enterprise
2 Infoview
BI Launch Pad
Business Objects Xcelsius
3
SAP Business Objects Dashboard Design
Platform
4 Universe Designer
Information Design Tools and Universe Design Tool
5 Crystal Reports 2008
Crystal Reports for Enterprise, Crystal Reports
2011
6 Business Objects Voyager Business Objects Analysis, Edition for OLAP
7 Dashboard Builder
8 Web Intelligence
10/23/2013
SAP Business Objects Interactive Analysis
9 Translation Manager
4
BI Workspaces
Translation Management Tool
Footer
5. Architecture
• 64-bit Architecture.
• Native support for 64-bit Operating System for BI 4.0
server side components.
• Allows handling large reports: no more 2 GB memory
limitation.
• 64-bit database middle-ware support.
• Java Application server utilizing 64-bit JDK’s (Java
Development Kit).
• Desktop products and client tools support Windows
32-bit and 64-bit OS platforms.
5
10/23/2013
Footer
6. What’s New in BI 4.0
• Common query interface across all reporting tools built in the
Information Design Tool.
• Many new features here including multiple data connection.
• Data Federation included.
• New abstraction layer for multi-dimensional data sources.
• Native multi-source support.
• Performance enhancements with engine update.
• Crystal Reports Enterprise – online report development based on
universes built /converted in Information Design Tool.
• Installs many ERP and Portal integrations by default – recommended
to only install what you need.
• Alert information through SAP Solution Manager support which can
connect to products like Tivoli.
• CMC monitoring of servers and thresholds related to their
performance.
• New Search Engine.
• LCM (Life Cycle Management) installed by default.
6
10/23/2013
Footer
8. Improvements
1. Universe can now be sourced from multiple datasources.
2. Universe can access from MOLAP (cubes from Microsoft Analysis
Services, Essbase, Mandroin etc.) datasources directly via MDX
without having to flatten them out. Prior version, Universe can access
only SQL source.
3. More common look and feel to understand BI products, including
Crystal, WebI, Explorer and BEx.
4. Universe can now be directly accessed by the Dashboards 4.0.
5. There is a tighter integration with BW via direct exposure of BW
metadata (BW query and Infoprovider) to all BO tools.
6. Four times better performance in BI/BW in terms of API’s (which
means BW can access BO in a much faster way).
7. Enhanced virtualization support.
8. Additional monitoring.
9. A re-written auditing back-end.
8
10/23/2013
Footer
9. BI Launch Pad
BI Launch pad provides an interface to the SAP Business
Objects Business Intelligence platform repository that enables
us to navigate to view and manage our business intelligence
documents. It is a web based application from which we can
access Crystal reports, Web Intelligence documents, and other
objects, and organize them to suit our preferences. Some of
the features in the BI launch pad are mentioned below.
• Usability and Look & Feel improvements.
• Quick and easy access recently viewed
reports, instances, alerts and BI tools.
• Tab based interface for easier navigation.
• Customization and personalization capabilities.
• Role based personalization.
• Simplified deployment with one WAR file.
• Improved user interface and additional options for interface
customization.
9
10/23/2013
Footer
11. Information Design Tool (IDT)
The new semantic layer introduced in the new BI 4.0 is the largest single
change. This semantic layer is called as Information Design Tool (IDT) which is
the replacement of Universe Designer of BO 3.x. The new semantic layer
includes elements from the old Data Federator product (which presumably no
longer exists) and allows a single universe to combine data from multiple
sources. However the the old Universe Designer is also made available in the
installation pack.
• The information design tool is the SAP BusinessObjects design environment
for creating and publishing new SAP Business Objects universes and
connections. IDT is used for new multi-source universes. The information
design tool lets you take advantage of these major new universe design
features:
• Dimensional universes that support OLAP dimensions and hierarchies.
• Multi-Source universes that federate multiple relational data sources.
• A design environment that facilitates designer teamwork and universe
resource sharing.
• A security editor for universe data and metadata.
• Extended connection management.
11
10/23/2013
Footer
12. Web Intelligence 4.0
Using Web Intelligence we can perform interactive analysis with SAP BusinessObjects
Web Intelligence by creating reports based on data we want to analyze. Some of the
changes made to the previous version and new features in the current version are
mentioned below.
• End to End Self-Service BI tool covering a range of users.
• Interoperability to various products in Business objects suit.
• Combine Data from different sources.
• Significant Productivity & Usability Improvements.
• Best in-class integration with SAP BW re-use report element across documents
(Charts, Tables, Queries, Variables).
• Re-purpose Web Intelligence tables as editable office content.
• Copy as a picture option.
• You can create a chart and associate dimensions and measures in Edit mode.
• New chart types such as Scatter Bubble, Polar Bubble, Dual Axes Charts, Tree
Maps for Hierarchical Data, Heat Maps, Box Plots, Series Pie Charts, Tag Clouds
are available in the new version.
• Semantic Layer in Web Intelligence.
• Data Federator/SQL Access to DSO's.
• Access Bex Queries via BICS (Business Intelligence Consumer Services) layer.
• Common query experience across all data sources.
• Navigate and report multidimensional data.
• 12
Improved scalability.
10/23/2013
Footer
14. SAP Business Objects Dashboard Design
• Scalability improvements allow dashboards to reach the masses. Dashboards
will now scale in a linear fashion.
• With BI 4.0 large scale, possible enterprise wide dashboard solution for
operational employees.
• Dashboard will be multi-lingual, that involves translated static text using
translation manager and number formatting.
• Dashboards product has been simplified so that excel can be bypassed.
• Integrates the next generation universe.
• New universe object browser that will enable to link directly universe query
result objects to visualization without the need to use the Excel spreadsheet.
• Query panel in Dashboards Designer.
• Direct binding of Universe objects to visualizations.
• Prompt selector to leverage prompt defined in Universe.
• Separation of roles between data experts and dashboard authors.
• Consistent access to data between clients and across sources.
• One abstraction layer for all data sources.
• Support of BW & third part OLAP-based Universes planned for SBOP 4.1
release.
14
10/23/2013
Footer
15. End of Lives in BI 4.0
• Performance Manager
• Desktop Intelligence
• Import Wizard
New Applications in XI 4.0:
• Upgrade management tool
The Upgrade management tool is a new software component that lets you upgrade the content
of your BI repository from a previous version of SAP BusinessObjects Enterprise.You can
perform a complete upgrade or an incremental upgrade. A complete upgrade replaces the
functionality that had previously existed in the Central Configuration Manager (CCM). The
incremental upgrade replaces the functionality that had previously existed in the Import Wizard.
To migrate the content of a BI repository to another repository with the same version, use the
LifecycleManagement Console.
• Monitoring
Monitoring is a new tool in SAP BusinessObjects Enterprise XI 4.0. This application provides the
ability to capture the runtime and historical metrics of SAP BusinessObjects Enterprise XI 4.0
servers and applications, for reporting and notification. System administrators can use the tool
to identify if a reporting application is functioning normally and if the response times are as
expected.
• The information design tool (IDT)
The information design tool is the SAP BusinessObjects design environment for creating and
publishingnew SAP BusinessObjects universes and connections. IDT is used for new
15
10/23/2013
Footer
multisource universes.
16. Deployment Changes
• Similar deployment topology.
• Native 64bit application. Still able to connect to 32bit data source drivers if
needed.
• Default deployment is MS SQL Server 2008 and Tomcat 64bit.
• New Paths for the web applications. The application build is very different.
Full SDK not available until 4.1.
• CMC and BI Launch Pad are a single application.
• Wdeploy GUI – to help deployment and removal of web applications
• LifeCycle Manager (LCM) automatically deployed and Import Wizard is no
longer available. All report promotion through this tool.
• Upgrade Management Tool – Complete or incremental content move is
available.
• Migrate from XIR2, XI3.0 or XI3.1.
• Client tools are separate and are not included in the server installation.
16
10/23/2013
Footer
18. DATA FOUNDATION
Right Click – New Derived Tables
Now you can create a derived table just
with a right click.
Right Click – Replace By
You can now very easily replace a table
with new ‘database table’.
Tables Merge
In many cases, to combine 2 or more
tables to reduce clutter or to apply
business logic that is achieved by joining
the multiple tables.
18
10/23/2013
Footer
19. DATA FOUNDATION cont
Change Table Behavior
Right click menu provides options to ‘Edit’ table names, field types and
even length. This option also lets you hide/unhide fields.
Select Related Tables
With multiple selections you would be able
to see all the relations in complex
universes.
Insert Calculated Columns
To create one simple right click on the table
and select ‘Insert Calculated Column
19
10/23/2013
Footer
21. BUSINESS VIEW
Object Properties
The object qualification to make it
‘Deprecated’
Check Integrity Panel
Check Integrity Panel has mane new
options.
21
10/23/2013
Footer
22. BUSINESS VIEW end
Security Editor
It provides a nice interface to apply security
both at the Data Foundation and the
Business View layers.
Data Security Profile allows to apply security at:
·
Connection – ability to define replacement connection
·
Controls – execution time, rows returns etc.
·
SQL – use of sub queries, multiple queries etc.
·
Rows – classic row level security using ‘where’ clause
·
Table – ability to define replacement table
Others
• Define Optional Prompt in the universe
itself.
• Define Static LOVs in the universe
22
10/23/2013
Footer
23. BUSINESS VIEW cont
Business Security Profile allows to apply security at:
·
Create Query – ability to grant or restrict access
to ‘views’ defined in the business view layer and ability
to restrict objects in the business view layer
·
Display Data – ability to grant or restrict access to
data from different objects defined in the business view
·
Filters – ability to create filters on the objects and
selectively apply them to the profile
23
10/23/2013
Footer
25. Intro
We are going to create Universe via Information Design Tool. For this purpose we
will use:
• SAP BusinessObjects 4.0
• MS SQL Server 2008
• Sample MS database AdvantureWorks with appropriate ODBC
For this exercise you must have following skills:
• You are familiar with Business Objects 3.1 or 2 and Universe Designer tool
25
10/23/2013
Footer
26. Exercise page 1
1. Open the Information Design Tool.
2. Click the New icon in the toolbar. Then choose Project.
3. Type a name for the project and click Finish.
26
10/23/2013
Footer
27. Exercise page 2
4. Click Windows > Repository Resources.
5. Click the green + icon and select Insert Session.
6. Type in the connection information to
connect to your CMS.
7. Click OK.
27
10/23/2013
Footer
28. Exercise page 3
8 . Right click on the Connections
folder and select Insert Relational Connection.
9. Type a name for the connection and
click Next..
28
10/23/2013
Footer
29. Exercise page 4
10. Select the appropriate driver from the
list and click Next.
11. Enter the parameters for the data
source connection.
12. Click Finish.
29
10/23/2013
Footer
30. Exercise page 5
13. In the Repository Resources pane, expand the Connections folder.
14. Right click on the connection you just created and select Create
Relational Connection Shortcut.
15. Select the project that you created earlier
and click OK. This creates a shortcut that your
project will use to connect to the connection.
16. Click Close to the popup message.
17. If the projects pane isn't already open, click
Window > Local Projects.
18. You should see your project in the list.
Expand it, and you should see the shortcut to
the connection which you have created in the
repository.
30
10/23/2013
Footer
31. Exercise page 6
19. Right click the project name and select
New > Data Foundation.
20. Type a name for the data foundation in
the Resource Name field.
21. Click Next
31
10/23/2013
Footer
32. Exercise page 7
22. Select Multisource-Enabled.
23. Click Next.
24. You will be asked to select/connect o your
repository. Type in the required credentials
and click Connect.
25. Click Next.
32
10/23/2013
Footer
33. Exercise page 8
26. Select the connection shortcut that you
would like to use and click Next.
27.Leave the defaults on the next page
and click Finish.
33
10/23/2013
Footer
34. Exercise page 9
28. Next you will create your schema. Drag
tables onto the canvas and create the
joins.
34
10/23/2013
Footer
35. Exercise page 10
29. Right click your project and select New
> Business Layer.
30. Select Relational Data Source and
click Next.
35
10/23/2013
Footer
36. Exercise page 11
31. Type a name for the business layer in
the Resource Name field.
32. Click Next.
33 .Click the ellipsis next to
the Data foundation.
36
10/23/2013
Footer
37. Exercise page 12
34. Select the data foundation that you've
created and click OK.
35. Select Automatically create classes
and objects for all connections tick-box
and click Finish.
37
10/23/2013
Footer
38. Exercise page 13
36. Right click on the business layer, select
Publish > To a Repository…
37. Click Check All, then the Check
Integrity button.
38
10/23/2013
Footer
39. Exercise page 14 (end)
38. In BI 4.0 SP01you will see lots of red
crosses in the list down the left.
39. Click Next.
40 .Click Fnish.
41. Click Close.
Now we can create report based on new Universe via Web Intelligence or BI launch
Pad.
39
10/23/2013
Footer