SAP Business Objects Universe Designer & Introduction to Business Intelligenc...BigClasses Com
Universe is a middle layer between the database and reports that includes only required table structures to avoid burdening the database. It can generate multiple reports from a single universe. Changes to the database will impact the universe and reports, while changes to the universe only impact reports, not the database. The new release of SAP Business Objects BI 4.0 introduces native connectivity to SAP BW and SAP HANA via BICS connections for Web Intelligence reporting.
The document discusses new features in SAP BusinessObjects 4.0, with a focus on the Information Design Tool. Key points include:
- The Information Design Tool (IDT) is the new semantic layer for SAP BusinessObjects and replaces the Universe Designer. It allows for multi-source universes that can connect to multiple data sources.
- New features of the IDT include the ability to create derived tables directly from the interface, replace tables easily, and merge multiple tables. Dimensional and OLAP support is also improved.
- SAP BusinessObjects 4.0 offers improvements like 64-bit architecture, increased performance, new applications like the Upgrade Management Tool, and changes to the deployment
The document provides an overview of SAP Webi (Web Intelligence) reporting tools. It describes the history and architecture of Webi, how to create reports using various data sources, and how to use features like filters, formulas, and sending reports to other users. The document also discusses related tools like the Business Explorer (BEx) for strategic analysis and query functions.
The document discusses the architecture of Oracle Business Intelligence (OBIEE). It describes the key components including the BI Server, BI Scheduler, Repository, and data sources. It explains how queries from clients are processed, cached, and passed to underlying databases. It also covers security approaches like data level security and object level security. Repository (.rpd) files are described as containing all metadata and security rules to define OBIEE solutions. Approaches to OLAP like ROLAP, MOLAP, and hybrid OLAP are also summarized.
El documento presenta Oracle Application Express (APEX), una herramienta de desarrollo de aplicaciones web centradas en la base de datos Oracle. Explica su arquitectura, funcionalidades clave como informes interactivos y websheets, y novedades en la versión 4.0 como servicios web RESTful y desarrollo colaborativo. También cubre temas como la consolidación de datos y aplicaciones en la base de datos y la migración desde Microsoft Access.
The document provides best practices for using SAP Business Objects with Teradata databases. It discusses ODBC setup, universe design considerations, and leveraging Teradata features within Business Objects. Specific topics covered include using the appropriate ODBC version, setting connection properties, avoiding character set errors, utilizing Teradata functions, and designing universes for standard versus ad-hoc reporting. The goal is to optimize performance and flexibility when using Business Objects with Teradata.
JBoss Application Server 7 provides a more manageable and performant platform compared to previous versions. It features two operational modes: standalone for development and domain for managing multiple servers. The domain mode uses separate processes for the process controller, host controller, and server instances which allows for centralized management of the servers.
Power bi overview of static row level securityManishK55
This document provides an overview of row level security in Power BI. It discusses creating roles in Power BI Desktop to apply static row level security through DAX filters on tables to restrict what data salespeople from different countries can see. It also covers how to validate these rules in Power BI Desktop and how to add and test users with these roles in the Power BI service.
Power BI Consultants | Power BI Solutions | Power BI ServiceAdmin iLink
Power BI is a suite of business analytics tools to analyze data & share insights. Get expert guidance from these certified Power BI consultants & partners.
1) The document discusses Oracle Identity Governance and Access Management projects for several clients, including integrating numerous applications with OIM and implementing ESSO.
2) It provides an overview of integrating applications with OIM using connectors and protecting web applications using OAM with WebGates deployed.
3) Finally, it outlines different deployment approaches for OAM including agent-based, agent-less, using a terminal server as a gateway, and a hybrid approach combining methods.
This document provides information about SAP BW modeling training including the schedule, terminology, modeling concepts, and data flow. It outlines a 5-day training schedule from May 19-23, 2014 with different sessions each day led by various trainers. It defines common BW terminology and concepts such as InfoObjects, InfoCubes, DSOs, characteristics, and key figures. It describes the purpose of data modeling in BW and provides examples of data flow and the use of process chains.
Microsoft deployment toolkit (install and use)ﻣﺤﻤﺪ ﺍﻟﺤﻤﻴﺪﻱ
Microsoft Deployment Toolkit (MDT) is a collection of tools used to automate and standardize operating system deployments across physical and virtual servers. It is used with the Microsoft Assessment and Deployment Kit (ADK) to create a reference image of Windows Server 2016. The document provides step-by-step instructions for installing MDT and ADK, creating an MDT deployment share, importing Windows Server 2016, configuring the task sequence, and building the reference image.
This document provides an overview of Oracle BIEE (Business Intelligence Enterprise Edition) including its components, advantages, architecture, and features. It discusses Oracle BIEE Answers and interactive dashboards. Key components include Oracle BI Client, Presentation Services, Server, Repository, Scheduler, Answers, and Interactive Dashboards. Benefits include simplified report production, insights, and a single version of truth. The presentation concludes with information on iWare Logic's Oracle BIEE services.
This document provides an overview of Power BI, including:
- Power BI is a business analytics tool from Microsoft that allows users to visualize, analyze, and share insights from data.
- It offers desktop, service, and mobile platforms. The desktop application allows local data preparation, while the service enables cloud-based sharing of reports and dashboards.
- The document walks through an example of connecting to sample GDP data, cleaning and preparing the data with Power Query, building visualizations with charts and maps, and publishing a report to the Power BI cloud service.
Intoduction of FIrebase Realtime DatabaseSahil Maiyani
Expalin one of NoSql database used in industry to develop web and mobile applications. Firebase Realtime Database is Nosql kind of database which is efficiently accessed without writing web service API. This presentation also covers how we can make well structured NoSql database.
Hariharan Rajendran gave a presentation on Power BI to CPBIG. He discussed Power BI's products and services, pricing, data modeling capabilities, and security features. Power BI is a cloud-based data analysis tool that allows interactive visualization of data from a wide range of sources. It includes Power BI Service, Power BI Desktop, and mobile apps. Data can be imported or queried directly from sources. Power BI offers both free and paid Pro subscriptions.
1. The document provides steps to model HANA views into SAP BW 7.4 as transient, composite, and virtual providers and then report on the modeled data.
2. It describes extracting source data from flat files using BO data services and from SAP systems using LO extraction. The extracted data is loaded into HANA views and BW objects are modeled on them.
3. The key steps include creating HANA views, modeling them as transient, composite, and virtual providers in BW, building BEx queries on the providers, and reporting in Web Intelligence. This allows leveraging HANA for optimized performance of BW applications.
Introduction to Power BI to make smart decisionsVIVEK GURURANI
Power BI: Business intelligence like never before!
Power BI is a tool that allows accounting and finance managers and professionals to have relevant information at the right time to make strategic decisions in a flexible, centralized, and secure way. Transform your business with predictive analytics, data visualization, and information in real-time, thanks to Power BI.
Presentation Agenda:
1. Introduction to Power BI
2. Why would your business need Power BI?
3. Power BI Architecture
4. Data Sanitization & Cleansing Capabilities
5. Analytical Insights
6. Generating Department Wise Reports & Visualizations
7. Latest & Upcoming Power BI features
8. Live Q&A
INTRODUCTION TO MICROSOFT POWER BI.pdfssusera4419c
This document provides an introduction and overview of Microsoft Power BI. It discusses what Power BI is, its key features and tools, who should use it, and its basic building blocks. Power BI is a suite of business analytics tools that brings data to life through interactive visualizations and dashboards. It allows users to analyze and share insights from data stored in various sources. The document outlines the Power BI tools, including the desktop app, online service, mobile apps, and gateway. It also describes how to get started with Power BI through installation, signup, and subscription processes.
Power BI - Row Level Security - 3 Pillars : Users,Rules,Roles.
Provides summary about roles granted to specific users based on certain set of rules to prevent multiple creation of reports each time and maintain confidentiality.
DB2 is a relational database developed by IBM that supports SQL and the relational model. It has various editions including Advanced Enterprise Server Edition and Express Edition. DB2 uses a multi-tier architecture with components like SSAS, DBAS, and IRLM. It manages data through logical objects like tables and physical objects like tablespaces and databases. Tables are stored in tablespaces which are contained within databases. DB2 supports data types, null values, indexes, and referential integrity through primary keys, unique keys, and foreign keys to link tables.
The document provides an introduction to JBoss Application Server, including its history, architecture, components, installation process, directory structure, and how to start and stop the server. It also discusses the JBoss Administration Console and JMX Console for managing and monitoring the application server.
WSO2Con2011: Using WSO2 ESB with SAP ERP (Retail)WSO2
The document discusses using WSO2 ESB to integrate SAP ERP with KeellsSuper, a leading supermarket chain in Sri Lanka. It provides background on John Keells Group, which implemented SAP across its subsidiaries, and on KeellsSuper's business requirements to migrate to SAP's retail industry solution. The solutions evaluated for integration included SAP PI, direct RFC/BAPI calls, and file uploads. The recommended and implemented solution was to use WSO2 ESB for its lightweight integration capabilities to streamline the SAP and POS integration and eliminate performance issues.
DB2 is a relational database management system that runs on IBM mainframes. It uses SQL for data manipulation and definition. A COBOL program can use DB2 services by including host variables, a SQL communication area, and SQL statements. DB2 has major components including system services, locking services, database services, and distributed data facility. The database services component handles tasks like precompiling, binding, running SQL statements, data management, and buffer management.
SAP Business Objects 4.0 (SP02)
Information Design Tool (Universe Designer)
Creating Business Layer
Creating Folders/Classes and Objects in BLX layer
Creating Queries to Test
This document provides a tutorial on Web Intelligence, which is a tool for analyzing and reporting on business data. The tutorial covers topics such as creating reports, enhancing reports with features like breaks, filters, and alerts, formatting reports, and synchronizing multiple data sources. Web Intelligence allows users to analyze data and create customizable reports for sharing insights.
The document discusses adding restrictions and derived tables in SAP BusinessObjects Information Design Tool (IDT). It describes how to add business and data restrictions by creating security profiles and defining WHERE clauses. It also explains how to create a derived table by writing an SQL expression to combine columns from multiple tables, then deleting the original tables and creating joins with the derived table. The goal of derived tables is to reduce the weight of the universe by replacing multiple tables with a single lighter table.
System modeling techniques are used during requirements engineering and design to represent different perspectives of a system. Context models show the system and its environment, while process models illustrate system processes. Behavioral models include data flow diagrams for data processing and state machine diagrams for event-driven behavior. Semantic data models describe logical data structures. Object models represent system entities and relationships. CASE tools support creating and analyzing various system models during development. Prototyping, through evolutionary or throw-away approaches, helps validate requirements by allowing users to interact with early versions of the system. Rapid prototyping techniques include visual programming and reusing components.
Sap bo-universe-design-beginner-s-guide-part-iAmit Sharma
The document provides instructions for getting started with SAP BO 4.1 using the Information Design Tool. It includes steps to create a project, connect to a database to build a universe, insert tables and create joins in the data foundation layer, build the business layer, and create folders, classes and objects. The summary steps are:
1. Create a project and connect to a database to build the data source connections.
2. Create a data foundation layer and insert tables from the connections, detecting keys and joins.
3. Build the business layer associated with the data foundation tables and folders.
4. Create folders, classes and objects (dimensions, measures, attributes) within the business layer structure.
CS554 � Introduction to Rational RoseJignesh Patel
Rational Rose is a visual modeling tool that allows users to graphically represent different views of a software system using diagrams. The document introduces various diagram types in Rational Rose, including use case diagrams, class diagrams, sequence diagrams, collaboration diagrams, activity diagrams, component diagrams, deployment diagrams, and statechart diagrams. Each diagram type shows a different perspective and can be used at different stages of the software development process to help with requirements, design, and communication.
This document provides an overview of the system development life cycle (SDLC) and object-oriented analysis and design. It discusses the four main phases of the SDLC - planning, analysis, design, and implementation. Within each phase, common techniques and deliverables are described, such as creating use case diagrams and class diagrams during analysis, and designing system architecture and user interfaces during design. Object-oriented concepts like classes, objects, and relationships are also explained.
This document provides an introduction to Web Intelligence, an SAP Business Objects tool for creating reports from data. It outlines the basics of Web Intelligence, including documents and queries, data restrictions using query filters, report creation and enhancement, formulas and variables, synchronizing multiple data sources, and data analysis and report management. Query filters allow restricting the data obtained from a query based on business requirements and can be predefined, single or multi-value, prompted, or complex using multiple filters joined with logical conditions.
This document provides an introduction to structural and use case modeling using the Unified Modeling Language (UML). It defines structural modeling as emphasizing the structure of objects, including their classifiers, relationships, attributes and operations. Use case modeling partitions system functionality into meaningful transactions ("use cases") between users ("actors") and the system. The document then reviews the core concepts and diagram types for both structural and use case modeling in UML.
In this tutorial, we learn to access MySQL database from R using the RMySQL package. The tutorial covers everything from creating tables, appending data to removing tables from the database.
This document outlines the details of an airport management system project for a database management systems course. It includes the group members, instructor, table of contents, and overview of key aspects of setting up the database system. The document describes the entities, attributes, and relationships that will be modeled in the database using an entity-relationship diagram. It also discusses how SQL will be used to perform queries on the database.
This document provides an overview of a Linked Data tutorial presented on March 6, 2009. The tutorial covered topics such as the motivation for Linked Open Data, relevant technologies like URIs, RDF, and SPARQL, and principles for publishing and interlinking data on the web in a way that is accessible to both humans and machines. The goal of Linked Data is to open up data silos and make public data available on the web in a standardized format.
This document provides an overview of a project done by Group 4. It lists the 15 project members by their student IDs. The contents section outlines the topics to be covered in the project report, including introductions to UML, an overview of UML diagrams, modeling techniques such as use cases, class diagrams, state diagrams and more. Relational database design is also mentioned as a UML extension that will be covered.
analysis and design of information systemRenu Sharma
Information systems analysis and design involves developing and maintaining computer-based information systems through a system development life cycle (SDLC) with phases like planning, analysis, design, implementation, and maintenance. Analysis involves breaking down a system to understand its components and functionality, while design creates a blueprint for how the system will be developed based on requirements. Key concepts in analysis and design include requirement analysis, abstraction, refinement, modularity, and tools like data flow diagrams and data dictionaries.
Personas, Scenarios, User Stories, Use Cases (IxDworks.com)Valeria Gasik
This document discusses user-centered design approaches like personas, scenarios, and user stories. It provides templates and examples for creating a persona profile with background, goals, and mapping. Scenarios are described as stories that illustrate user interactions and goals. User stories are goals the user wants to accomplish with the product in a simple format, while use cases describe step-by-step processes. The document advises creating these artifacts based on research to understand users and explore design solutions from their perspective.
This document provides an overview of Web Intelligence, an SAP Business Objects tool for analyzing and reporting on data. It discusses topics like documents and queries, data restrictions, creating reports, enhancing reports, formulas and variables, synchronizing multiple data sources, and analyzing and managing reports. The document also provides examples of using formulas and variables in reports as well as conditionally hiding columns using dynamic visibility.
This document provides instructions on creating BI workspaces and modules in SAP BusinessObjects BI. It outlines prerequisites for creating BI workspaces, including having access to applications in BI launch pad and permissions to create folders. The tutorial then describes creating modules using Dashboard Design models and Web Intelligence documents. It provides a scenario of creating a corporate BI workspace with tabs, subtabs, and linked modules for sharing sales data. Lessons cover creating BI workspaces and folders, adding tabs and modules, and linking content between different module types.
This document provides an overview of a training on Microsoft Power BI. It introduces Power BI as a business intelligence tool consisting of three core applications: connecting to data sources, data preparation and analysis, and visualization and collaboration. It outlines the key topics that will be covered in the training, including connecting and transforming data in Power BI Desktop, data modeling, analyzing data with DAX calculations, visualizing and formatting data, filters, and refreshing and scheduling reports in Power BI Service. The training will cover the components and building blocks of Power BI, how to use the Power BI Desktop interface, and include hands-on exercises for working with data, creating reports and dashboards, and publishing to Power BI Service.
This document provides a preview of new and enhanced features for SAP BusinessObjects BI 4.3 SP04. Key highlights include:
1) Improvements to the user experience with enhancements to charts, functions, prompts, and the continuous optimization of the user interface.
2) Delivery of top customer-requested features such as hiding empty columns dynamically and improved intra-document linking capabilities.
3) Extension of existing features such as additional enhancements for Crystal Reports, improvements to data modeling in Web Intelligence, and better support for OData services from Web Intelligence documents.
The document notes that all information provided is preliminary and subject to change by SAP.
The document provides a beginner's guide to Web Intelligence, which is a tool for designing reports from business data. It discusses topics like documents and queries, data restrictions, creating reports, enhancing reports, formulas and variables, synchronizing multiple data sources, and analyzing data. The document also describes how to design Web Intelligence reports by adding different types of tables, charts, and other elements to organize and visualize information from a data source. Reports can be saved inside documents and modified later on.
This document discusses migrating from Oracle Discoverer to Oracle Business Intelligence Enterprise Edition (OBIEE). It outlines the current Discoverer architecture, the proposed OBIEE architecture, and the three-step conversion approach of: 1) converting the end user layer to the OBIEE repository model, 2) migrating workbooks, and 3) configuring security. It notes that the data model may need changes after migration if it does not represent star schemas as required by OBIEE. The discussion points out that OBIEE lacks native OLAP cube access, user interface features of Discoverer like drill up wizards, and report creation wizards.
The document summarizes several new features in SAP BW 7.4 on HANA including:
- Advanced DSOs, which replace previous object types with one modeling object that can be configured for different uses.
- Composite providers, which allow joining data from multiple sources for reporting.
- Open ODS views, which enable flexible integration of external data sources without traditional modeling.
- SLT sources for efficient real-time data replication from SAP and non-SAP systems.
- The HANA analysis process for running HANA-native functions directly on BW data.
- BW workspaces for agile modeling at local levels.
The document outlines a 6-step process for database design using MySQL:
1. Define the purpose of the database and applications that will use it.
2. Determine the necessary tables to organize information.
3. Determine the fields for each table to store desired information and choose data types.
4. Determine relationships between tables by identifying which fields relate to primary keys in other tables.
5. Create a diagram of the database schema using software.
6. Refine the design if needed by reviewing for any additions, changes, or errors.
This document provides instructions for building an InfoCube using only the Business Warehouse Accelerator (BWA) to improve query performance. It advises running a data transfer process (DTP) frequently from the DataStore Object (DSO) to the BWA-only InfoCube after each new data load to keep the cube as up-to-date as possible in memory for fast queries. Regular DSO loads require an automated process chain to trigger the DTP, and the DTP should run after every DSO request to ensure the cube reflects the latest DSO data.
The document outlines a Business Intelligence course that focuses on data visualization and analysis using tools like Excel and Power BI. The course objectives are to teach students the fundamentals of business intelligence, how to visualize data for storytelling, create interactive charts and graphs using Power BI, and arrange data into actionable insights. The course covers topics like business intelligence concepts, data visualization with Excel, data transformation in Power BI, using DAX for calculations, different visualization types in Power BI, and creating dashboards. The intended outcomes are for students to understand and apply business intelligence, create compelling visualizations, integrate data from multiple sources, and perform analysis and calculations in Power BI.
This document discusses partitioning in OBIEE 11g to improve query performance. It describes three types of partitioning: fact-based partitioning which stores data in separate tables by dimension like year; level-based partitioning which stores aggregated data at different levels in separate tables; and value-based partitioning which splits data into tables by column values. It provides steps for creating requests against partitioned data, including importing metadata, creating physical joins, mapping sources, and checking the results and query logs.
The document provides instructions for creating an OBIEE data model with a SQL query data set in Oracle BI Publisher 11g. Key steps include:
1. Defining a JDBC connection to an Oracle database.
2. Creating a SQL query data set that joins the DEPARTMENTS and EMPLOYEES tables, defines a parameter on the DEPARTMENT_NAME column, and specifies column aliases.
3. Creating a list of values (LOV) for the parameter using a SQL query on the DEPARTMENTS table.
4. Setting properties of the parameter to use the LOV and allow multiple selection.
This document discusses business intelligence (BI) solutions for Office 365. It begins by outlining the requirements for BI in Office 365, then describes several BI solutions including PerformancePoint Services, Visio Services, Power BI, Excel Services, and SQL Server Reporting Services. It focuses on self-service BI with Excel 2013 and Power BI for Office 365, providing demos of their features. Finally, it concludes by comparing Excel, advanced Excel BI, Excel Services, and Power BI for Office 365 and their uses.
This document describes how to use the QuickViewer tool in SAP BI to compare large amounts of data between different database tables, including ODS tables and custom tables. The QuickViewer allows joining multiple tables to compare matching and non-matching records without using external tools like Excel. It provides selection screens to filter the output and only view unmatched records. Some limitations are it requires a common key between tables and works best with a considerable amount of data.
This document provides an overview of a 70+ hour video-based training course on SAP BI/BW concepts. The training covers topics like SAP BI/BW architecture, data modeling, extraction, transformation and loading of data, reporting, and more. Students can learn the concepts through video tutorials at their own pace from home. The cost of the training is much lower than other options like online courses or training institutes. Sample videos are provided so potential students can view the style and quality of the video lessons.
This document outlines the course content for a Tableau certification training program. The 13-module course covers topics such as Tableau architecture, dashboards, data visualization, data blending, mapping, calculations, parameters, and integrating Tableau with R. Students will learn various chart types, data preparation techniques, and how to build interactive dashboards and stories. Hands-on exercises are included to help students practice the skills learned. There are no prerequisites for taking the course.
Introduction to OBIEE Metadata
Use of Administration Tool
Concepts of Physical Layer
Concepts of Business Model and Mapping Layer
Concepts of Presentation Layer
Building of these 3 layers
The document provides information about the testing phase of database system development. In this phase, system developers and users test the database to ensure it is functioning correctly and free of errors. Key aspects of testing include entering test data, validating that database objects like tables, queries, forms and reports are working as intended, and testing overall system functionality. The goal of testing is to identify any issues and ensure the quality of the database before it is implemented.
Similar to Information Design Tool -Tutorial4 (20)
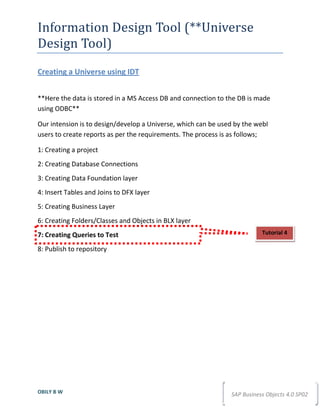
1. Information Design Tool (**Universe
Design Tool)
Creating a Universe using IDT
**Here the data is stored in a MS Access DB and connection to the DB is made
using ODBC**
Our intension is to design/develop a Universe, which can be used by the webI
users to create reports as per the requirements. The process is as follows;
1: Creating a project
2: Creating Database Connections
3: Creating Data Foundation layer
4: Insert Tables and Joins to DFX layer
5: Creating Business Layer
6: Creating Folders/Classes and Objects in BLX layer
7: Creating Queries to Test Tutorial 4
8: Publish to repository
OBILY B W SAP Business Objects 4.0 SP02
2. INFORMATION DESIGN TOOL TUTORIAL 4
Delegate Measures
Consider the tables below
Average cannot easily be projected because the source data could be much
skewed. Even with a very small data set the results of an average projection can
be wrong.
A designer cannot predict the unintentional wrong values during projection. This
is where the delegation process comes in. Instead of using Average function for
calculation we use the database delegated option.
If we use this delegated measure in webI for queries, the average calculation is
not done by webI rich client, instead the document will retrieve the calculated
results from the database directly. As the database has access to the detailed
data, the result will be based on a weighted average.
OBILY B W
SAP Business Objects 4.0 SP02
3. INFORMATION DESIGN TOOL TUTORIAL 4
Loops
This happens in universe schema during design and not in database layer.
The above table Country is used as a lookup for Showroom-Country and same
time lookup for Region-Country, from Client Table. Hence the data is returned
only when Showroom Country = Client Country. And the resulted table will have
only the revenue generated by US clients in the US showrooms and UK clients in
the UK showroom. So the result won’t include all the intended values and return
fewer rows from actual.
We can resolve loops using either of the two methods,
OBILY B W
SAP Business Objects 4.0 SP02
4. INFORMATION DESIGN TOOL TUTORIAL 4
Aliases
It breaks the loop by using the same table twice in the query. One table can
be called as the alias of other. It will only act as different name to the same
base table.
Contexts
The loop is resolved by defining a specific path through tables in a loop. It
ensures that joins are not included from different paths within the same
SQL query.
Resolve loops using Alias
To insert the Alias, Select the table and select Alias from the right click menu
OBILY B W
SAP Business Objects 4.0 SP02
5. INFORMATION DESIGN TOOL TUTORIAL 4
Make the original table free from all joins using aliases
OBILY B W
SAP Business Objects 4.0 SP02
6. INFORMATION DESIGN TOOL TUTORIAL 4
Resolve loops using Contexts
Contexts resolve a loop by defining a join path. Contexts are used where there are
multiple fact tables sharing lookup tables.
OBILY B W
SAP Business Objects 4.0 SP02
8. INFORMATION DESIGN TOOL TUTORIAL 4
Predefined filters
One can add filters in Business layer similar to dimension and measures
OBILY B W
SAP Business Objects 4.0 SP02