Downloaded 10 times


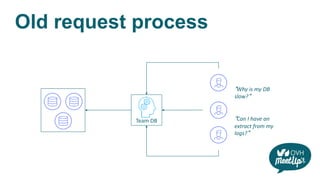

![DBMS Configuration
PostgreSQL
• Everything happens in postgresql.conf
• Format log to produce report
• log_line_prefix = '%t [%p]: [%l-1] db=%d,user=%u,app=%a,client=%h '
• Log slow queries
• log_min_duration_statement = '1000'](https://image.slidesharecdn.com/observabilitysql-190329133534/85/Improve-your-SQL-workload-with-observability-17-320.jpg)

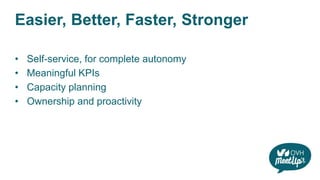
![Let’s grok
# User@Host: app_user @ [1.2.3.4]
^# User@Host:
%{WORD:query_user}s*@s*[%{IP:query_ip}?].*
{
"query_user": "app_user",
"query_ip": "1.2.3.4"
}](https://image.slidesharecdn.com/observabilitysql-190329133534/85/Improve-your-SQL-workload-with-observability-24-320.jpg)

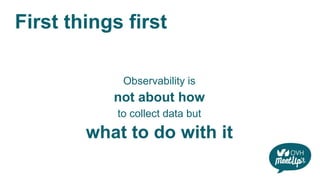
![Filebeat
# /etc/filebeat /filebeat.yml
output.logstash:
hosts: ["graX.logs.ovh.com:6514"]
ssl.certificate_authorities: ["/etc/filebeat/cert.pem"]
filebeat.prospectors:
- type: log
enabled: true
paths:
- /var/log/postgresql/postgresql.log](https://image.slidesharecdn.com/observabilitysql-190329133534/85/Improve-your-SQL-workload-with-observability-26-320.jpg)


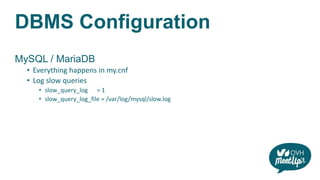
![Let’s push some metrics
# /etc/telegraf/telegraf.conf
[agent]
interval = "30s"
flush_interval = "30s"
[[outputs.influxdb]]
urls = ["https://influxdb.graXXX.metrics.ovh.net"]
timeout = "15s"
username = "telegraf"
password = "write.token.from.metrics.manager"](https://image.slidesharecdn.com/observabilitysql-190329133534/85/Improve-your-SQL-workload-with-observability-34-320.jpg)
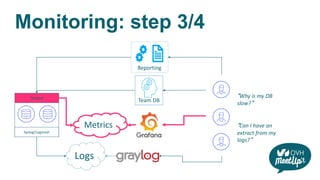
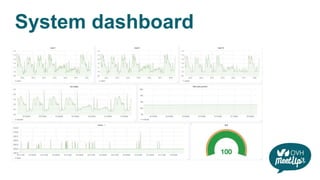
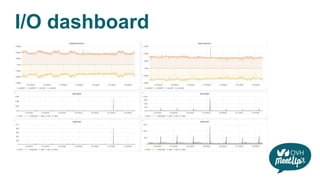
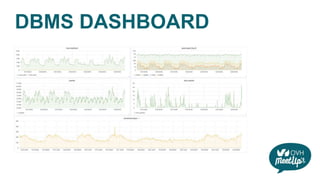

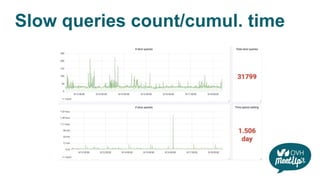
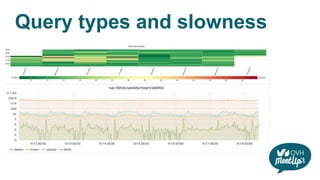
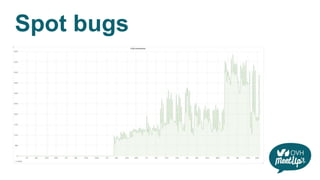
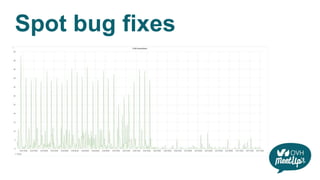


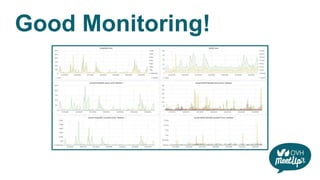
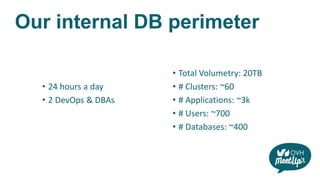
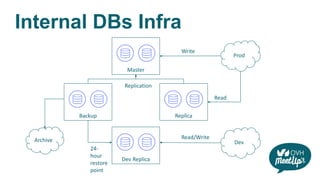
The document discusses strategies to improve SQL workload observability at OVH, focusing on efficient monitoring and reporting of database performance. It highlights the challenges faced by teams with slow database responses and emphasizes the importance of metrics, logging, and effective tools like Grafana and Graylog. The document also outlines the necessary configurations for PostgreSQL and MySQL, advocating for a self-service approach to database management and troubleshooting.