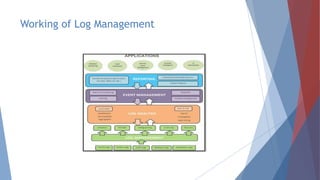
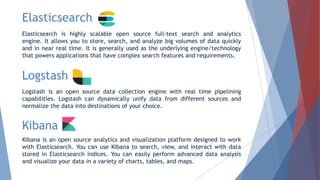
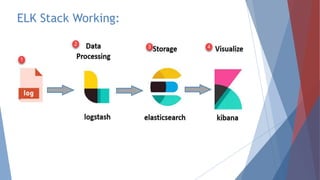
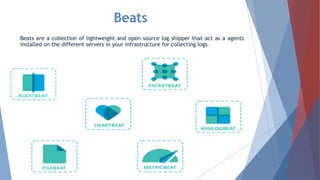
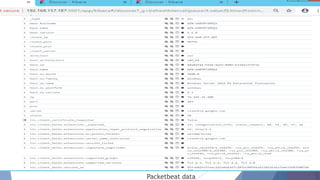
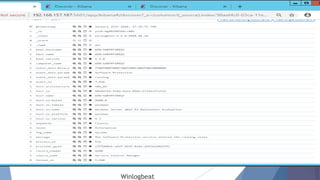
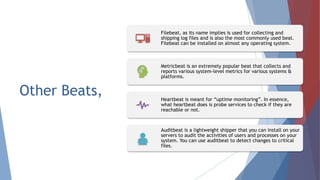
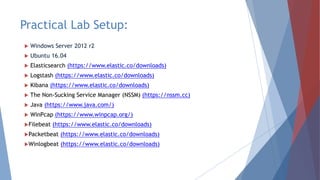
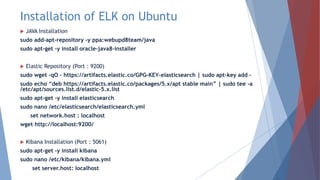
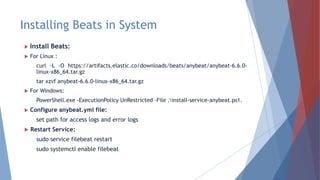
Log Analysis using
ELK
Agenda
 Log Management
 Log Monitoring
 Log Analysis
 Need for Log Analysis
 Problem with Log Analysis
 Some of Log Management Tool
 What is ELK Stack
 ELK Stack Working
 Beats
 Different Types of Server Logs
 Example of Winlog beat, Packetbeat,
Apache2 and Nginx Server log analysis
 Mimikatz
 Malicious File Detection using ELK
 Practical Setup
 Future Work
Log Management
 Log management is the collective
processes and policies used to
administer and facilitate the generation,
transmission, analysis, storage, archiving
and ultimate disposal of the large
volumes of log data created within an
information system.
 A log may be digital or manual, and log
management can help to classify and use
the data within in a number of different
ways
Log Monitoring
 Log Monitoring is a act of reviewing
collected logs as they are recorded.
 Log Monitoring is the process by which
we observe log messages, often
through real-time processing and
parsing of these files.
Log Analysis
 Each & Every Application generates
some logs which help us to get idea
about how the application works or how
the application is performing.
 Log analysis helps us to analyse the logs
in better way.
 It may be centralized or decentralized.
 Log analysis is the process of analysing
computer data.
 Logs are always unstructured from of
data.
Need for
Log
Analysis:
Issue Debugging
Predictive analysis
Security Analysis
Perform Analysis
Problem with Log
analysis:
 Non-consistent Log Format
 Non-consistent Time Format
 Decentralized Log
 Expert Knowledge Requirement
Some of Log Management Tool
graylog
Working of Log Management
What is ELK Stack
E-Elasticsearch
L-Logstash
K-Kibana
ELK Stack is a combination of three open
source tools which forms a log
management tool that helps in deep
searching ,analyzing and visualizing the
log generated from different machines.
Elasticsearch
Elasticsearch is highly scalable open source full-text search and analytics
engine. It allows you to store, search, and analyze big volumes of data quickly
and in near real time. It is generally used as the underlying engine/technology
that powers applications that have complex search features and requirements.
Logstash
Logstash is an open source data collection engine with real time pipelining
capabilities. Logstash can dynamically unify data from different sources and
normalize the data into destinations of your choice.
Kibana
Kibana is an open source analytics and visualization platform designed to work
with Elasticsearch. You can use Kibana to search, view, and interact with data
stored in Elasticsearch indices. You can easily perform advanced data analysis
and visualize your data in a variety of charts, tables, and maps.
ELK Stack Working:
Beats
Beats are a collection of lightweight and open source log shipper that act as a agents
installed on the different servers in your infrastructure for collecting logs.
Packet Beat
A network packet analyzer, packetbeat was the
first beat introduced. PacketBeat captures
network traffic between server and as such can
be used for application and performance
monitoring.
Packetbeat can be installed on the server being
monitored or on its own dedicated server.
Packetbeat tracks the network traffic, decode the
protocols, and records data for each transaction .
The protocol supported by Packetbeat include
DNS, HTTP, ICMP, Redis, MySQL, MongoDB and
many more.
Packetbeat data
Winlog Beat
Winlog beat will only interest windows
sysadmins or engineers as it is a beat
designed specifically for collecting
windows Event Logs. It can be used to
analyze security events.
Winlogbeat
Other Beats,
Filebeat, as its name implies is used for collecting and
shipping log files and is also the most commonly used beat.
Filebeat can be installed on almost any operating system.
Metricbeat is an extremely popular beat that collects and
reports various system-level metrics for various systems &
platforms.
Heartbeat is meant for “uptime monitoring”. In essence,
what heartbeat does is probe services to check if they are
reachable or not.
Auditbeat is a lightweight shipper that you can install on your
servers to audit the activities of users and processes on your
system. You can use auditbeat to detect changes to critical
files.
Different
types of Server
Logs
Apache2 HTTP Server
Apache HTTP Server called Apache, is free and open-source,
cross-platform, web server software. It is fast, reliable and
secure.
Access Log
An access log is a list of all the requests for individual files that
people have requested from a Web site. These files will include
the HTML files and their imbedded graphic images and any other
associated files that get transmitted.
Error Log
Apache web server also provide administrator with another type
of log file called error logs. This log file is used to provide more
information regarding a particular error that has occurred on the
web servers.
Access_log
Error_log
Nginx Server
NGINX is open source software for web serving, reverse proxy,
load balancing, media streaming and more. NGINX has two type
of logs Access logs and Error logs.
 NGINX can serve up static content quicker, but Apache
includes the modules needed to work with back end application
and run scripting languages.
 Both can be used as proxy server but
NGINX as a proxy server
Apache as a back end is a common approach to take.
 Rather than creating new processes for each web request ,
NGINX uses an asynchronous event-driven approach.
 Sample log file location on Linux system:
/var/log/nginx/access_log
Nginx Data
Log Formats
Access logs are normally formatted in three standard formats: Common, Combined and W3C.
Below you can see detailed information on each log format and what data it contains.
 Common Log Format
This log format includes the basic information that is required to identify the host and the
request. It is normally displayed as this:
%h %l %u %t "%r" %>s %b
%h : IP Address of Client %t: Time of Request %b: Size of Request
%l : Identd of Client %r: Full Request String
%u : User id of user requesting object %>s: Status Code
 Combined Log Format
This log format contains the information available in the common log format but it also
includes the referrer information and the browser information.
%h %l %u %t "%r" %>s %b "%{Referer}i" "%{User-agent}i"
%{Referer}i : The Previous Web Page
%{User-agent}i : The Client’s browser
Mimikatz
A Mimikatz is an open-source utility that enables the
viewing of credentials information form the Windows lsass
(Local Security Authority Subsystem Service) through its
sekurlsa module which includes plaintext passwords and
Kerberos tickets which could then be used for attack such
as pass-the-hash and pass-the-ticket.
Attackers commonly use Mimikatz to steal credentials and
escalate privileges.
Detection of Mimikatz on Disk
Event ID 7: Image loaded
The image loaded event logs when a module is loaded in a specific process.
Sysmon Config
The process that I used for this first test was "PowerShell.exe" so I created a basic Sysmon
configuration to only log images loaded by this process.
Testing/Logging Images loaded by PowerShell
Launch PowerShell and close it.
Create Kibana Visualization (data field: event_data.Imageloaded) for "ImageLoaded" events
and add it in Kibana Dashboard.
Download the latest Mimikatz Trunk
Add another rule to the Sysmon configuration. Open the config with notepad++ and add
another "Image" rule specifying the path to mimikatz.exe.
Running Mimikatz on Disk
Run PowerShell as Administrator and close it.
To test Mimikatz binary, Change directory to the one where the Mimikatz binary is
stored. Launch the following commands and close your PowerShell console:
.mimikatz.exe "privilege::debug" "sekurlsa::logonpasswords" exit
Kibana Dashboard
Detection of
Mimikatz in-memory
Event ID 10: Process Access

The process accessed event reports when a
process opens another process, an operation
that’s often followed by information queries
or reading and writing the address space of
the target process. This enables detection
of hacking tools that read the memory
contents of processes like Local Security
Authority (Lsass.exe) in order to steal
credentials for use in Pass-the-Hash
attacks.
Sysmon Config
Monitor for "ProcessAccess" events
when Lsass.exe is accesses/opened by
PowerShell in order to steal credentials
after loading Mimikatz in memory.
Testing/Logging Images loaded by PowerShell
Create Kibana Visualization (data field: event_data.GrantAccess.keyword) for lsass event
and add it in Kibana Dashboard.
Add "SourceImage" and "TargetImage" in visualizations.
Add All three visualization in dashboard.
Download the latest Mimikatz Trunk and Run the binary
Next, start PowerShell as Administrator and run Mimikatz.exe with the following commands
.mimikatz.exe "privilege::debug" "sekurlsa::logonpasswords" exit
Kibana Dashboard
Event of Mimikatz accessing Lsass.exe
Mimikatz uses 0x1010 permissions to access Lsass.exe.
0x1000 (QueryLimitedInformation) & 0x0010 (VMRead)
Malicious File Detection using ELK
As a first step I can utilize the Elastic Stack to identify instances where
users may have downloaded a copy of virus.
Kibana Visualization
VirusTotal Detection
Practical Lab Setup:
 Windows Server 2012 r2
 Ubuntu 16.04
 Elasticsearch (https://www.elastic.co/downloads)
 Logstash (https://www.elastic.co/downloads)
 Kibana (https://www.elastic.co/downloads)
 The Non-Sucking Service Manager (NSSM) (https://nssm.cc)
 Java (https://www.java.com/)
 WinPcap (https://www.winpcap.org/)
Filebeat (https://www.elastic.co/downloads)
Packetbeat (https://www.elastic.co/downloads)
Winlogbeat (https://www.elastic.co/downloads)
Installation of ELK on Ubuntu
 JAVA Installation
sudo add-apt-repository -y ppa:webupd8team/java
sudo apt-get -y install oracle-java8-installer
 Elastic Repository (Port : 9200)
sudo wget -qO – https://artifacts.elastic.co/GPG-KEY-elasticsearch | sudo apt-key add –
sudo echo “deb https://artifacts.elastic.co/packages/5.x/apt stable main” | sudo tee -a
/etc/apt/sources.list.d/elastic-5.x.list
sudo apt-get -y install elasticsearch
sudo nano /etc/elasticsearch/elasticsearch.yml
set network.host : localhost
wget http://localhost:9200/
 Kibana Installation (Port : 5061)
sudo apt-get -y install kibana
sudo nano /etc/kibana/kibana.yml
set server.host: localhost
 Logstash Installation (Port : 5044)
sudo apt-get -y install logstash
sudo nano /etc/logstash/conf.d/02-beats-input.conf
sudo nano /etc/logstash/conf.d/30-elasticsearch-output.conf
 Restart Services
sudo service elasticsearch restart
sudo service kibana restart
sudo service logstash restart
 Kibana in browser
http://localhost:5601/
Installation of ELK on Windows Server
 Install JAVA Version 1.7 or about
 Elasticsearch Installation
Invoke-Expression -command “c:ELK-Stackelasticsearchbinservice install”
Invoke-Expression -command “c:ELK-Stackelasticsearchbinservice manager”
http://127.0.0.1:9200
 Logstash Installation
Start-BitsTransfer -Source http://robwillis.info/data/ELK-Stack/Config-
Files/logstash.json -Destination c:ELK-Stacklogstashbin
Invoke-Expression –command “C:ELK-Stacknssmwin64nssm install Logstash”
Invoke-Expression –command “c:ELK-Stacklogstashbinlogstash-plugin install logstash
input-beats”
 Kibana Installation
Invoke-Expression –command “C:ELK-Stacknssmwin64nssm install Kibana”
Open a browser and go to http://localhost:5601
Installing Beats in System
 Install Beats:
 For Linux :
curl -L -O https://artifacts.elastic.co/downloads/beats/anybeat/anybeat-6.6.0-
linux-x86_64.tar.gz
tar xzvf anybeat-6.6.0-linux-x86_64.tar.gz
 For Windows:
PowerShell.exe -ExecutionPolicy UnRestricted -File .install-service-anybeat.ps1.
 Configure anybeat.yml file:
set path for access logs and error logs
 Restart Service:
sudo service filebeat restart
sudo systemctl enable filebeat
Conclusion
 ELK Stack Configuration
 ELK Installation in Ubuntu 16.04
 ELK Installation in Windows Server 2012 r2
 Beats Installation
 Apache2 Server log Analysis
 Nginx Server log Analysis
 Packetbeat Analysis
 Winlogbeat Analysis
Detection on-disk Mimikatz
Events of Mimikatz accessing lsass.exe
Future work on this Project:
 Email Configuration in ELK
 Alert Generating through ELK
References
 http://robwillis.info/2016/05/installing-elasticsearch-logstash-and-kibana-
elk-on-windows-server-2012-r2/
 http://robwillis.info/2016/05/installing-elasticsearch-logstash-and-kibana-
elk-on-windows-server-2012-r2/
 https://www.sumologic.com/blog/using-sumo/apache-logs-vs-nginx-logs/
 https://www.elastic.co/guide/en/beats/libbeat/current/getting-
started.html
 https://www.elastic.co/webinars/introduction-elk-stack
 https://www.elastic.co/guide/en/beats/filebeat/current/index.html
 https://burnhamforensics.com/2018/08/14/creating-a-single-node-elk-
stack/
Thank You

Log analysis using elk

  • 1.
  • 2.
    Agenda  Log Management Log Monitoring  Log Analysis  Need for Log Analysis  Problem with Log Analysis  Some of Log Management Tool  What is ELK Stack  ELK Stack Working  Beats  Different Types of Server Logs  Example of Winlog beat, Packetbeat, Apache2 and Nginx Server log analysis  Mimikatz  Malicious File Detection using ELK  Practical Setup  Future Work
  • 3.
    Log Management  Logmanagement is the collective processes and policies used to administer and facilitate the generation, transmission, analysis, storage, archiving and ultimate disposal of the large volumes of log data created within an information system.  A log may be digital or manual, and log management can help to classify and use the data within in a number of different ways
  • 4.
    Log Monitoring  LogMonitoring is a act of reviewing collected logs as they are recorded.  Log Monitoring is the process by which we observe log messages, often through real-time processing and parsing of these files.
  • 5.
    Log Analysis  Each& Every Application generates some logs which help us to get idea about how the application works or how the application is performing.  Log analysis helps us to analyse the logs in better way.  It may be centralized or decentralized.  Log analysis is the process of analysing computer data.  Logs are always unstructured from of data.
  • 6.
    Need for Log Analysis: Issue Debugging Predictiveanalysis Security Analysis Perform Analysis
  • 7.
    Problem with Log analysis: Non-consistent Log Format  Non-consistent Time Format  Decentralized Log  Expert Knowledge Requirement
  • 8.
    Some of LogManagement Tool graylog
  • 9.
    Working of LogManagement
  • 10.
    What is ELKStack E-Elasticsearch L-Logstash K-Kibana ELK Stack is a combination of three open source tools which forms a log management tool that helps in deep searching ,analyzing and visualizing the log generated from different machines.
  • 11.
    Elasticsearch Elasticsearch is highlyscalable open source full-text search and analytics engine. It allows you to store, search, and analyze big volumes of data quickly and in near real time. It is generally used as the underlying engine/technology that powers applications that have complex search features and requirements. Logstash Logstash is an open source data collection engine with real time pipelining capabilities. Logstash can dynamically unify data from different sources and normalize the data into destinations of your choice. Kibana Kibana is an open source analytics and visualization platform designed to work with Elasticsearch. You can use Kibana to search, view, and interact with data stored in Elasticsearch indices. You can easily perform advanced data analysis and visualize your data in a variety of charts, tables, and maps.
  • 12.
  • 13.
    Beats Beats are acollection of lightweight and open source log shipper that act as a agents installed on the different servers in your infrastructure for collecting logs.
  • 14.
    Packet Beat A networkpacket analyzer, packetbeat was the first beat introduced. PacketBeat captures network traffic between server and as such can be used for application and performance monitoring. Packetbeat can be installed on the server being monitored or on its own dedicated server. Packetbeat tracks the network traffic, decode the protocols, and records data for each transaction . The protocol supported by Packetbeat include DNS, HTTP, ICMP, Redis, MySQL, MongoDB and many more.
  • 15.
  • 16.
    Winlog Beat Winlog beatwill only interest windows sysadmins or engineers as it is a beat designed specifically for collecting windows Event Logs. It can be used to analyze security events.
  • 17.
  • 18.
    Other Beats, Filebeat, asits name implies is used for collecting and shipping log files and is also the most commonly used beat. Filebeat can be installed on almost any operating system. Metricbeat is an extremely popular beat that collects and reports various system-level metrics for various systems & platforms. Heartbeat is meant for “uptime monitoring”. In essence, what heartbeat does is probe services to check if they are reachable or not. Auditbeat is a lightweight shipper that you can install on your servers to audit the activities of users and processes on your system. You can use auditbeat to detect changes to critical files.
  • 19.
  • 20.
    Apache2 HTTP Server ApacheHTTP Server called Apache, is free and open-source, cross-platform, web server software. It is fast, reliable and secure. Access Log An access log is a list of all the requests for individual files that people have requested from a Web site. These files will include the HTML files and their imbedded graphic images and any other associated files that get transmitted. Error Log Apache web server also provide administrator with another type of log file called error logs. This log file is used to provide more information regarding a particular error that has occurred on the web servers.
  • 21.
  • 22.
  • 23.
    Nginx Server NGINX isopen source software for web serving, reverse proxy, load balancing, media streaming and more. NGINX has two type of logs Access logs and Error logs.  NGINX can serve up static content quicker, but Apache includes the modules needed to work with back end application and run scripting languages.  Both can be used as proxy server but NGINX as a proxy server Apache as a back end is a common approach to take.  Rather than creating new processes for each web request , NGINX uses an asynchronous event-driven approach.  Sample log file location on Linux system: /var/log/nginx/access_log
  • 24.
  • 25.
    Log Formats Access logsare normally formatted in three standard formats: Common, Combined and W3C. Below you can see detailed information on each log format and what data it contains.  Common Log Format This log format includes the basic information that is required to identify the host and the request. It is normally displayed as this: %h %l %u %t "%r" %>s %b %h : IP Address of Client %t: Time of Request %b: Size of Request %l : Identd of Client %r: Full Request String %u : User id of user requesting object %>s: Status Code  Combined Log Format This log format contains the information available in the common log format but it also includes the referrer information and the browser information. %h %l %u %t "%r" %>s %b "%{Referer}i" "%{User-agent}i" %{Referer}i : The Previous Web Page %{User-agent}i : The Client’s browser
  • 26.
    Mimikatz A Mimikatz isan open-source utility that enables the viewing of credentials information form the Windows lsass (Local Security Authority Subsystem Service) through its sekurlsa module which includes plaintext passwords and Kerberos tickets which could then be used for attack such as pass-the-hash and pass-the-ticket. Attackers commonly use Mimikatz to steal credentials and escalate privileges.
  • 27.
    Detection of Mimikatzon Disk Event ID 7: Image loaded The image loaded event logs when a module is loaded in a specific process. Sysmon Config The process that I used for this first test was "PowerShell.exe" so I created a basic Sysmon configuration to only log images loaded by this process.
  • 28.
    Testing/Logging Images loadedby PowerShell Launch PowerShell and close it. Create Kibana Visualization (data field: event_data.Imageloaded) for "ImageLoaded" events and add it in Kibana Dashboard.
  • 29.
    Download the latestMimikatz Trunk Add another rule to the Sysmon configuration. Open the config with notepad++ and add another "Image" rule specifying the path to mimikatz.exe. Running Mimikatz on Disk Run PowerShell as Administrator and close it. To test Mimikatz binary, Change directory to the one where the Mimikatz binary is stored. Launch the following commands and close your PowerShell console: .mimikatz.exe "privilege::debug" "sekurlsa::logonpasswords" exit
  • 30.
  • 31.
    Detection of Mimikatz in-memory EventID 10: Process Access  The process accessed event reports when a process opens another process, an operation that’s often followed by information queries or reading and writing the address space of the target process. This enables detection of hacking tools that read the memory contents of processes like Local Security Authority (Lsass.exe) in order to steal credentials for use in Pass-the-Hash attacks. Sysmon Config Monitor for "ProcessAccess" events when Lsass.exe is accesses/opened by PowerShell in order to steal credentials after loading Mimikatz in memory.
  • 32.
    Testing/Logging Images loadedby PowerShell Create Kibana Visualization (data field: event_data.GrantAccess.keyword) for lsass event and add it in Kibana Dashboard. Add "SourceImage" and "TargetImage" in visualizations. Add All three visualization in dashboard. Download the latest Mimikatz Trunk and Run the binary Next, start PowerShell as Administrator and run Mimikatz.exe with the following commands .mimikatz.exe "privilege::debug" "sekurlsa::logonpasswords" exit
  • 33.
  • 34.
    Event of Mimikatzaccessing Lsass.exe Mimikatz uses 0x1010 permissions to access Lsass.exe. 0x1000 (QueryLimitedInformation) & 0x0010 (VMRead)
  • 35.
    Malicious File Detectionusing ELK As a first step I can utilize the Elastic Stack to identify instances where users may have downloaded a copy of virus.
  • 36.
  • 38.
  • 39.
    Practical Lab Setup: Windows Server 2012 r2  Ubuntu 16.04  Elasticsearch (https://www.elastic.co/downloads)  Logstash (https://www.elastic.co/downloads)  Kibana (https://www.elastic.co/downloads)  The Non-Sucking Service Manager (NSSM) (https://nssm.cc)  Java (https://www.java.com/)  WinPcap (https://www.winpcap.org/) Filebeat (https://www.elastic.co/downloads) Packetbeat (https://www.elastic.co/downloads) Winlogbeat (https://www.elastic.co/downloads)
  • 40.
    Installation of ELKon Ubuntu  JAVA Installation sudo add-apt-repository -y ppa:webupd8team/java sudo apt-get -y install oracle-java8-installer  Elastic Repository (Port : 9200) sudo wget -qO – https://artifacts.elastic.co/GPG-KEY-elasticsearch | sudo apt-key add – sudo echo “deb https://artifacts.elastic.co/packages/5.x/apt stable main” | sudo tee -a /etc/apt/sources.list.d/elastic-5.x.list sudo apt-get -y install elasticsearch sudo nano /etc/elasticsearch/elasticsearch.yml set network.host : localhost wget http://localhost:9200/  Kibana Installation (Port : 5061) sudo apt-get -y install kibana sudo nano /etc/kibana/kibana.yml set server.host: localhost
  • 41.
     Logstash Installation(Port : 5044) sudo apt-get -y install logstash sudo nano /etc/logstash/conf.d/02-beats-input.conf sudo nano /etc/logstash/conf.d/30-elasticsearch-output.conf  Restart Services sudo service elasticsearch restart sudo service kibana restart sudo service logstash restart  Kibana in browser http://localhost:5601/
  • 42.
    Installation of ELKon Windows Server  Install JAVA Version 1.7 or about  Elasticsearch Installation Invoke-Expression -command “c:ELK-Stackelasticsearchbinservice install” Invoke-Expression -command “c:ELK-Stackelasticsearchbinservice manager” http://127.0.0.1:9200  Logstash Installation Start-BitsTransfer -Source http://robwillis.info/data/ELK-Stack/Config- Files/logstash.json -Destination c:ELK-Stacklogstashbin Invoke-Expression –command “C:ELK-Stacknssmwin64nssm install Logstash” Invoke-Expression –command “c:ELK-Stacklogstashbinlogstash-plugin install logstash input-beats”  Kibana Installation Invoke-Expression –command “C:ELK-Stacknssmwin64nssm install Kibana” Open a browser and go to http://localhost:5601
  • 43.
    Installing Beats inSystem  Install Beats:  For Linux : curl -L -O https://artifacts.elastic.co/downloads/beats/anybeat/anybeat-6.6.0- linux-x86_64.tar.gz tar xzvf anybeat-6.6.0-linux-x86_64.tar.gz  For Windows: PowerShell.exe -ExecutionPolicy UnRestricted -File .install-service-anybeat.ps1.  Configure anybeat.yml file: set path for access logs and error logs  Restart Service: sudo service filebeat restart sudo systemctl enable filebeat
  • 44.
    Conclusion  ELK StackConfiguration  ELK Installation in Ubuntu 16.04  ELK Installation in Windows Server 2012 r2  Beats Installation  Apache2 Server log Analysis  Nginx Server log Analysis  Packetbeat Analysis  Winlogbeat Analysis Detection on-disk Mimikatz Events of Mimikatz accessing lsass.exe
  • 45.
    Future work onthis Project:  Email Configuration in ELK  Alert Generating through ELK
  • 46.
    References  http://robwillis.info/2016/05/installing-elasticsearch-logstash-and-kibana- elk-on-windows-server-2012-r2/  http://robwillis.info/2016/05/installing-elasticsearch-logstash-and-kibana- elk-on-windows-server-2012-r2/ https://www.sumologic.com/blog/using-sumo/apache-logs-vs-nginx-logs/  https://www.elastic.co/guide/en/beats/libbeat/current/getting- started.html  https://www.elastic.co/webinars/introduction-elk-stack  https://www.elastic.co/guide/en/beats/filebeat/current/index.html  https://burnhamforensics.com/2018/08/14/creating-a-single-node-elk- stack/
  • 47.