Download to read offline
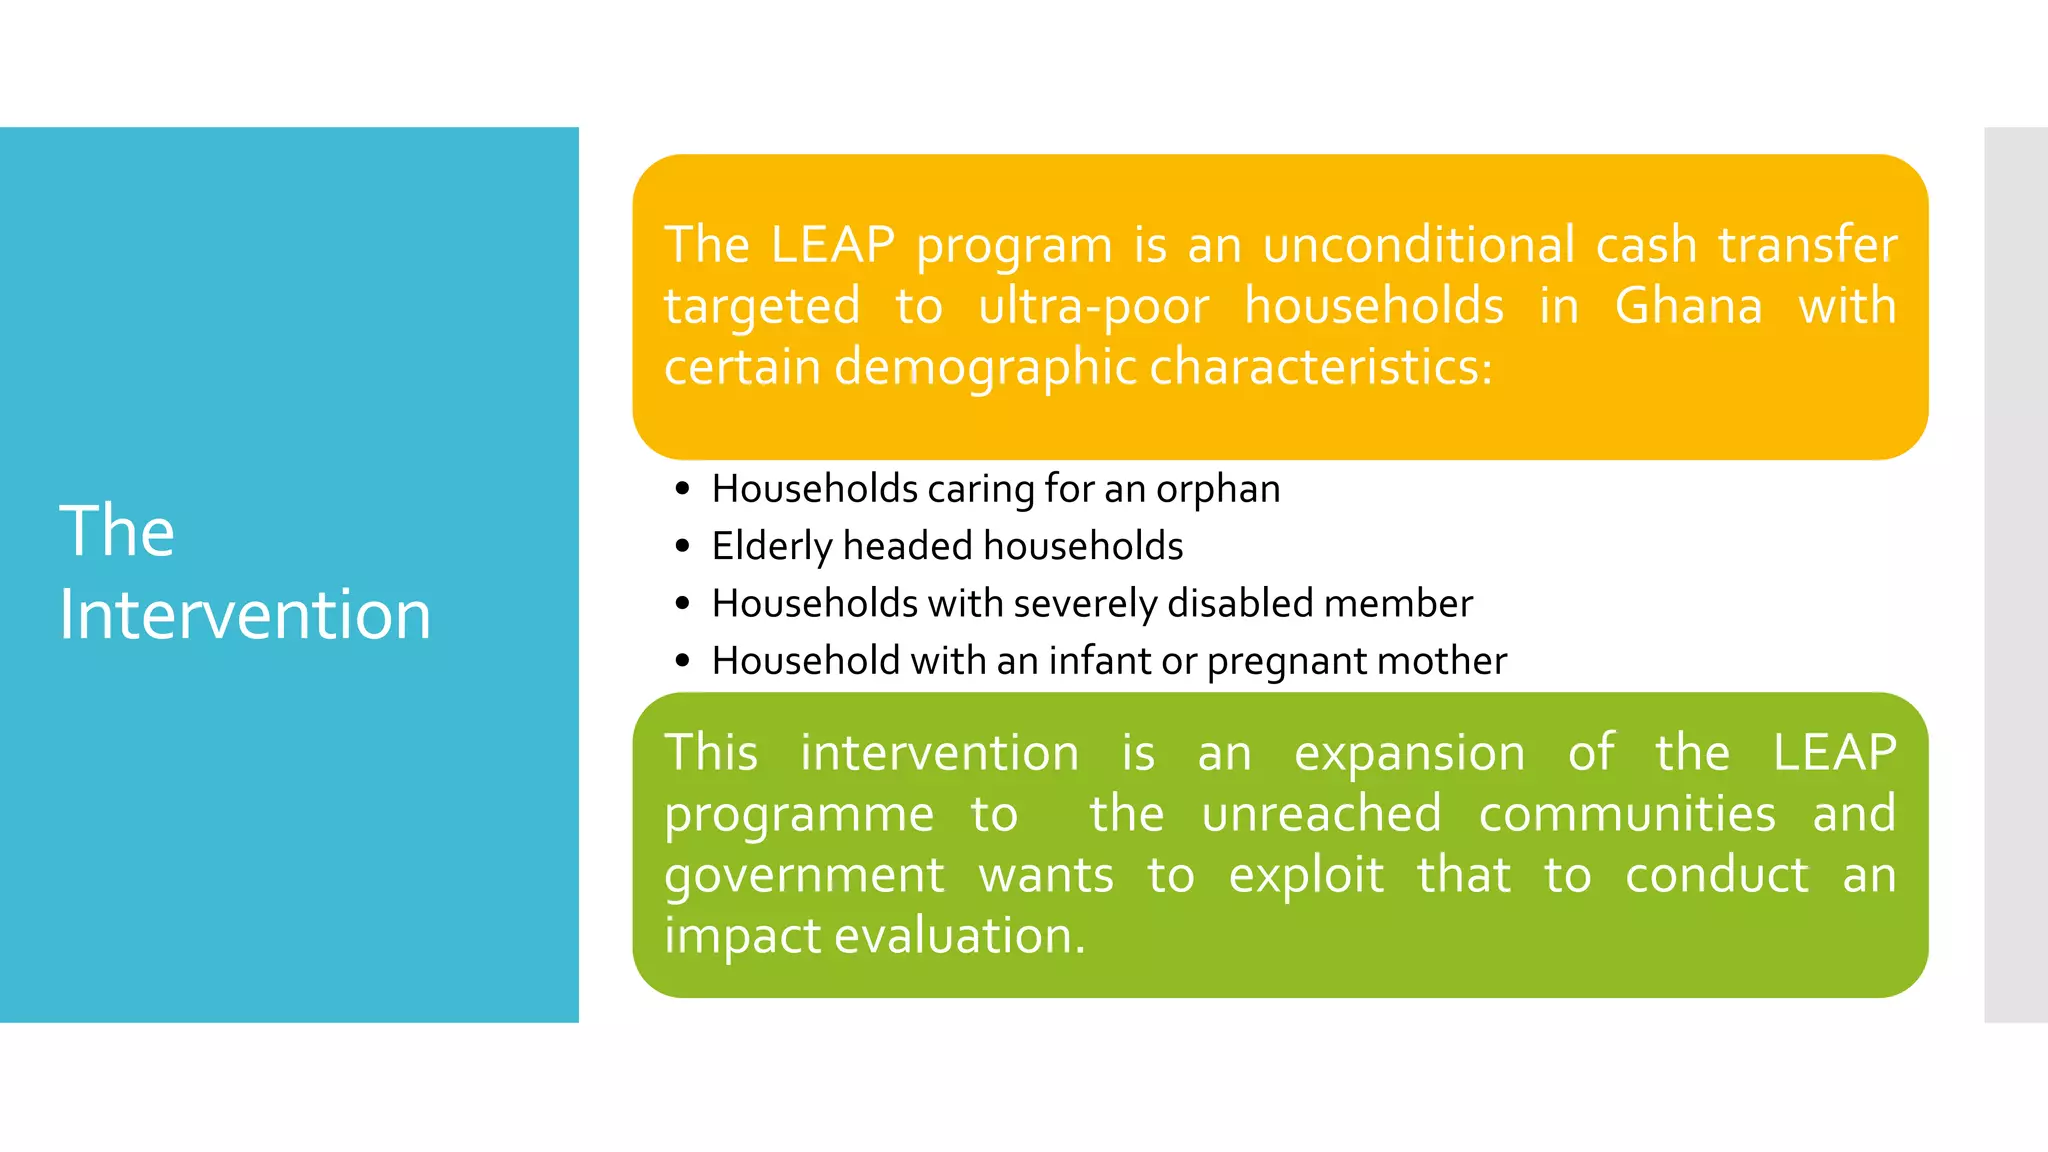
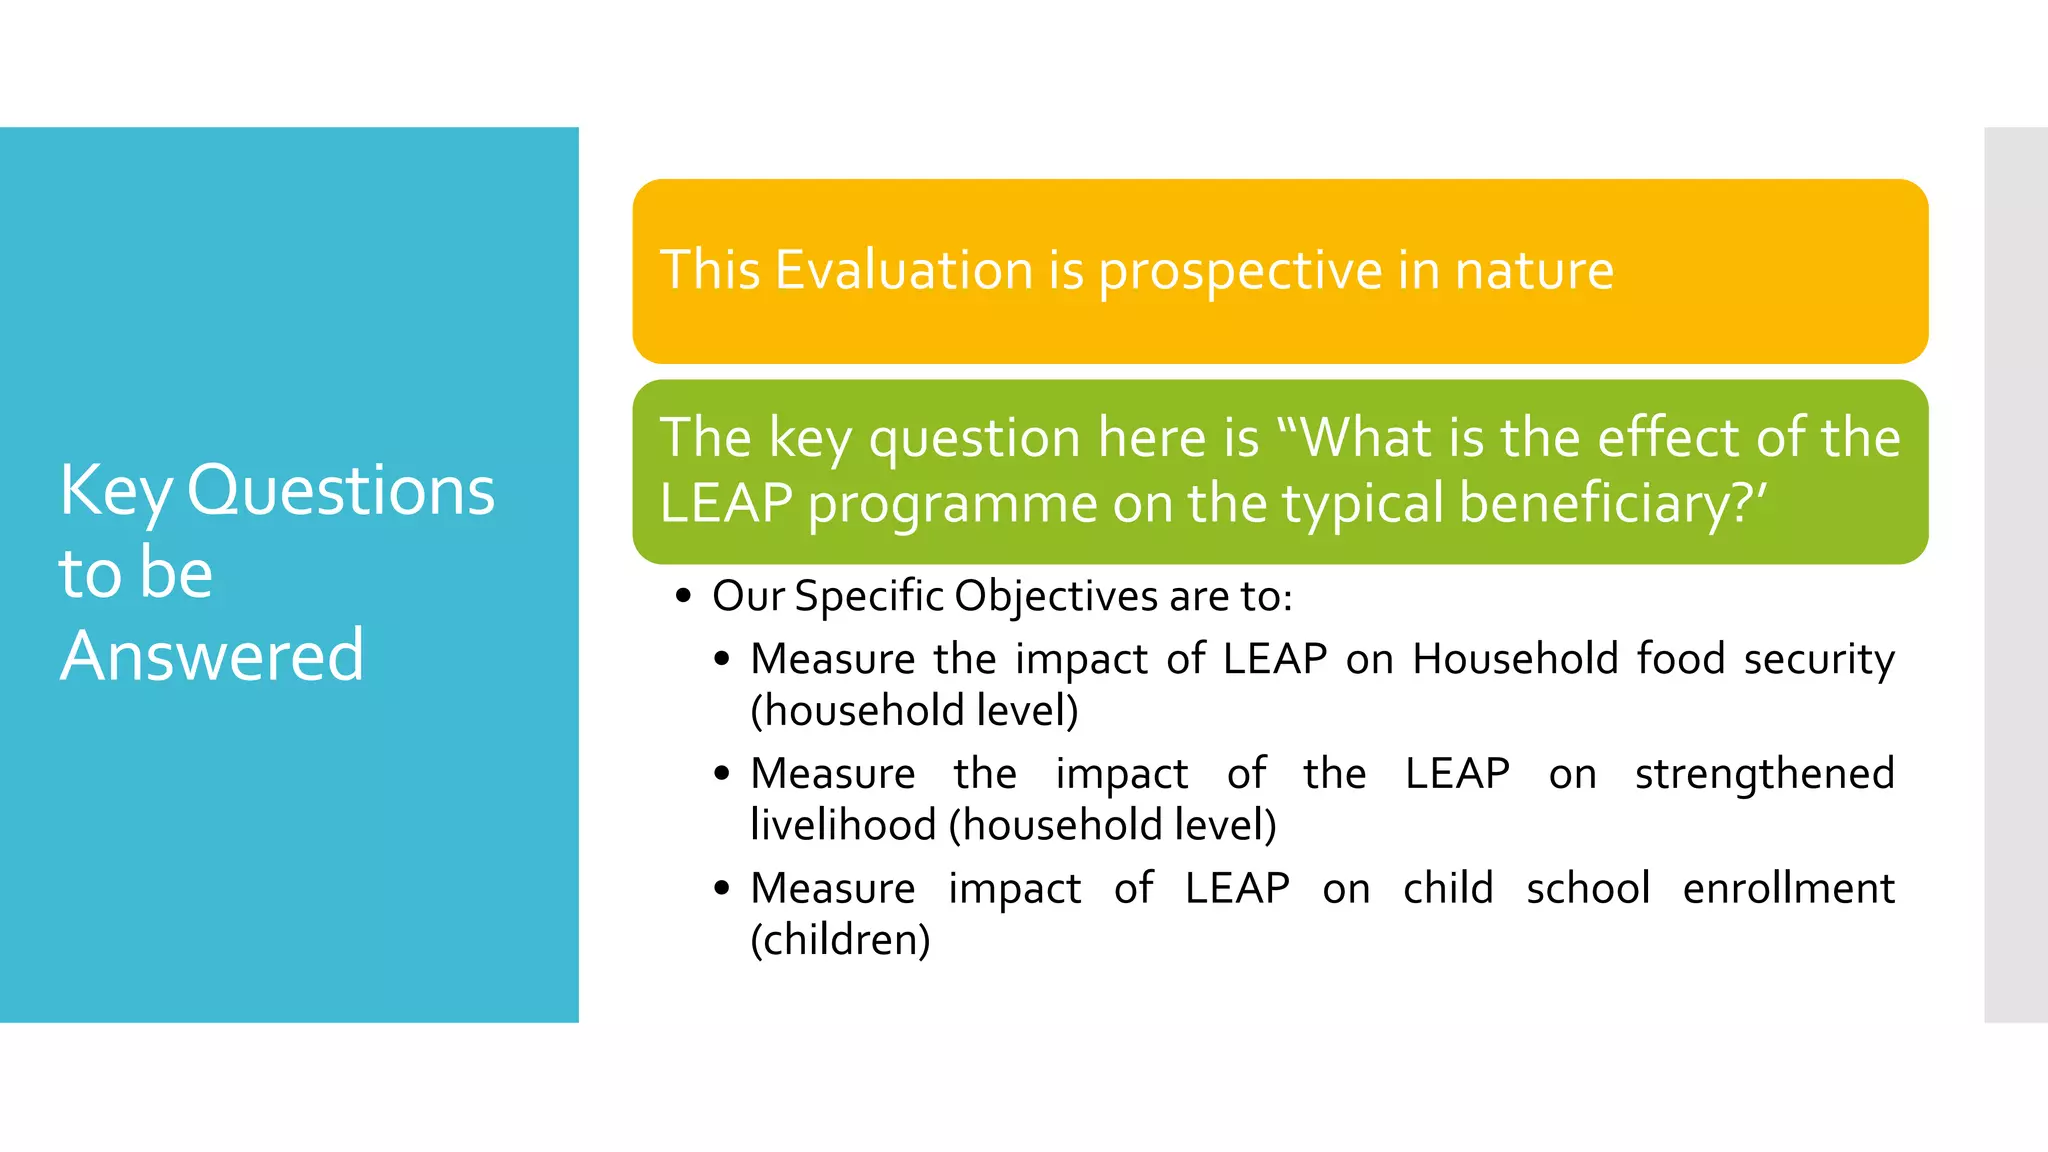
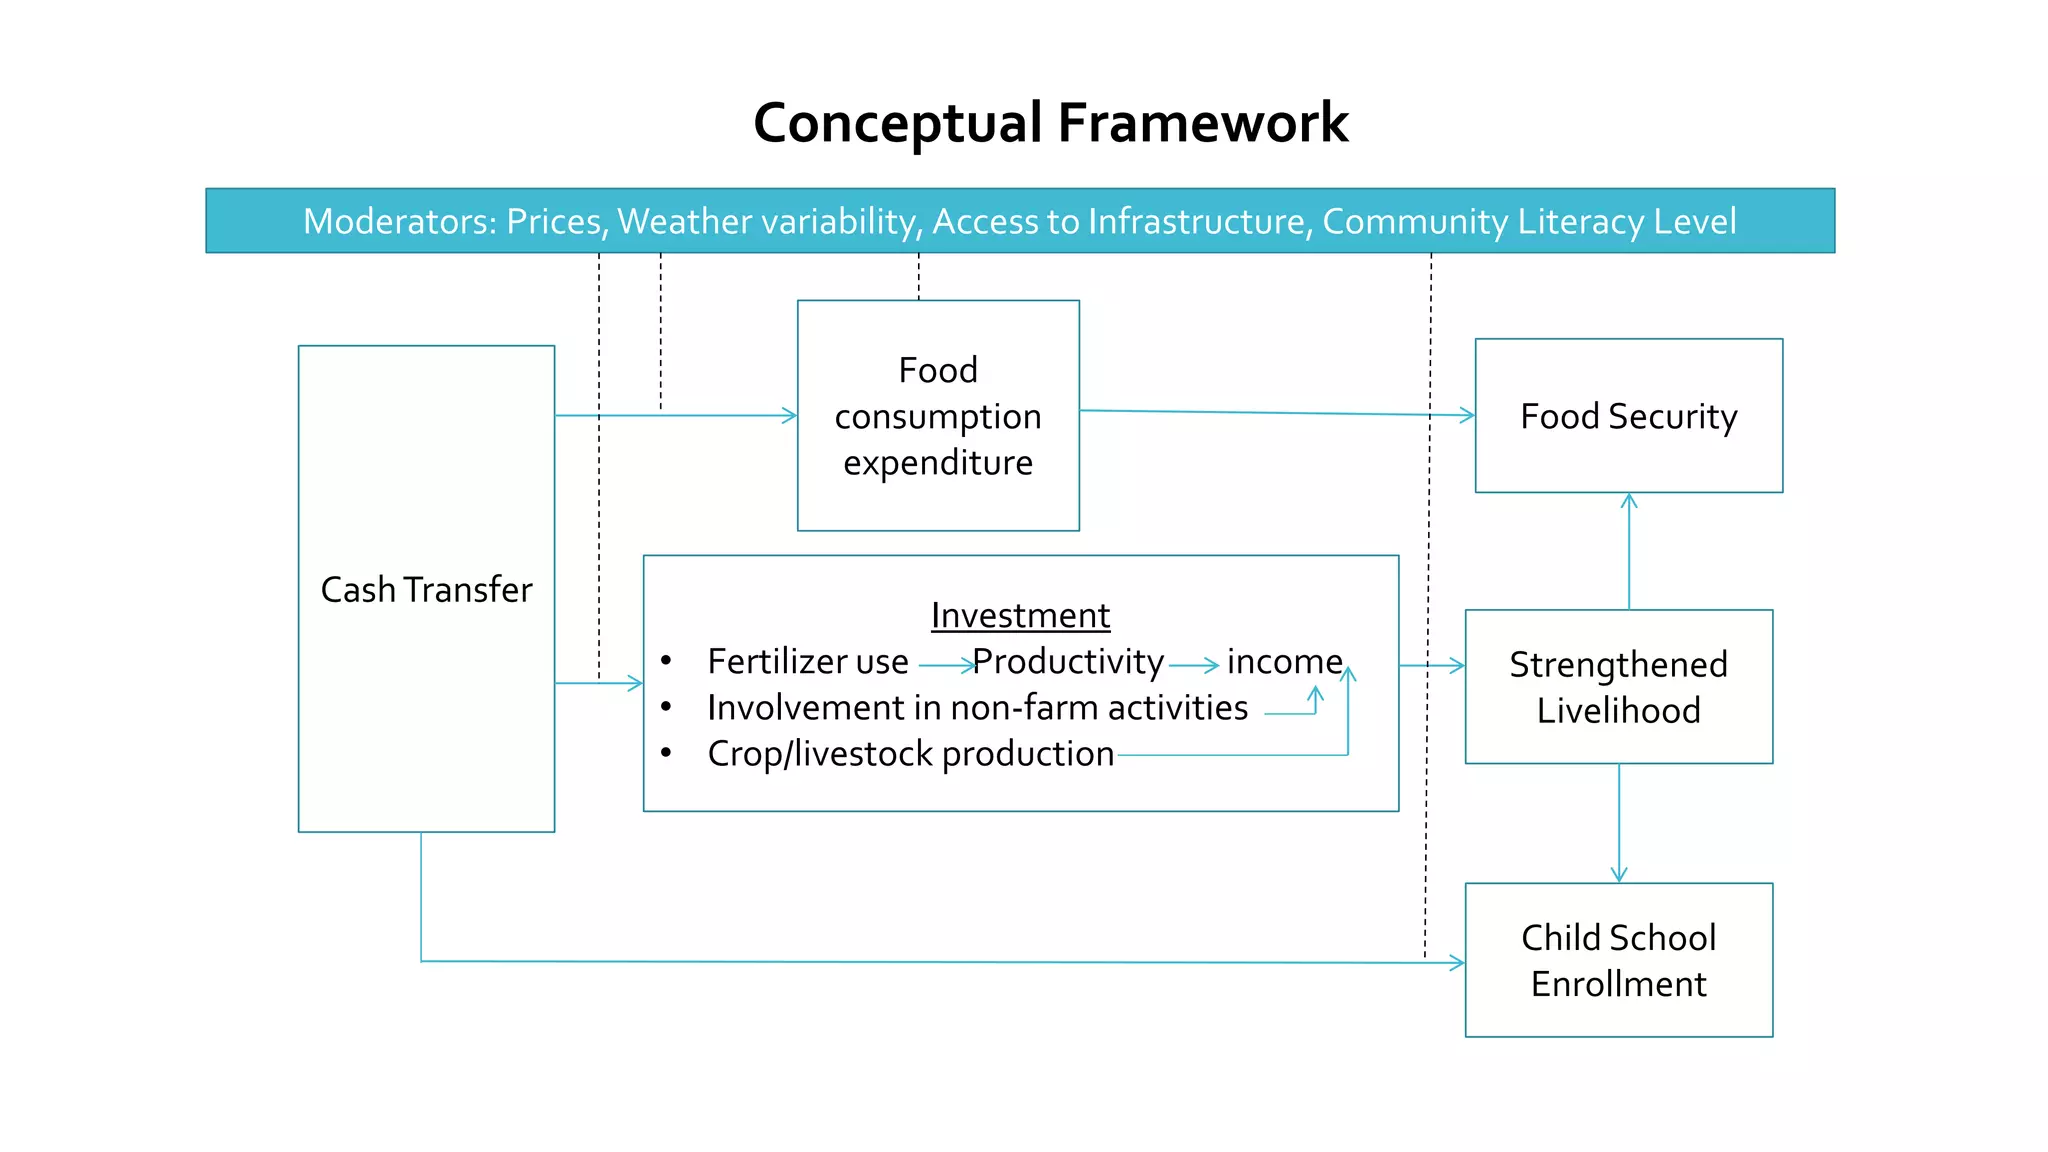
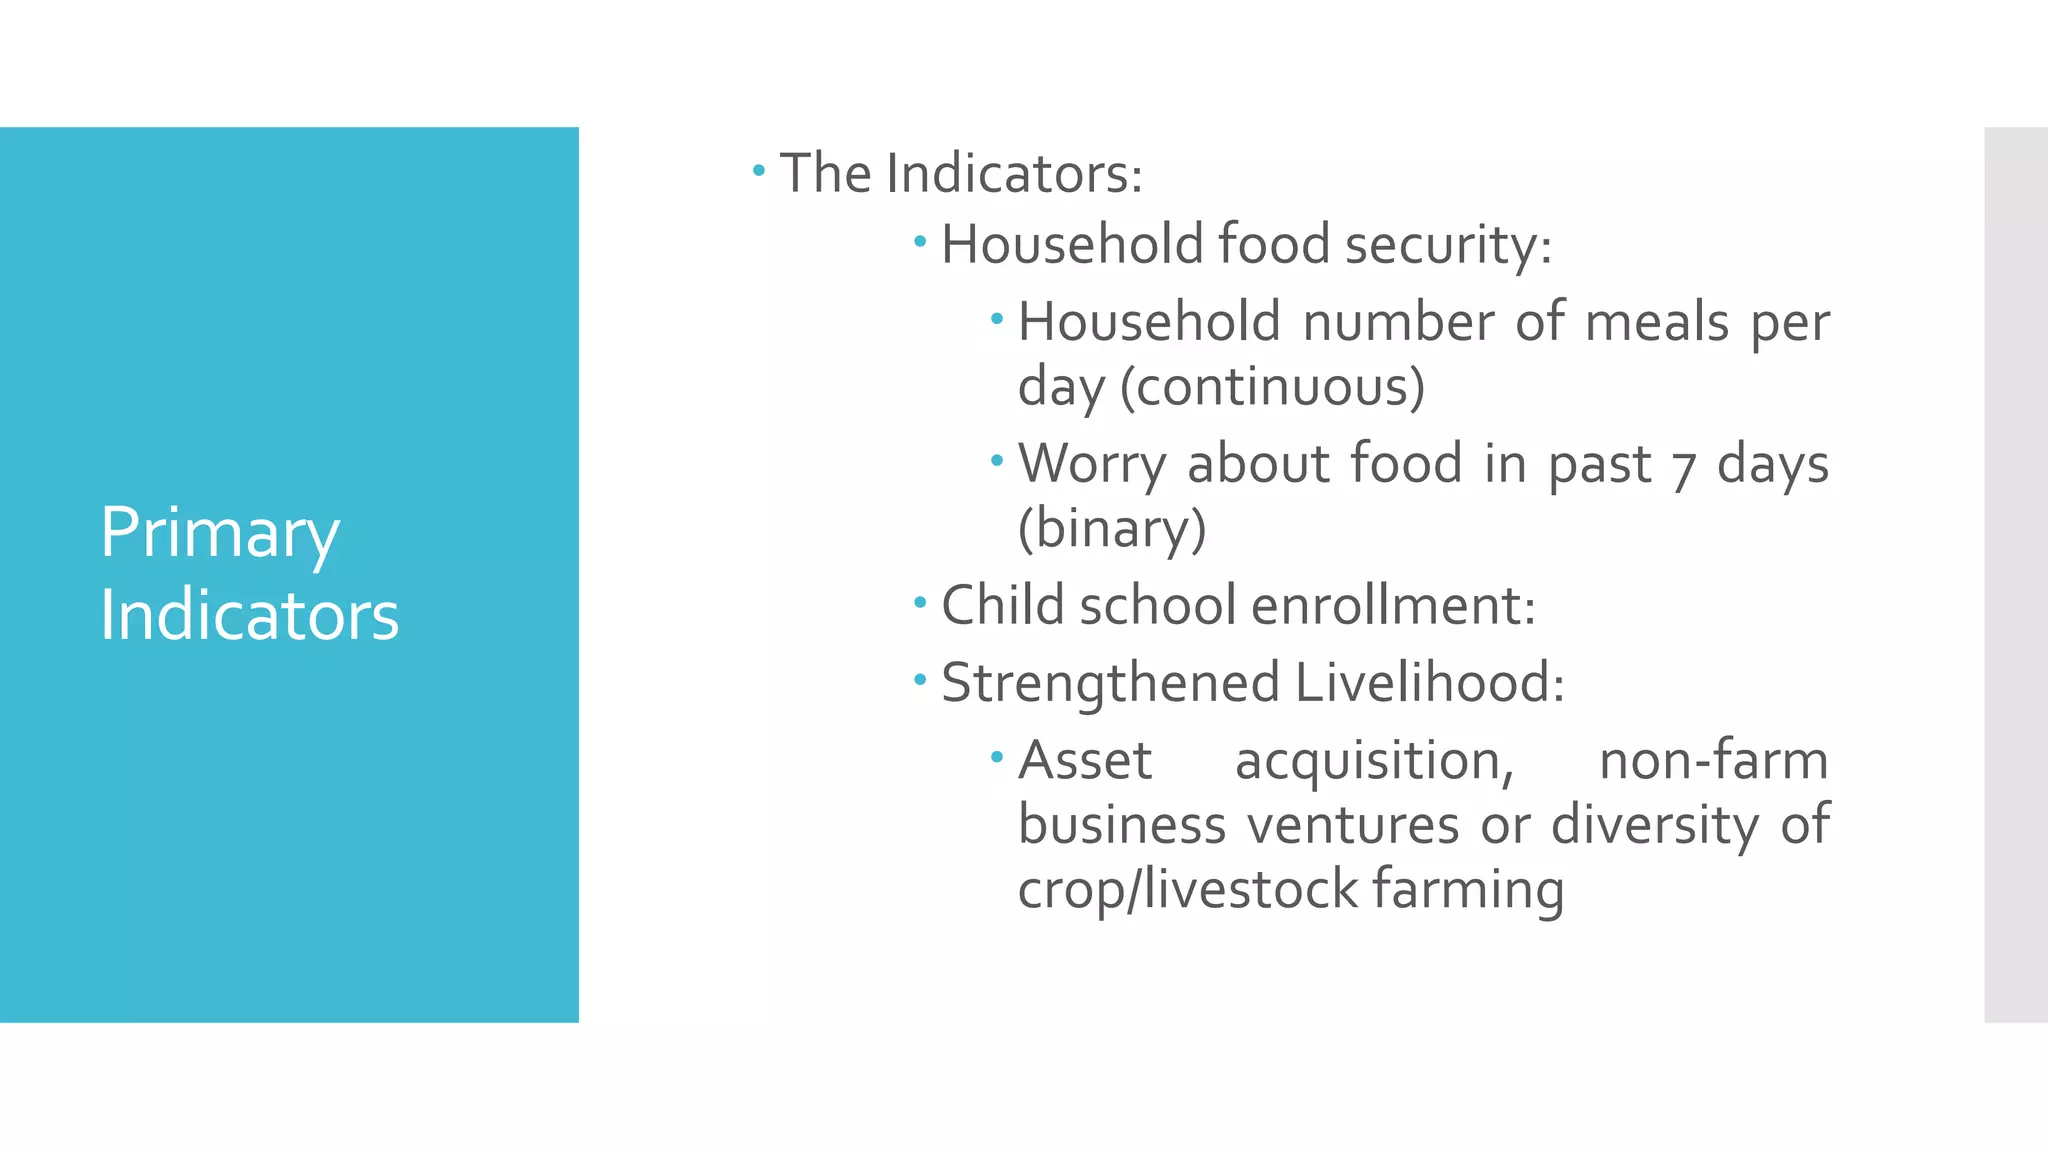
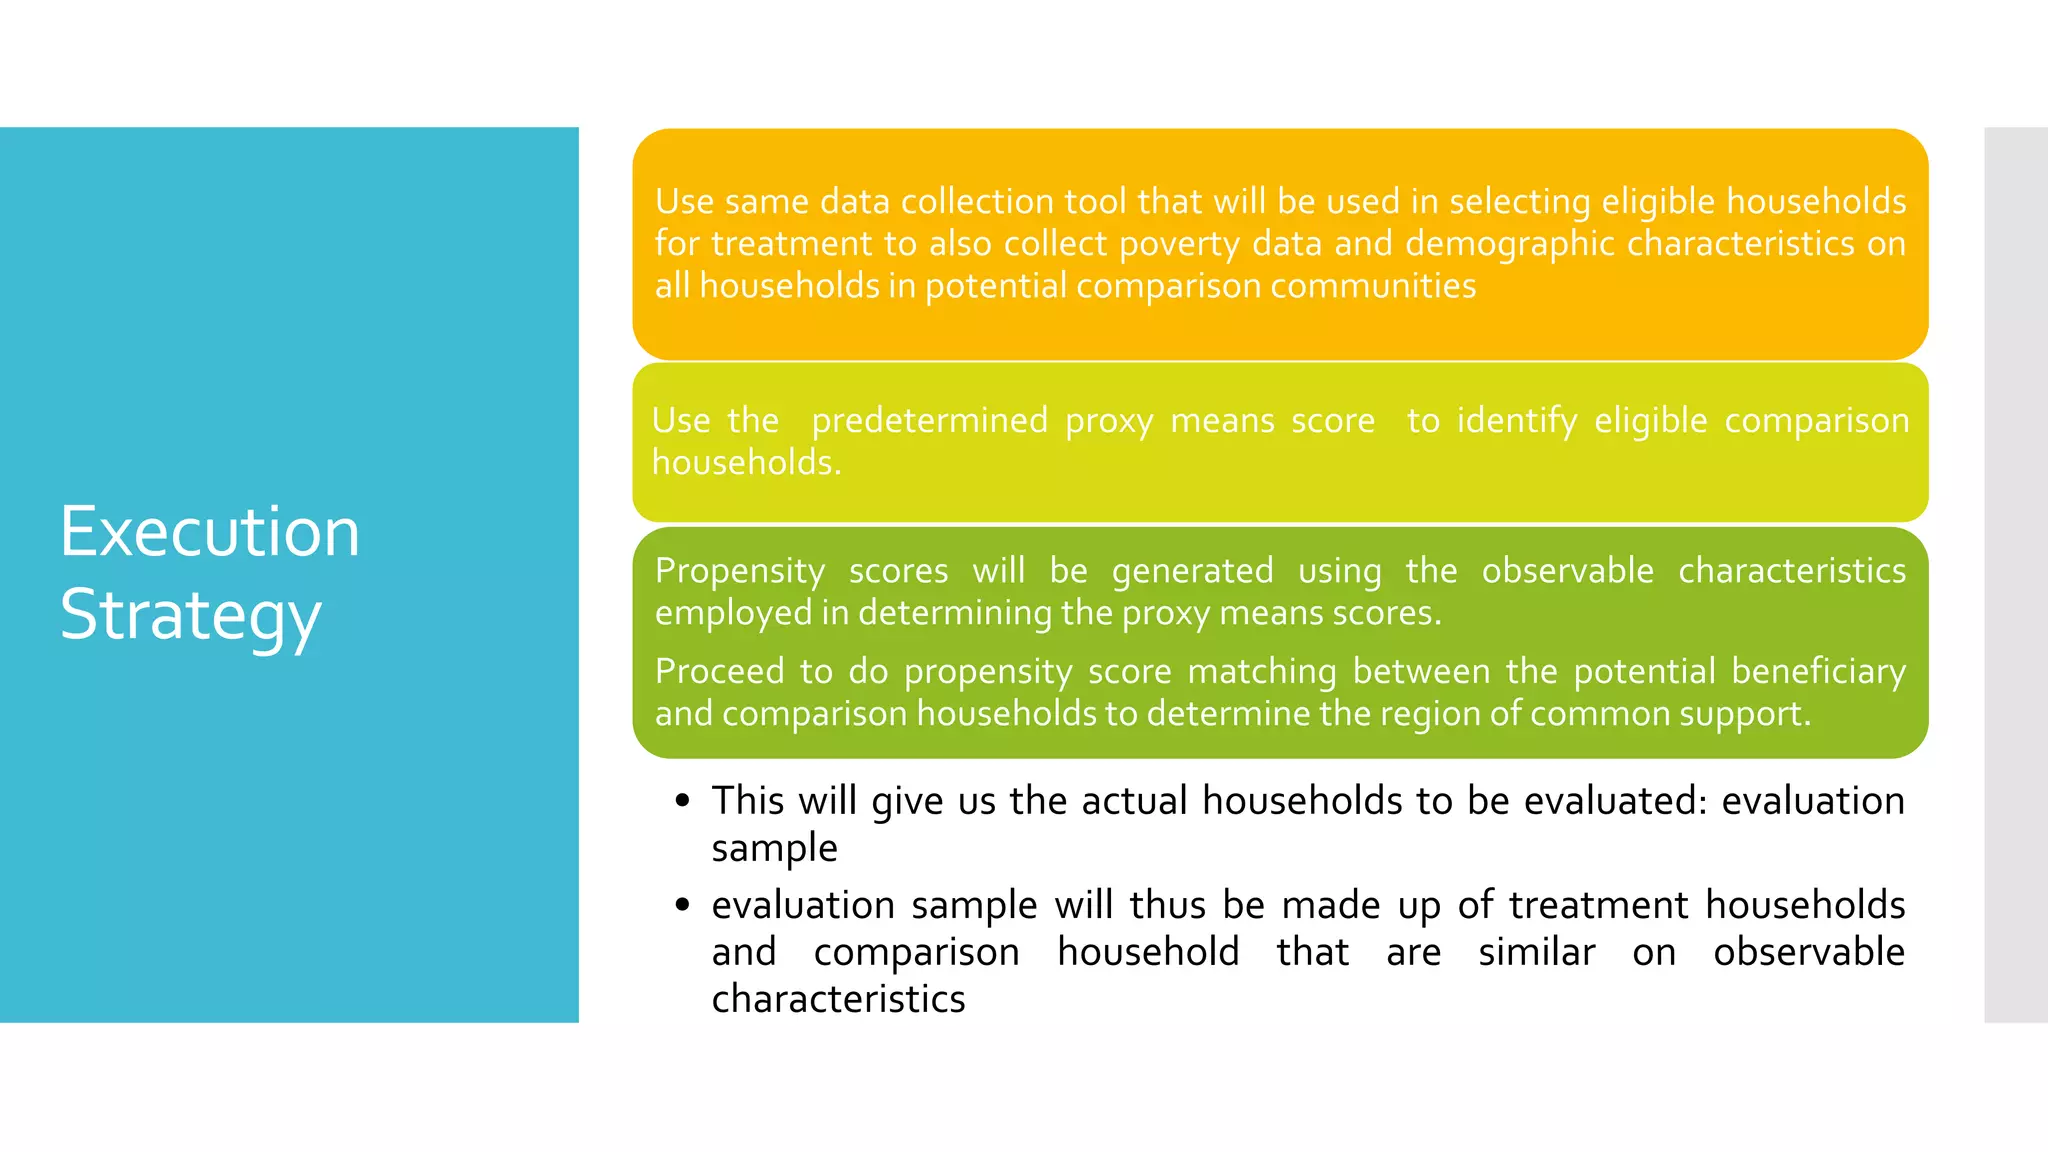
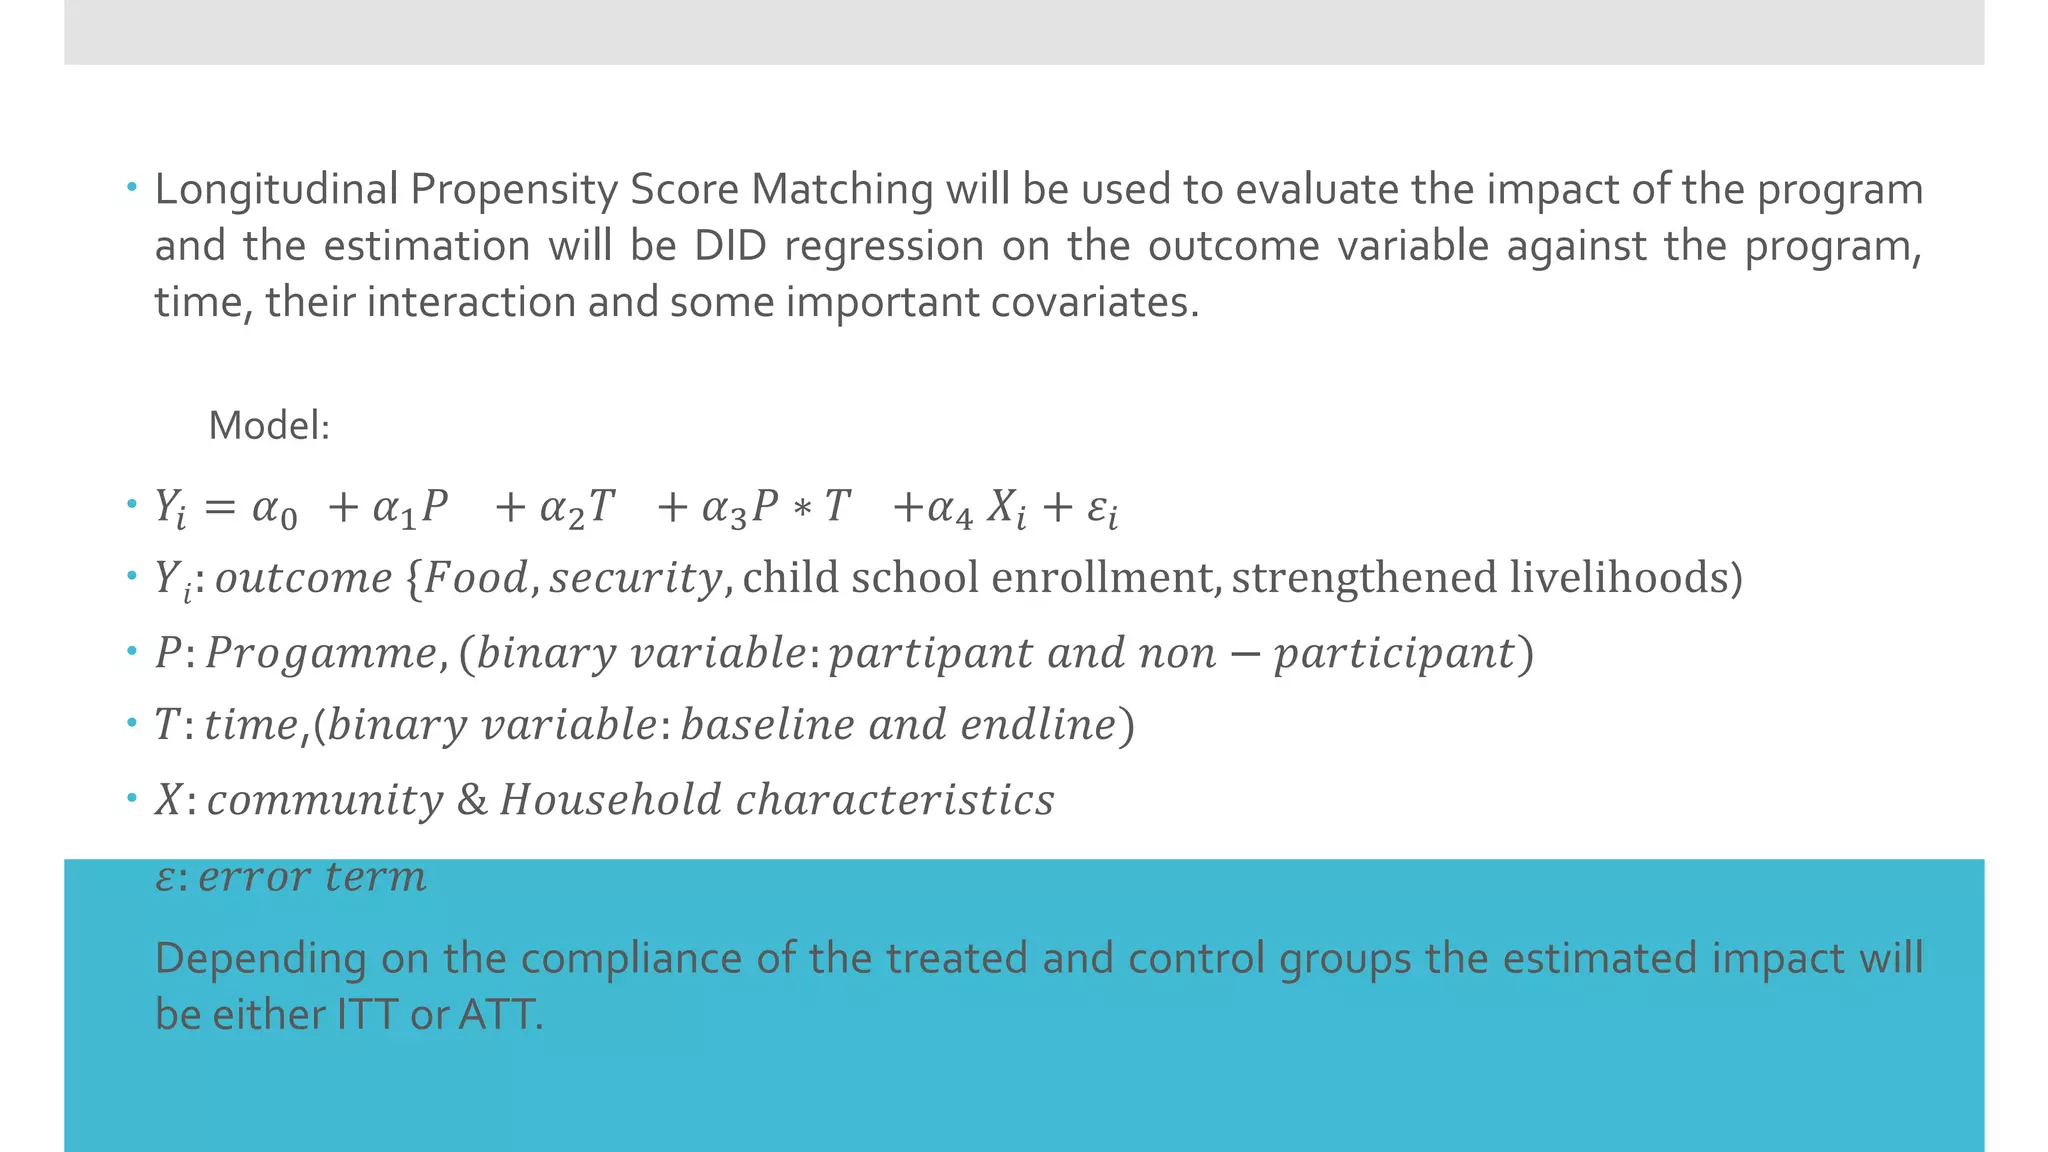
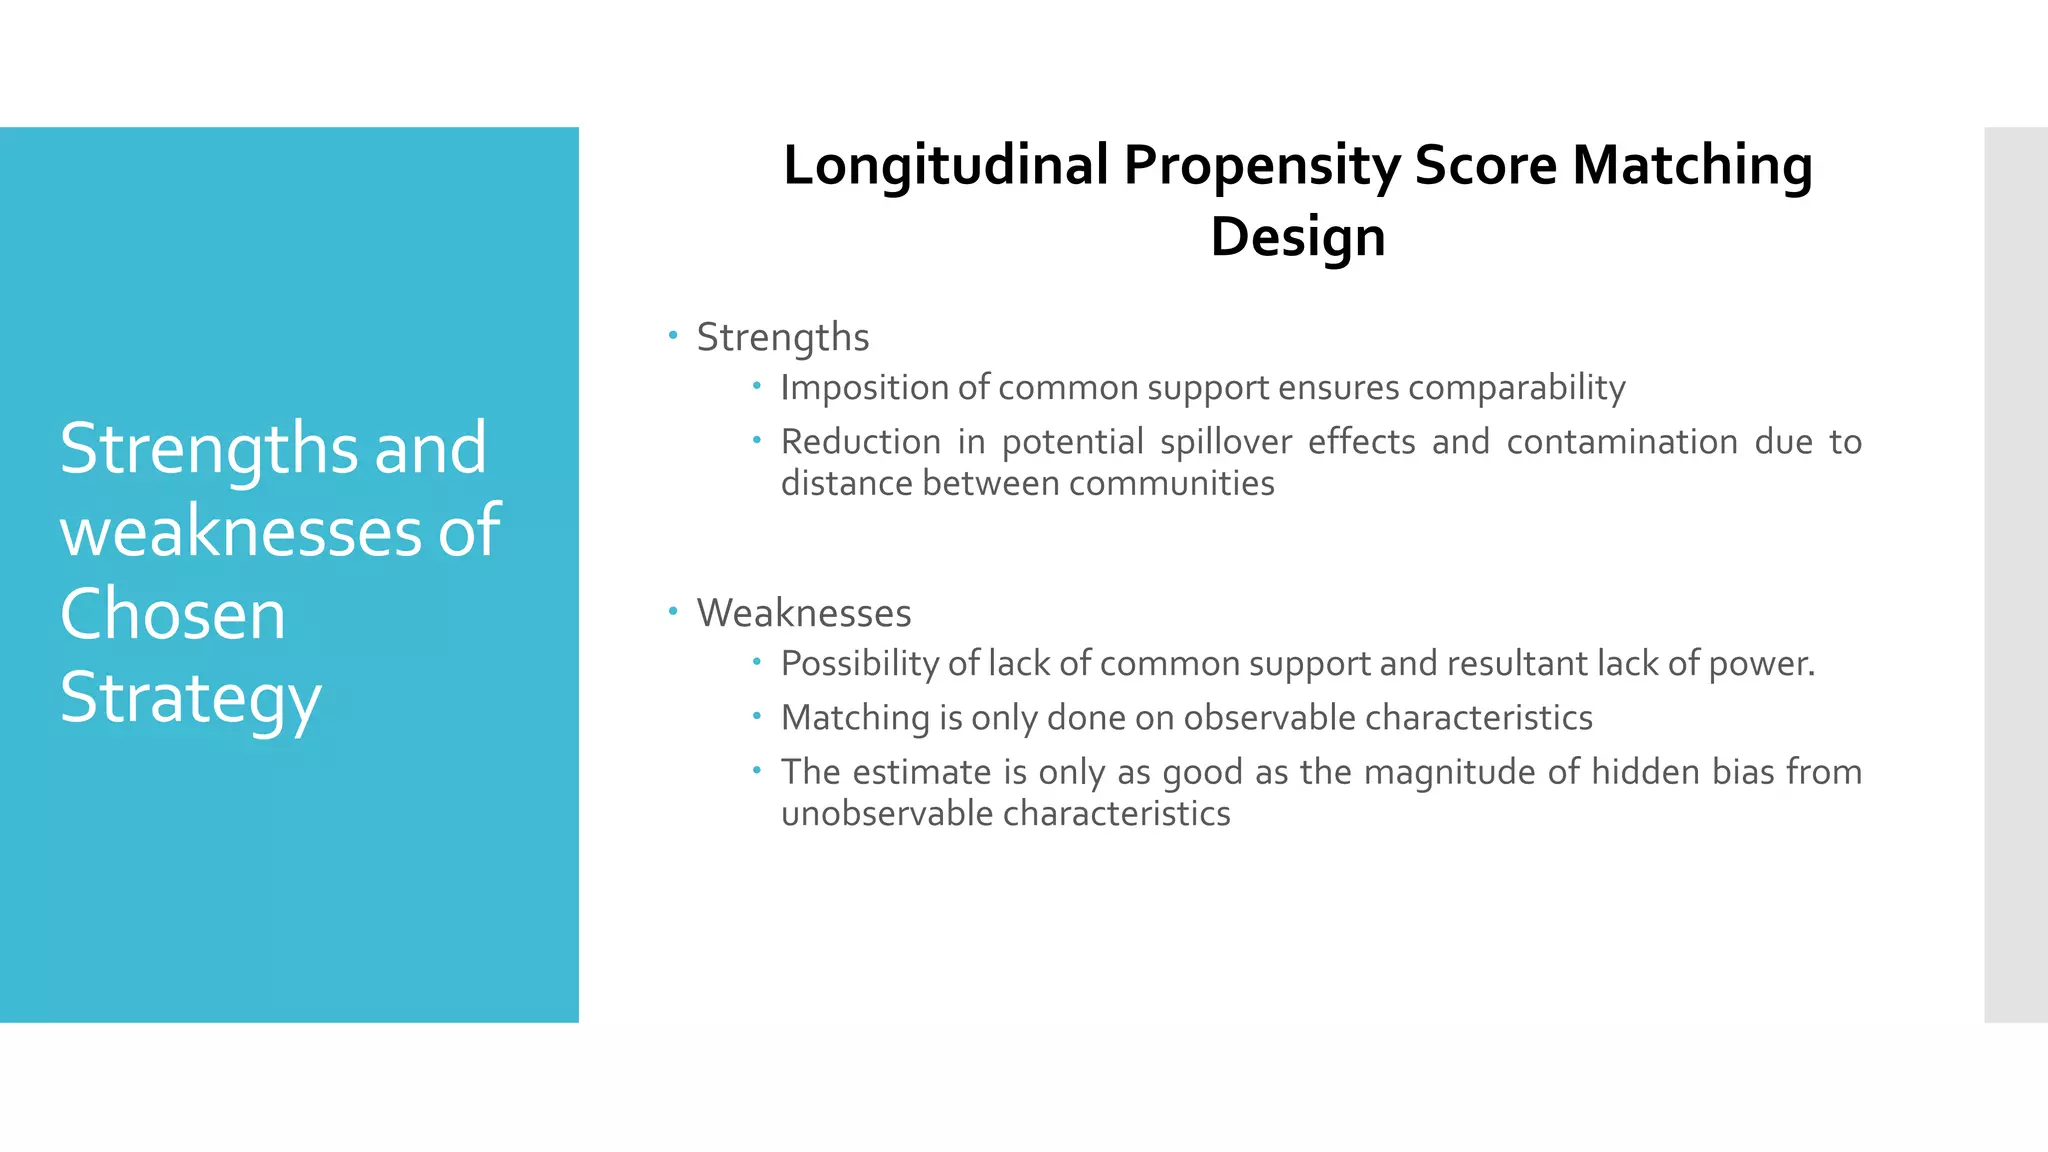


The LEAP program in Ghana provides unconditional cash transfers to ultra-poor households with specific demographic characteristics and aims to evaluate its impact on food security, strengthened livelihoods, and child school enrollment. The evaluation will employ a longitudinal propensity score matching design due to government reluctance for randomized controlled trials, using comparison communities to assess treatment effects. The study's duration is proposed to be 18 months post-implementation to capture measurable outcomes.


