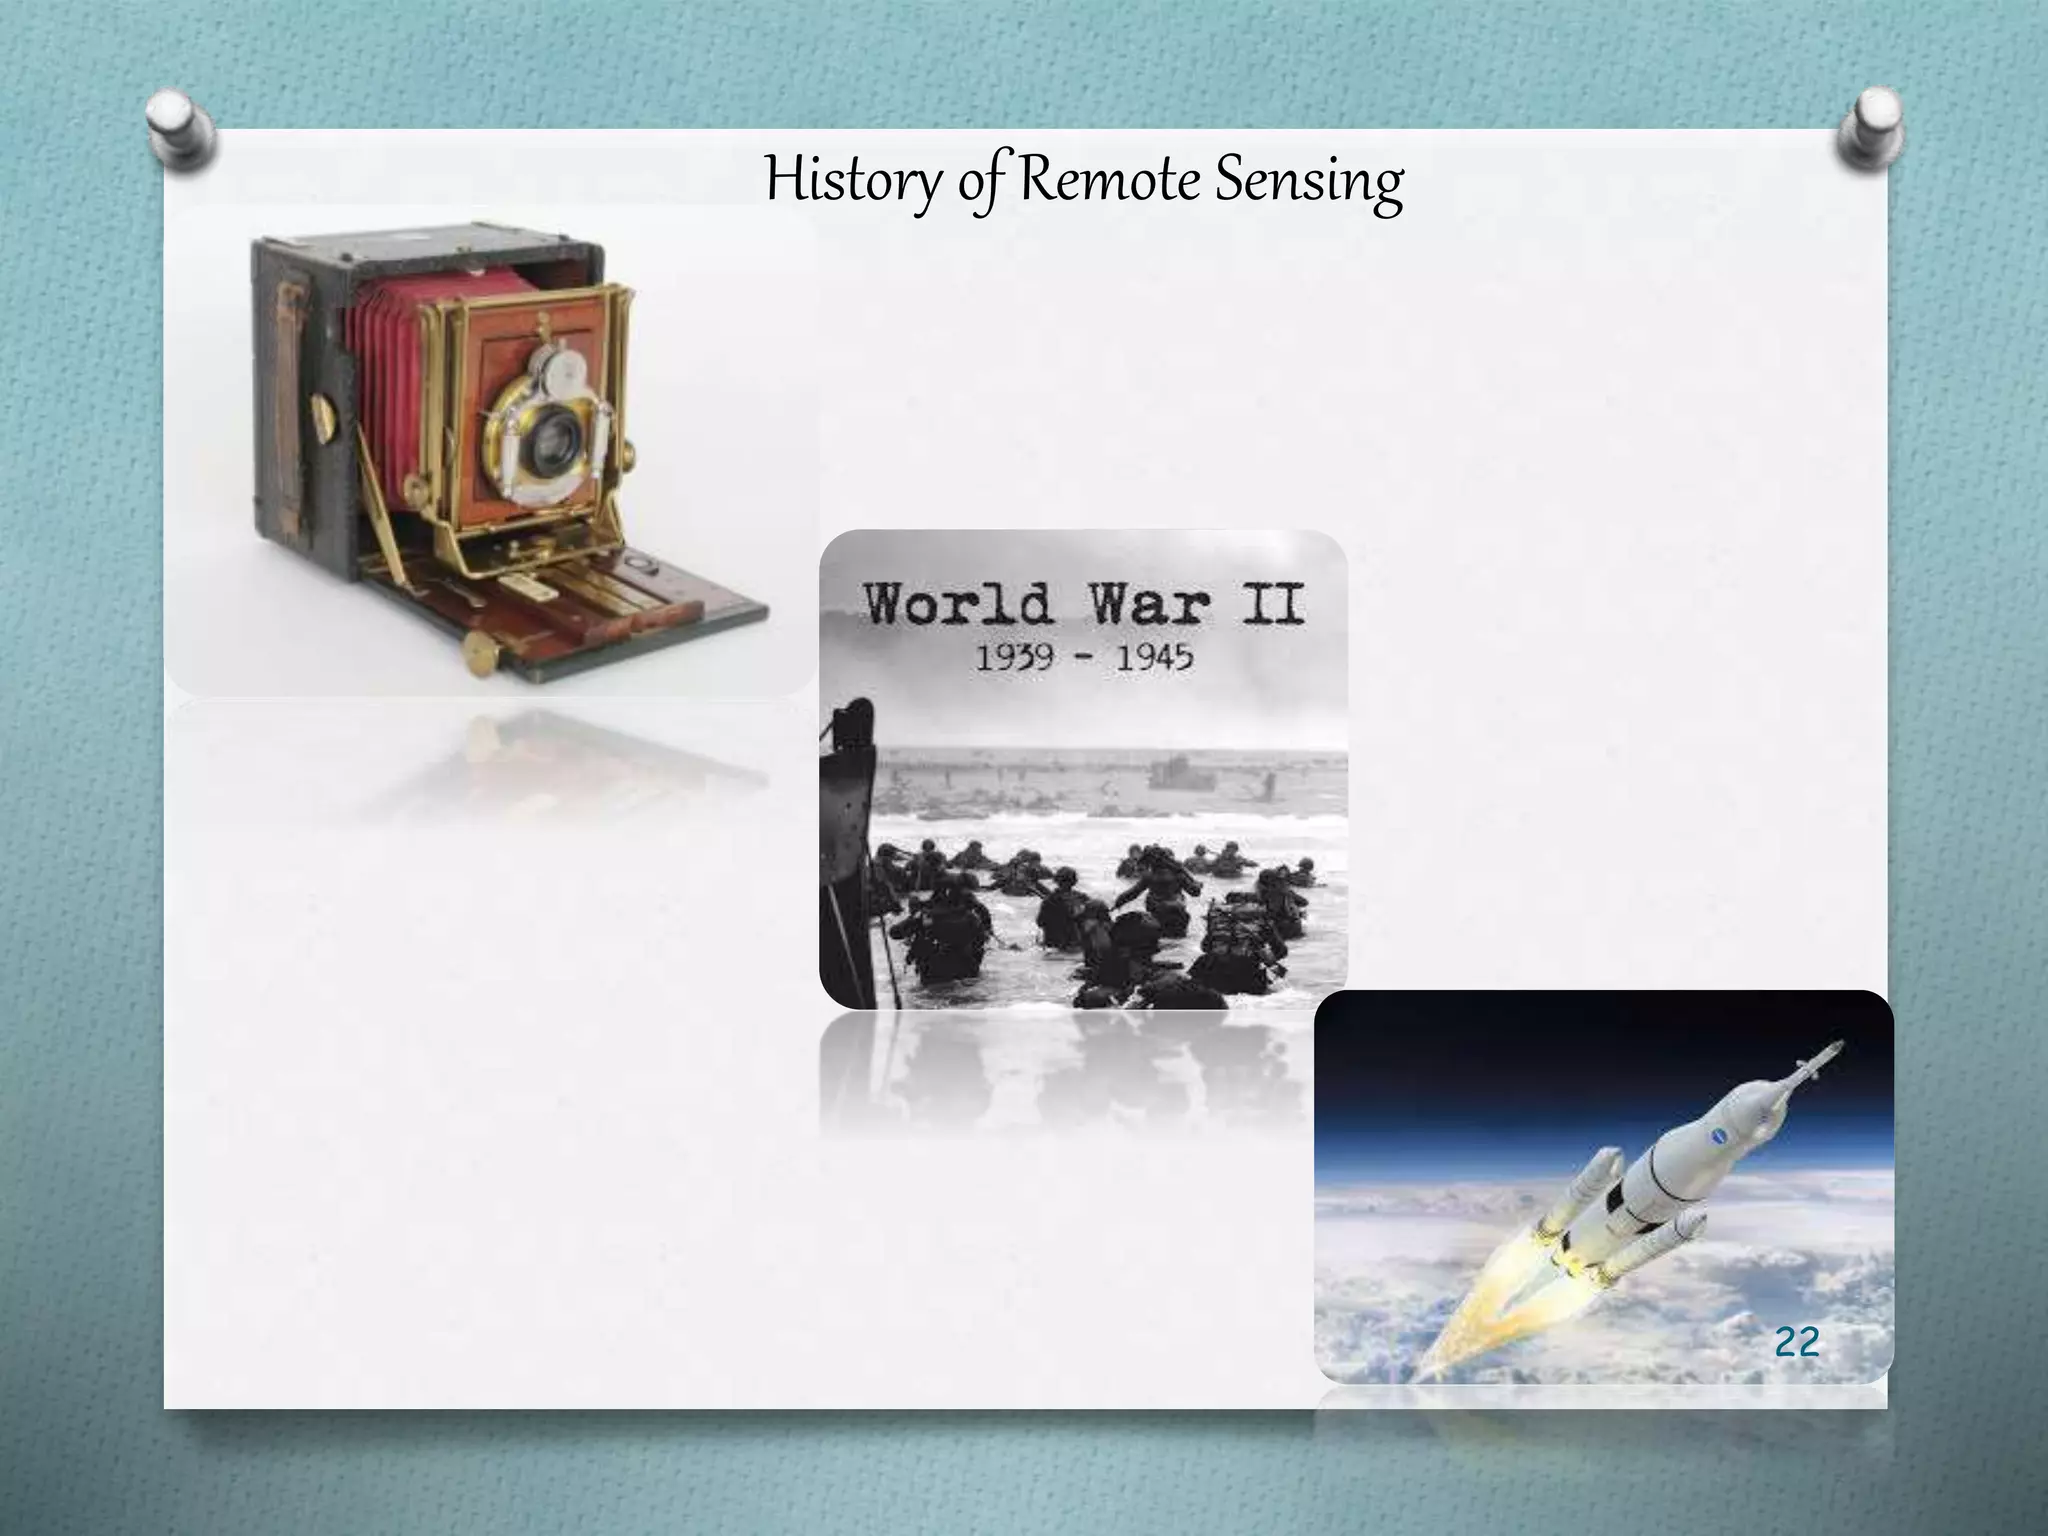
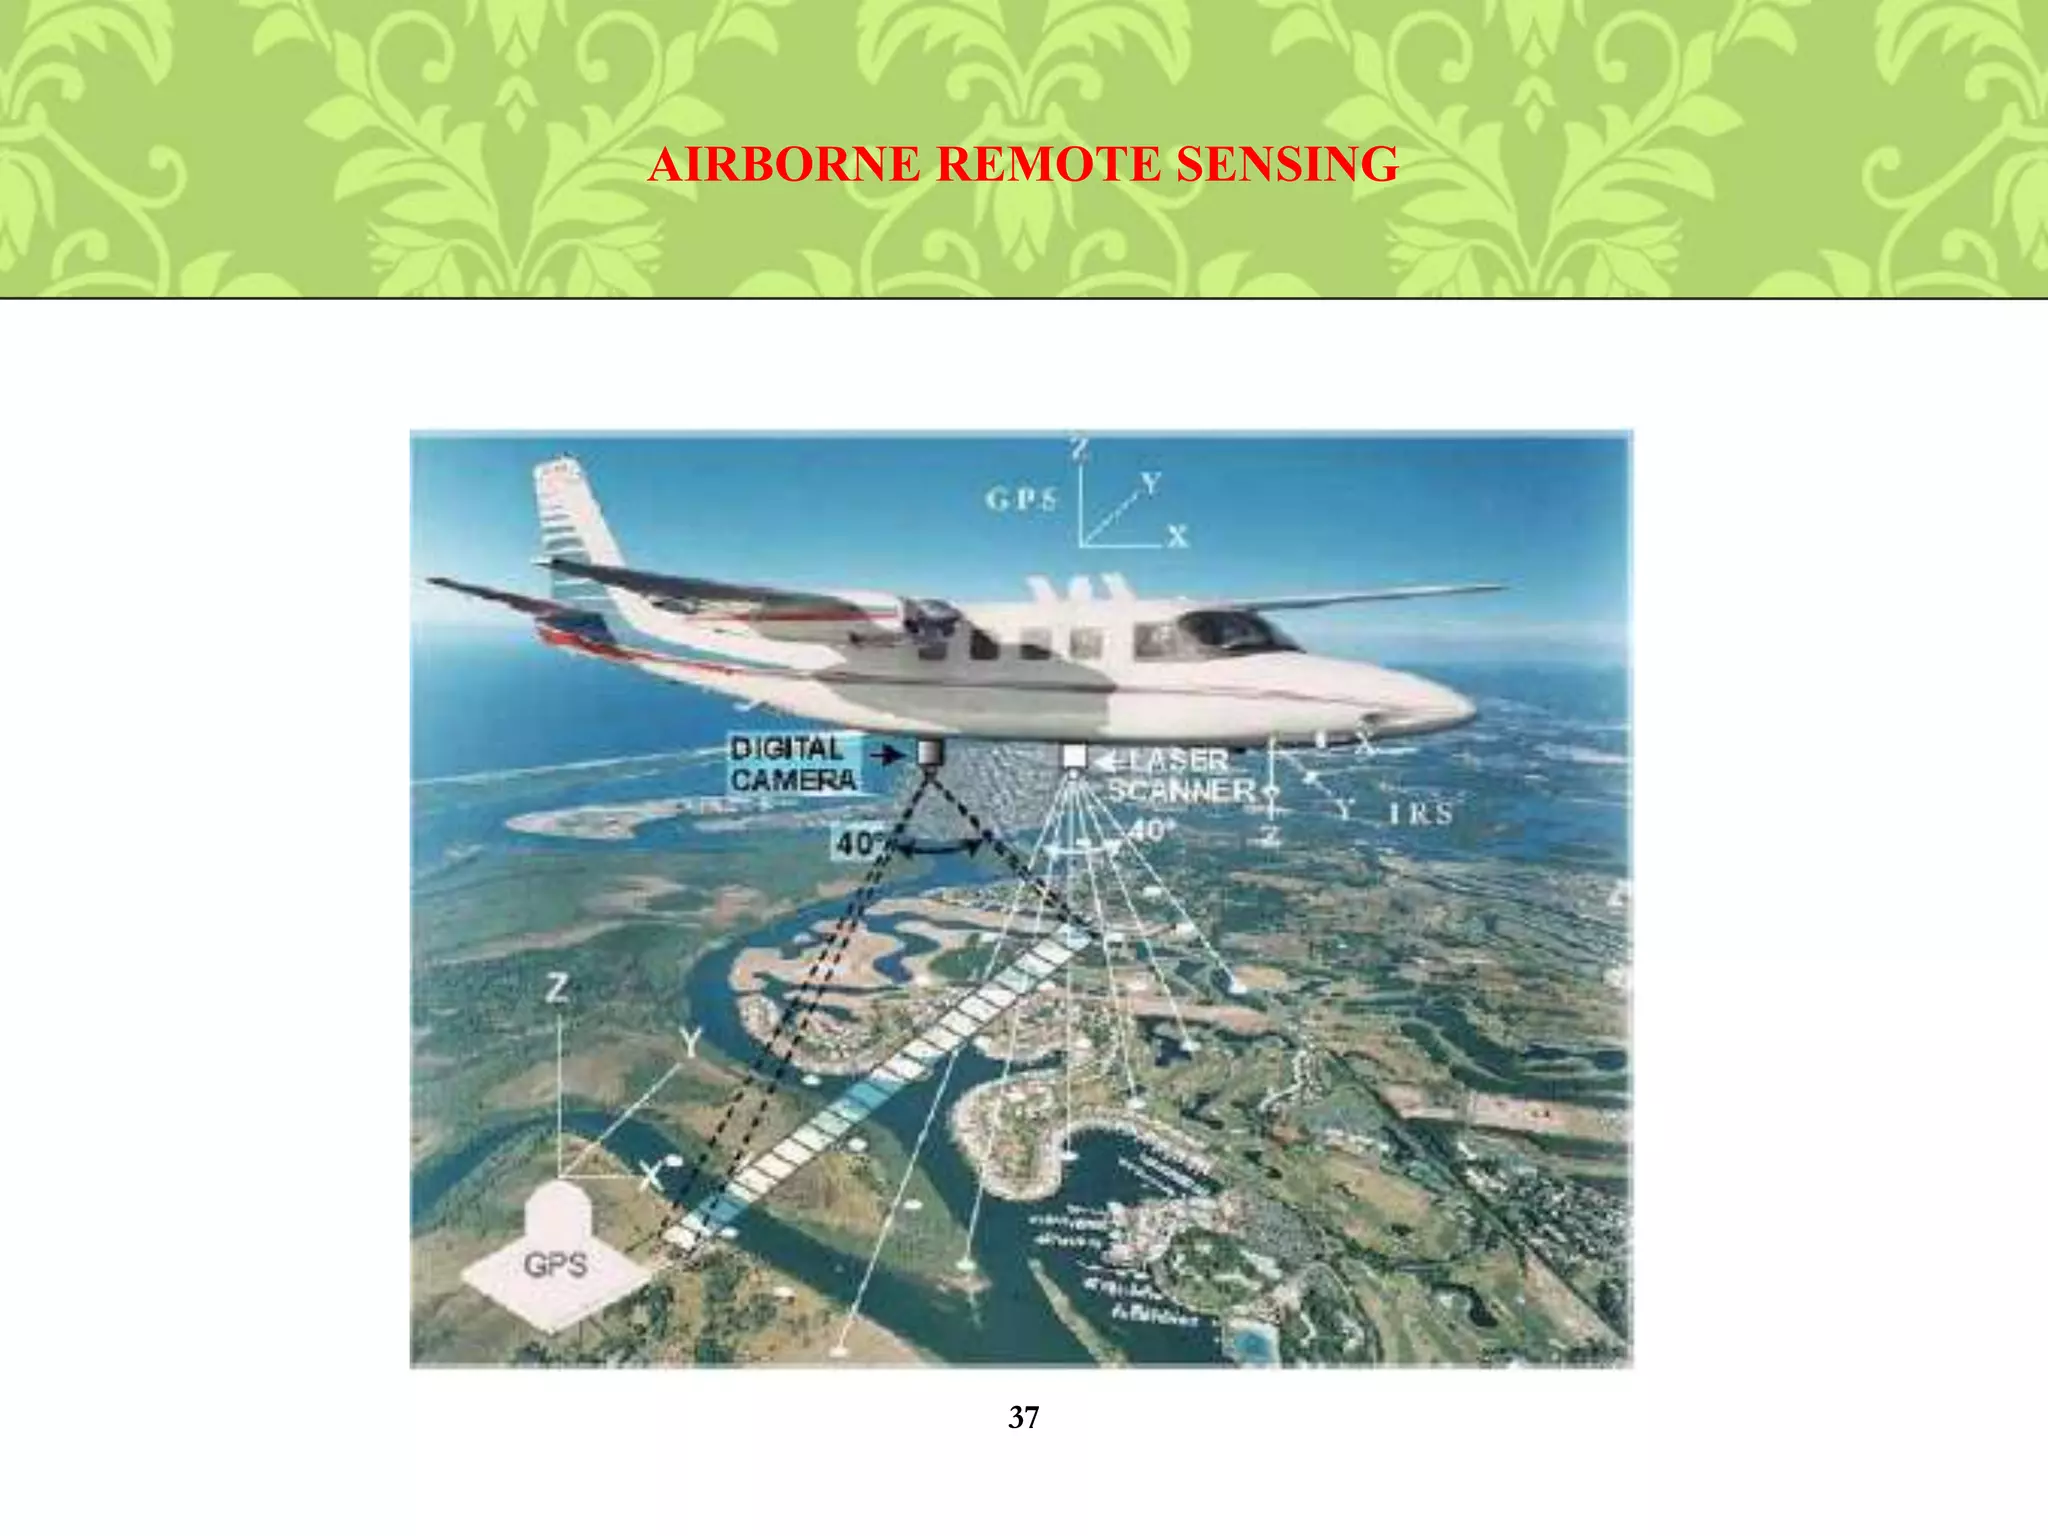
SlideShare a Scribd company logo
1 of 79
1
Doctoral seminar
on
Pest surveillance, Remote sensing and
GIS- role in IPM
Course-in-charge
Dr. N. C. Venkateswarlu
Professor and Head
Dept of Entomology
Presented by
V, Shilpakala
TAD/2014-122
1.
• Introduction
2.
• Pest surveillance
3.
• Remote sensing
4.
• GIS
5.
• Conclusion
3
Pest surveillance
Monitoring pests and their natural enemies is a fundamental tool
in IPM - for taking management decision
Remote sensing
Collection of remotely sensed data.
GIS
Collection of both hardware and software for dealing with spatial
information.
1. Introduction
4
2. Pest Surveillance
O Refers to the constant watch on the population dynamics
of pests, its incidence and damage on each crop at fixed
intervals to forewarn the farmers to take up timely crop
protection measures.
5
Three basic components of pest surveillance are
O Determination of
a. the level of incidence of the pest species
b. the loss caused by the incidence
c. the economic benefits, the control will provide.
6
Objectives of Pest Surveillance
O to know existing and new pest species
O to assess pest population and damage at different
growth stage of crop
O to study the influence of weather parameters on
pest
O to study changing pest status (minor to major)
O to assess natural enemies and their influence on
pests
O effect of new cropping pattern and varieties on pest
7
Survey
An official procedure conducted over a
defined period of time to determine the
characteristics of a pest population or to
determine which pest species occur in an area
(ISPM No. 5)
8
Roving survey
O Assessment of pest population/damage from
randomly selected spots representing larger
area.
O Provides information on pest level over large
area.
O Large area surveyed in short period
9
Fixed plot survey
O Assessment of pest population/damage from a fixed plot selected in a
field.
O The data on pest population/damage recorded periodic from sowing
till harvest. e.g. plots randomly selected from in
of crop area in case of
From each plot 10 plant selected at random.
O Total tillers and tillers affected - in these 10 plants counted.
O Total leaves and number affected - ( % damaged leaves).
O Population of - number/tiller.
10
Other types of survey
O Qualitative survey - Useful for detection of
pest
O Quantitative survey - Useful for enumeration
of pest
According to ISPM definitions,
O detection,
O monitoring
O delimiting surveys.
11
Pest Survey Sites
O Reported presence and distribution of the
pest.
O Biology of the pest.
O Distribution of host plants of the pest and
especially of their areas of commercial
production.
O Climatic suitability of sites for the pest.
12
Timing of survey procedures may be
determined by:
• Life cycle
• Phenology of the pest and its hosts
• Pest management programmes
• Whether the pest is best detected on crops in
active growth or in the harvested crop.
13
Sampling Techniques
O Absolute sampling - To count all the pests
occurring in a plot
O Relative sampling - To measure pest in terms
of some values which can be compared over
time and space e.g. Light trap catch,
Pheromone trap
14
O Methods of sampling
a. In situ counts - Visual observation on number of insects
on plant canopy (either entire plot or randomly selected plot)
b. Knock down - Collecting insects from an area by
removing from crop and (Sudden trap) counting (Jarring)
c. Netting - Use of sweep net for hoppers, odonates,
grasshoppers.
d. Norcotised collection - Quick moving insects
anaesthesised and counted
15
e. Trapping - Light trap - Phototropic insects
O Pheromone trap - Species specific
O Sticky trap - Sucking insects
O Bait trap - Sorghum shootfly - Fishmeal trap
O Emergence trap - For soil insects
f. Crop samples
Plant parts removed and pest counted
e.g. Bollworms
O Stage of Sampling
O Sample Size
16
Pest Negligible% Low Moderate Severe Very severe
Leaf miner < 1 % 1-5 % 6-15 % 16-30 % > 30 %
Butterfly < 1 % 1-5 % 6-10 % 11-15 % > 15 %
Survey and surveillance of insect pests and their natural enemies in
acid lime ecosystems of south coastal Andhra Pradesh
Sreedevi (2010)
17
Scoring of population/damage levels of major acid lime insect pests
Pest Management in Horticultural Ecosystems, 16(2): 131-135
18
Pest management in horticultural ecosystems, 16(2): 131-135
Pest Management in Horticultural Ecosystems, 16(2): 131-135
19
DRR Annual progress report 2013, vol.2-
Entomology
O BPH- 24 centers with maximum 54528
insects/week- during 47th week at Raipur.
O WBPH- 21 centers (5683 insects/week)-
during 42nd week at Gangavathi.
O Planthoppers continue to be second major
pests.
20
The art and science of obtaining information
about an object, area or phenomenon through the analysis
of data acquired by a device that is not in contact with
the object under investigation (Lillesand et al., 2004)
21
History of Remote Sensing
22
History of Remote Sensing
O first meteorological satellite was launched by US on 1st
April, 1960 for weather forecast, movement of hurricanes
and other associated uses. It was named as earth resources
technology satellite (ERTS) – well suited for agricultural
responses.
O These satellites are now referred to as LAND SAT.
O First remote sensing satellite in India was launched in 1988,
named as IRS(Indian Remote Sensing).
23
Areas of
APPLICATION
O Geology
O Hydrology
O Sea Ice
O Land Cover & Land Use
O Mapping
O Oceans & Coastal Monitoring
OAgriculture
OForestry
24
Agriculture
• Crop acreage estimation
• Crop modeling for yield & production
forecast / estimation
• Crop & Orchard monitoring
Scope
• Timely availability of crop statistics
for decision making & planning
• Crop growth monitoring
• Soil status monitoring
• Regular reports regarding total area
under cultivation
Benefits
Banana Plantation – Muhammad Pur (Ghotki)
Mar 05, 2006, RecoveryJan 12, 2006, DamageDec 16, 2005, Pre-Frost
25
Forestry
• Satellite image based forest
resource mapping and updation
• Forest change detection
• Forest resource inventory
• GIS database development
Scope
• Availability of baseline information
• Planning for afforestation strategies
• Futuristic resource planning
• Sustainability of environment
• Wild life conservation & development.
Benefits
Sarhad Reserve Forest (Ghotki)
26
Types of REMOTE SENSING
Active Remote Sensing
Passive Remote Sensing
27
Types of Remote Sensing Platforms
O field-based (ground based),
O mounted on aircraft(airborne)
O satellites (space borne).
28
Ground based
O Spectroradiometry is the technique of measuring the
spectrum of radiation emitted by a source.
O In order to do this the radiation must be separated
into its component wavebands and each band
measured separately.
O It is achieved by diffraction grating technique
within the spectroradiometers to split the radiation
entering the system into its constituent wavebands.
O A suitable detector is then used to quantify the
radiation of each wavelength (ASD 1999 ) .
29
30
31
Concept
Stresses interferes with photosynthesis
and physical structure of the plant (Hatfield and
Pinter, 1993).
O causes changes in pigment, chemical
concentrations, cell structure, nutrient, water
uptake, and gas exchange. (Raikes and Burpee
1998).
32
Spectral response
REMOTE SENSING DATA
33
REFLECTANCE IN
VEGETATION
34
Typical spectral reflectance curve of healthy vegetation depicting
different absorption peaks
35
• Downward or sideward looking sensors are mounted on an
aircraft to obtain images of the earth's surface.
• It has the capability of offering very high spatial resolution
images.
• But low coverage area and high cost per unit area of ground
coverage.
• It is not cost-effective to map a large area using an airborne
remote sensing system.
• Airborne remote sensing missions are often carried out as
one-time operations, whereas earth observation satellites offer
the possibility of continuous monitoring of the earth.
AIRBORNE REMOTE SENSING
36
AIRBORNE REMOTE SENSING
37
Spaceborne remote sensing
O In spaceborne remote sensing, sensors are
mounted on-board a spacecraft (space shuttle
or satellite) orbiting the earth.
O The geostationary orbits are commonly used
by meterological satellites.
O Located at a high altitude of 36,000 km.
38
Spaceborne remote sensing provides the
following advantages:
O Large area coverage.
O Frequent and repetitive coverage of an area of
interest.
O Quantitative measurement of ground features using
radiometrically calibrated sensors.
O Semiautomated computerised processing and
analysis.
O Relatively lower cost per unit area of coverage.
39
Optical/thermal imaging systems can be classified
according to the number of spectral bands used:
O Monospectral or panchromatic (single wavelength
band, "black-and-white", grey-scale image) systems
O Multispectral (several spectral bands) systems
O Superspectral (tens of spectral bands) systems
O Hyperspectral (hundreds of spectral bands) systems
40
41
• A hyperspectral image consists of about a hundred or
more contiguous spectral bands.
• Applications in fields such as precision agriculture
(e.g. monitoring the types, health, moisture status
and maturity of crops), coastal management (e.g.
monitoring of phytoplanktons, pollution).
• Currently, hyperspectral imagery is not commercially
available from satellites.
• There are experimental satellite-sensors that acquire
hyperspectral imagery for scientific investigation
(e.g. NASA's Hyperion sensor on-board the EO1
satellite, CHRIS sensor on board ESA's PRABO
satellite).
HYPERSPECTRAL IMAGE
42
Multispectral Images
• A multispectral imagery consists of several bands of
data. For visual display, each band of the image may be
displayed one band at a time as a grey scale image, or in
combination of three bands at a time as a colour
composite image.
• Interpretation of a multispectral colour composite image
will require the knowledge of the spectral reflectance of
the targets in the scene.
43
BOTTOM VIEW OF MS4100 MULTI-SPECTRAL CAMERA (A) AND
REGULAR DIGITAL RGB CAMERA (B) ON CESSNA 206.
44
DISADVANTAGES OF REMOTE SENSING
 Expensive to build and operate!!!!
 Measurement uncertainty can be large
 Data interpretation can be difficult
 need to understand theoretically how the instrument is
making the measurements
 need to understand measurement uncertainties
 need to have some knowledge of the phenomena you
are sampling
45
GEOGRAPHIC implies that locations of the data items are
known, or can be calculated, in terms of Geographic
coordinates (Latitude, Longitude)
INFORMATION implies that the data in a GIS are
organized to yield useful knowledge, often as coloured maps
and images, but also as statistical graphics, tables, and
various on-screen responses to interactive queries.
SYSTEM implies that a GIS is made up from several inter-
related and linked components with different functions.
Thus, GIS have functional capabilities for data capture, input,
manipulation, transformation, visualization, combinations,
query, analysis, modelling and output.
WHAT IS A GIS ?
46
3. GIS
O Geographic Information System
O A GIS is a computer system capable of capturing,
storing, analyzing, and displaying geographically
referenced information; that is, data identified according
to location.
O Practitioners also define a GIS as including the
procedures, operating personnel, and spatial data that go
into the system.
47
TheHistory
• First developed in North America, particularly the
U.S. and Canada in the mid-1960s
• Previously been used in natural resources and
environmental research.
48
GIS: OLD AND NEW
Traditional GIS
MAP TYPEWRITER
MANUAL DRAFTING
TOOLS
New GIS
COMPUTER
PLOTTER CD-ROM
49
50
GPS device
It is a device which uses 24
satellites orbiting at 24,200
km above earth to find
latitudes, longitudes and
altitude of any location on
the earth.
• For a forest manager to optimize timber production
• For a geologist to identify the best site to construct dam
• For a geoinformatics engineer to establish a relay station
Unlimited applications…
• Site suitability
• Erosion modeling
• Civil engineering
• Urban planning
• Forestry
• Environmental management
• Natural disaster management
• Biology
• Geology
• Mining
• Hydrology….
GIS APLLICATIONS
51
•Data Acquisition and processing
•Database Management and Retrieval
•Spatial Measurement and Analysis
•Graphic output and Visualization
Basic functions of GIS
52
SPATIAL DATA
Raster
Vecto
r
DATA MODELAND STRUCTURE
RASTER MODEL VECTOR MODEL
53
PROCESS OF IMAGE
INTERPRETATION
54
55
56
57
58
59
60
Hyperspectral radiometry for the detection and
discrimination of damage caused by sucking pests of cotton
61
Sensitivity curves of damaged and undamaged cotton plants
Thrips damaged Leaf hopper damaged Aphids damaged
Ranjitha and Srinivasan, 2014
Current biotica 8(1): 5-12.
Spectral and spatial properties of rice brown
plant hopper and groundnut late leaf spot
disease infestation under field conditions
Prabhakar et al., 2013
62
Multispectral reflectance of rice plants with
different levels of BPH severity
63
Journal of Agrometeorology 15 (Special Issue-I) : 57-62(March 2013)
Classified satellite image depicting BPH damage in east
godavari district, A.P. During 2007
64
Journal of Agrometeorology 15 (Special Issue-I) : 57-62(March 2013)
DIFFERENTIATING STRESS INDUCED BY GREENBUGS AND
RUSSIAN WHEAT APHIDS IN WHEAT USING REMOTE SENSING
Green bug Russian wheat aphid
Older leaves Younger leaves
Less visible More visible
Chlorophyll a reduced than b Both a and b reduced
No impact on carotenoids Sig. loss of carotenoids
Decreased
Reflectance in NIR(cellular lysis)
Increased in NIR (low water
content)
Computers and Electronics in Agriculture 67 :64–70
Yang et al. (2009)
65
Use of ground based hyperspectral remote
sensing for detection of stress in cotton caused
by leafhopper (Hemiptera: Cicadellidae)
Prabhakar et al., 2011
66
Reflectance spectra of cotton plants infested by leafhopper at different levels of
infestation (Grade 0, healthy; Grade 1, lowest; Grade 4, highest
Computers and Electronics in Agriculture 79 :189–198
67
Using ground-based multispectral radiometry to detect
stress in wheat caused by greenbug (Homoptera:
Aphididae) infestation
Computers and Electronics in Agriculture 47 (2005) 121–135
Yang et al.,2005
• Out breaks appear every year
• Early detection – critical part of IPM
• Hand held Cropscan Radiometer MSR 16R
• Band centered at 694 nm and vegetative
index from bands centered at 800 to 694-
identified as sensitive to damage.
68
Computers and Electronics in Agriculture 97 : 61–70
69
Prabhakar et al., 2013
MEAN REFLECTANCE SPECTRA OF COTTON PLANTS UNDER DIFFERENT GRADES
OF MEALYBUG INFESTATION70
Hyperspectral detection of rice damaged by rice leaf folder
(Cnaphalocrocis medinalis)
Computers and Electronics in Agriculture 82 : 100–107
Jianrong Huang et al. (2012)
71
Automatic identification and counting of small size pests in
greenhouse conditions with low computational cost
Ecological Informatics 72
73
A new invasive insect in Sweden – Physokermes inopinatus: Tracing
forest damage with satellite based remote sensing
• MODIS data
• SPOT data
• Associated black encrustation absorbs light in
the red band and cancels out the increased
reflectance of the damaged needles.
74
Forest Ecology and Management 285: 29–37
Olsson et al., 2012
A and B shows spruce forest infested by P. inopinatus
and sooty mold
75
Coupling historical prospection data and a remotely-sensed vegetation
index for the preventative control of desert locusts
Basic and Applied Ecology 14 : 593–604
Cyril Piou et al., 2013
. Black pixels represent NDVI values = 0, lighter pixels indicate NDVI-values >0
the Akjoujt area between 2001 and 2009the Aioun area between 2001 and 2009
76
• Monitoring is backbone of IPM. Farmer must keep continuous
vigilance on pest activity on crops.
• Monitoring helps in issuing forewarning and facilitates proper timing
of plant protection measures thereby preventing avoidable losses and
environmental contamination, and ensuring favourable benefit-cost.
• Remote sensing technique is very useful, less time consuming and cost
effective tool for suggesting action plans /management strategies for
agricultural sustainability of any region.
77
• Remotely sensed images can be used to identify nutrient deficiencies,
diseases, water deficiency or surplus, weed infestations, insect damage,
hail damage, wind damage, herbicide damage, and plant populations
• GIS is considered one of the important tools for decision making in
problem solving environment dealing with geo-information.
78
79

More Related Content

What's hot

Successful case studies of national as well as international IPM programmes
Successful case studies of national as well as international IPM programmesSuccessful case studies of national as well as international IPM programmes
Successful case studies of national as well as international IPM programmessharanabasapppa
 
pest forecasting models
pest forecasting modelspest forecasting models
pest forecasting modelsBhanu Pratap
 
forecasting model for insect pest
forecasting model for insect pestforecasting model for insect pest
forecasting model for insect pestShweta Patel
 
ENTOMOPATHOGENIC NEMATODES
ENTOMOPATHOGENIC NEMATODES       ENTOMOPATHOGENIC NEMATODES
ENTOMOPATHOGENIC NEMATODES Om Prakash
 
Ecological principles of IPM
Ecological principles of IPMEcological principles of IPM
Ecological principles of IPMHARISH J
 
Advances in artificial diets for mass rearing of natural enemies
Advances in artificial diets for mass rearing of natural enemiesAdvances in artificial diets for mass rearing of natural enemies
Advances in artificial diets for mass rearing of natural enemiesPrudhiviVijayBabu
 
Pest risk analysis
Pest risk analysisPest risk analysis
Pest risk analysisDevina Seram
 
Pesticide formulation and calculation.ppt
Pesticide formulation and calculation.pptPesticide formulation and calculation.ppt
Pesticide formulation and calculation.pptrzguru
 
Insect Behaviour in IPM_S.Srinivasnaik_RAD21-25.ppt
Insect Behaviour in IPM_S.Srinivasnaik_RAD21-25.pptInsect Behaviour in IPM_S.Srinivasnaik_RAD21-25.ppt
Insect Behaviour in IPM_S.Srinivasnaik_RAD21-25.pptAsst Prof SSNAIK ENTO PJTSAU
 
Invasive pests in India
Invasive pests in IndiaInvasive pests in India
Invasive pests in IndiaGopi Anand
 
Computer programming in ipm
Computer programming in ipm Computer programming in ipm
Computer programming in ipm sankar kavadana
 
Role of Semiochemicals in Tritrophic Interaction (Bhubanananda Adhikari)
Role of Semiochemicals in Tritrophic Interaction (Bhubanananda Adhikari)Role of Semiochemicals in Tritrophic Interaction (Bhubanananda Adhikari)
Role of Semiochemicals in Tritrophic Interaction (Bhubanananda Adhikari)Bhubanananda Adhikari
 
category of insect pest
category of insect pestcategory of insect pest
category of insect pestNavneet Mahant
 
Host plant resistance
Host plant resistanceHost plant resistance
Host plant resistanceSnehal mane
 
Remote sensing APPLICATIONS IN PLANT PATHOLOGY.
Remote sensing APPLICATIONS IN PLANT PATHOLOGY.Remote sensing APPLICATIONS IN PLANT PATHOLOGY.
Remote sensing APPLICATIONS IN PLANT PATHOLOGY.Ayush Mishra
 

What's hot (20)

Successful case studies of national as well as international IPM programmes
Successful case studies of national as well as international IPM programmesSuccessful case studies of national as well as international IPM programmes
Successful case studies of national as well as international IPM programmes
 
pest forecasting models
pest forecasting modelspest forecasting models
pest forecasting models
 
diagnosis of pest
diagnosis of pestdiagnosis of pest
diagnosis of pest
 
forecasting model for insect pest
forecasting model for insect pestforecasting model for insect pest
forecasting model for insect pest
 
ENTOMOPATHOGENIC NEMATODES
ENTOMOPATHOGENIC NEMATODES       ENTOMOPATHOGENIC NEMATODES
ENTOMOPATHOGENIC NEMATODES
 
Ecological principles of IPM
Ecological principles of IPMEcological principles of IPM
Ecological principles of IPM
 
Advances in artificial diets for mass rearing of natural enemies
Advances in artificial diets for mass rearing of natural enemiesAdvances in artificial diets for mass rearing of natural enemies
Advances in artificial diets for mass rearing of natural enemies
 
Biorationals
BiorationalsBiorationals
Biorationals
 
What are Insect Pheromone Traps
What are Insect Pheromone TrapsWhat are Insect Pheromone Traps
What are Insect Pheromone Traps
 
Pest risk analysis
Pest risk analysisPest risk analysis
Pest risk analysis
 
Pesticide formulation and calculation.ppt
Pesticide formulation and calculation.pptPesticide formulation and calculation.ppt
Pesticide formulation and calculation.ppt
 
Pest risk analysis
Pest risk analysisPest risk analysis
Pest risk analysis
 
Insect Behaviour in IPM_S.Srinivasnaik_RAD21-25.ppt
Insect Behaviour in IPM_S.Srinivasnaik_RAD21-25.pptInsect Behaviour in IPM_S.Srinivasnaik_RAD21-25.ppt
Insect Behaviour in IPM_S.Srinivasnaik_RAD21-25.ppt
 
Invasive pests in India
Invasive pests in IndiaInvasive pests in India
Invasive pests in India
 
Computer programming in ipm
Computer programming in ipm Computer programming in ipm
Computer programming in ipm
 
Role of Semiochemicals in Tritrophic Interaction (Bhubanananda Adhikari)
Role of Semiochemicals in Tritrophic Interaction (Bhubanananda Adhikari)Role of Semiochemicals in Tritrophic Interaction (Bhubanananda Adhikari)
Role of Semiochemicals in Tritrophic Interaction (Bhubanananda Adhikari)
 
Pramod seminar checked
Pramod seminar checkedPramod seminar checked
Pramod seminar checked
 
category of insect pest
category of insect pestcategory of insect pest
category of insect pest
 
Host plant resistance
Host plant resistanceHost plant resistance
Host plant resistance
 
Remote sensing APPLICATIONS IN PLANT PATHOLOGY.
Remote sensing APPLICATIONS IN PLANT PATHOLOGY.Remote sensing APPLICATIONS IN PLANT PATHOLOGY.
Remote sensing APPLICATIONS IN PLANT PATHOLOGY.
 

Viewers also liked

Remote sensing application in agriculture & forestry_Dr Menon A R R (The Kera...
Remote sensing application in agriculture & forestry_Dr Menon A R R (The Kera...Remote sensing application in agriculture & forestry_Dr Menon A R R (The Kera...
Remote sensing application in agriculture & forestry_Dr Menon A R R (The Kera...India Water Portal
 
Application of gis and remote sensing in agriculture
Application of gis and remote sensing in agricultureApplication of gis and remote sensing in agriculture
Application of gis and remote sensing in agricultureRehana Qureshi
 
REMOTE SENSING
REMOTE SENSINGREMOTE SENSING
REMOTE SENSINGKANNAN
 
Remote Sensing PPT
Remote Sensing PPTRemote Sensing PPT
Remote Sensing PPTAmal Murali
 
Application of remote sensing in agriculture
Application of remote sensing in agricultureApplication of remote sensing in agriculture
Application of remote sensing in agriculturevajinder kalra
 
Intro to GIS and Remote Sensing
Intro to GIS and Remote SensingIntro to GIS and Remote Sensing
Intro to GIS and Remote SensingJohn Reiser
 
GIS application in Natural Resource Management
GIS application in Natural Resource ManagementGIS application in Natural Resource Management
GIS application in Natural Resource ManagementAchal Gupta
 
Application of gis in natural disaster management
Application of gis in natural disaster managementApplication of gis in natural disaster management
Application of gis in natural disaster managementMuhammad Sajjad
 
Disaster management using Remote sensing and GIS
Disaster management using Remote sensing and GISDisaster management using Remote sensing and GIS
Disaster management using Remote sensing and GISHarsh Singh
 
Gis Applications Presentation
Gis Applications PresentationGis Applications Presentation
Gis Applications PresentationIdua Olunwa
 
APPLICATIONS OF REMOTE SENSING AND GIS IN WATERSHED MANAGEMENT
APPLICATIONS OF REMOTE SENSING AND GIS IN WATERSHED MANAGEMENTAPPLICATIONS OF REMOTE SENSING AND GIS IN WATERSHED MANAGEMENT
APPLICATIONS OF REMOTE SENSING AND GIS IN WATERSHED MANAGEMENTSriram Chakravarthy
 
Ppt on remote sensing system
Ppt on remote sensing systemPpt on remote sensing system
Ppt on remote sensing systemAlisha Korpal
 
Using GIS and remote sensing in the IPM context of early warning
Using GIS and remote sensing in the IPM context of early warningUsing GIS and remote sensing in the IPM context of early warning
Using GIS and remote sensing in the IPM context of early warningFAO
 
Remote sensing used by FAO DLIS for Desert Locust forecasting
Remote sensing used by FAO DLIS for Desert Locust forecastingRemote sensing used by FAO DLIS for Desert Locust forecasting
Remote sensing used by FAO DLIS for Desert Locust forecastingFAO
 
Global Soil Information Facilities - current status - by H. I. Reuter
Global Soil Information Facilities - current status - by H. I. ReuterGlobal Soil Information Facilities - current status - by H. I. Reuter
Global Soil Information Facilities - current status - by H. I. ReuterFAO
 
I WSF, Brasília - Alan MacLeod - Pest Risk Analysis Research in Europe :Devel...
I WSF, Brasília - Alan MacLeod - Pest Risk Analysis Research in Europe :Devel...I WSF, Brasília - Alan MacLeod - Pest Risk Analysis Research in Europe :Devel...
I WSF, Brasília - Alan MacLeod - Pest Risk Analysis Research in Europe :Devel...Oxya Agro e Biociências
 
Application of GIS in Mine Contamination and Associated Environmental Impacts
Application of GIS in Mine Contamination and Associated Environmental ImpactsApplication of GIS in Mine Contamination and Associated Environmental Impacts
Application of GIS in Mine Contamination and Associated Environmental ImpactsArsalan Syed, PMP
 

Viewers also liked (20)

Remote sensing application in agriculture & forestry_Dr Menon A R R (The Kera...
Remote sensing application in agriculture & forestry_Dr Menon A R R (The Kera...Remote sensing application in agriculture & forestry_Dr Menon A R R (The Kera...
Remote sensing application in agriculture & forestry_Dr Menon A R R (The Kera...
 
Application of gis and remote sensing in agriculture
Application of gis and remote sensing in agricultureApplication of gis and remote sensing in agriculture
Application of gis and remote sensing in agriculture
 
REMOTE SENSING
REMOTE SENSINGREMOTE SENSING
REMOTE SENSING
 
Remote Sensing PPT
Remote Sensing PPTRemote Sensing PPT
Remote Sensing PPT
 
Application of remote sensing in agriculture
Application of remote sensing in agricultureApplication of remote sensing in agriculture
Application of remote sensing in agriculture
 
Intro to GIS and Remote Sensing
Intro to GIS and Remote SensingIntro to GIS and Remote Sensing
Intro to GIS and Remote Sensing
 
GIS IN DISASTER MANAGEMENT
GIS IN DISASTER MANAGEMENTGIS IN DISASTER MANAGEMENT
GIS IN DISASTER MANAGEMENT
 
GIS application in Natural Resource Management
GIS application in Natural Resource ManagementGIS application in Natural Resource Management
GIS application in Natural Resource Management
 
Application of gis in natural disaster management
Application of gis in natural disaster managementApplication of gis in natural disaster management
Application of gis in natural disaster management
 
Disaster management using Remote sensing and GIS
Disaster management using Remote sensing and GISDisaster management using Remote sensing and GIS
Disaster management using Remote sensing and GIS
 
Gis Applications Presentation
Gis Applications PresentationGis Applications Presentation
Gis Applications Presentation
 
APPLICATIONS OF REMOTE SENSING AND GIS IN WATERSHED MANAGEMENT
APPLICATIONS OF REMOTE SENSING AND GIS IN WATERSHED MANAGEMENTAPPLICATIONS OF REMOTE SENSING AND GIS IN WATERSHED MANAGEMENT
APPLICATIONS OF REMOTE SENSING AND GIS IN WATERSHED MANAGEMENT
 
Ppt on remote sensing system
Ppt on remote sensing systemPpt on remote sensing system
Ppt on remote sensing system
 
My ppt on gis
My ppt on gisMy ppt on gis
My ppt on gis
 
Using GIS and remote sensing in the IPM context of early warning
Using GIS and remote sensing in the IPM context of early warningUsing GIS and remote sensing in the IPM context of early warning
Using GIS and remote sensing in the IPM context of early warning
 
Remote sensing used by FAO DLIS for Desert Locust forecasting
Remote sensing used by FAO DLIS for Desert Locust forecastingRemote sensing used by FAO DLIS for Desert Locust forecasting
Remote sensing used by FAO DLIS for Desert Locust forecasting
 
Global Soil Information Facilities - current status - by H. I. Reuter
Global Soil Information Facilities - current status - by H. I. ReuterGlobal Soil Information Facilities - current status - by H. I. Reuter
Global Soil Information Facilities - current status - by H. I. Reuter
 
I WSF, Brasília - Alan MacLeod - Pest Risk Analysis Research in Europe :Devel...
I WSF, Brasília - Alan MacLeod - Pest Risk Analysis Research in Europe :Devel...I WSF, Brasília - Alan MacLeod - Pest Risk Analysis Research in Europe :Devel...
I WSF, Brasília - Alan MacLeod - Pest Risk Analysis Research in Europe :Devel...
 
Application of GIS in Mine Contamination and Associated Environmental Impacts
Application of GIS in Mine Contamination and Associated Environmental ImpactsApplication of GIS in Mine Contamination and Associated Environmental Impacts
Application of GIS in Mine Contamination and Associated Environmental Impacts
 
Freddy Presentation
Freddy PresentationFreddy Presentation
Freddy Presentation
 

Similar to Remote sensing and GIS- role in IPM

Remote Sensing - A tool of plant disease management
Remote Sensing - A tool of plant disease managementRemote Sensing - A tool of plant disease management
Remote Sensing - A tool of plant disease managementAnand Choudhary
 
Application of spectral remote sensing in agronomic decision by Dr.V.Harihara...
Application of spectral remote sensing in agronomic decision by Dr.V.Harihara...Application of spectral remote sensing in agronomic decision by Dr.V.Harihara...
Application of spectral remote sensing in agronomic decision by Dr.V.Harihara...Hari Hariharasudhan
 
Identification and Evaluation of Cercospora Leaf Spot of Sugar Beet by using ...
Identification and Evaluation of Cercospora Leaf Spot of Sugar Beet by using ...Identification and Evaluation of Cercospora Leaf Spot of Sugar Beet by using ...
Identification and Evaluation of Cercospora Leaf Spot of Sugar Beet by using ...ahmedameen85
 
TEMPORAL AND SPATIAL VARIABILITY IN PLANT PATHOENS.pptx
TEMPORAL AND SPATIAL VARIABILITY IN PLANT PATHOENS.pptxTEMPORAL AND SPATIAL VARIABILITY IN PLANT PATHOENS.pptx
TEMPORAL AND SPATIAL VARIABILITY IN PLANT PATHOENS.pptxsunilsuriya1
 
Seminar on 'Remote Sensing, Drone in Agriculture'
Seminar on 'Remote Sensing, Drone in Agriculture'Seminar on 'Remote Sensing, Drone in Agriculture'
Seminar on 'Remote Sensing, Drone in Agriculture'AkshayShrivastav9
 
remote sensing and GIS -role in pest managment
remote sensing and GIS -role in pest managmentremote sensing and GIS -role in pest managment
remote sensing and GIS -role in pest managmentInder15
 
remote sensing in agriculture
remote sensing in agricultureremote sensing in agriculture
remote sensing in agricultureveerendra manduri
 
DOCTORAL SEMINAR on remote sensing in Agriculture
DOCTORAL SEMINAR on remote sensing  in AgricultureDOCTORAL SEMINAR on remote sensing  in Agriculture
DOCTORAL SEMINAR on remote sensing in AgricultureAmanDohre
 
Recent advances on application of remote sensing in fruit production of imp...
Recent advances on  application of remote sensing  in fruit production of imp...Recent advances on  application of remote sensing  in fruit production of imp...
Recent advances on application of remote sensing in fruit production of imp...AmanDohre
 
Rs in agriculture &amp; soil
Rs in agriculture &amp; soilRs in agriculture &amp; soil
Rs in agriculture &amp; soilMuhammad Asim
 
Prince Kr. Gupta "Role of Phenomics in Plant Pathology"
Prince Kr. Gupta "Role of Phenomics  in Plant Pathology"Prince Kr. Gupta "Role of Phenomics  in Plant Pathology"
Prince Kr. Gupta "Role of Phenomics in Plant Pathology"PRINCE GUPTA
 
Remote Sensing Applications in Agriculture in Pakistan
Remote Sensing Applications in Agriculture in PakistanRemote Sensing Applications in Agriculture in Pakistan
Remote Sensing Applications in Agriculture in PakistanGhulam Asghar
 
AUTOMATED SYSTEM FOR PLANT DISEASE DIAGNOSIS BY USING IMAGE PROCESSING
AUTOMATED SYSTEM FOR PLANT DISEASE DIAGNOSIS BY USING IMAGE PROCESSINGAUTOMATED SYSTEM FOR PLANT DISEASE DIAGNOSIS BY USING IMAGE PROCESSING
AUTOMATED SYSTEM FOR PLANT DISEASE DIAGNOSIS BY USING IMAGE PROCESSINGVigneshVikki10
 
Automated system for plant disease diagnosis by using image processing
Automated system for plant disease diagnosis by using image processingAutomated system for plant disease diagnosis by using image processing
Automated system for plant disease diagnosis by using image processingVigneshVikki10
 
Phenomics in crop improvement
Phenomics in crop  improvementPhenomics in crop  improvement
Phenomics in crop improvementsukruthaa
 
OIL PALM LEAF NUTRIENT ESTIMATION USING OPTICAL SENSORS
OIL PALM LEAF NUTRIENT ESTIMATION USING OPTICAL SENSORSOIL PALM LEAF NUTRIENT ESTIMATION USING OPTICAL SENSORS
OIL PALM LEAF NUTRIENT ESTIMATION USING OPTICAL SENSORSKhosroKhorramnia
 
Remote sensing and application by Nikhil Pakwanne
Remote sensing and application by Nikhil PakwanneRemote sensing and application by Nikhil Pakwanne
Remote sensing and application by Nikhil PakwanneNIKHIL PAKWANNE
 
IMED 2018: Mapping Monkeypox risk in the Congo Basin using Remote Sensing and...
IMED 2018: Mapping Monkeypox risk in the Congo Basin using Remote Sensing and...IMED 2018: Mapping Monkeypox risk in the Congo Basin using Remote Sensing and...
IMED 2018: Mapping Monkeypox risk in the Congo Basin using Remote Sensing and...Louisa Diggs
 

Similar to Remote sensing and GIS- role in IPM (20)

Remote Sensing - A tool of plant disease management
Remote Sensing - A tool of plant disease managementRemote Sensing - A tool of plant disease management
Remote Sensing - A tool of plant disease management
 
Application of spectral remote sensing in agronomic decision by Dr.V.Harihara...
Application of spectral remote sensing in agronomic decision by Dr.V.Harihara...Application of spectral remote sensing in agronomic decision by Dr.V.Harihara...
Application of spectral remote sensing in agronomic decision by Dr.V.Harihara...
 
Identification and Evaluation of Cercospora Leaf Spot of Sugar Beet by using ...
Identification and Evaluation of Cercospora Leaf Spot of Sugar Beet by using ...Identification and Evaluation of Cercospora Leaf Spot of Sugar Beet by using ...
Identification and Evaluation of Cercospora Leaf Spot of Sugar Beet by using ...
 
TEMPORAL AND SPATIAL VARIABILITY IN PLANT PATHOENS.pptx
TEMPORAL AND SPATIAL VARIABILITY IN PLANT PATHOENS.pptxTEMPORAL AND SPATIAL VARIABILITY IN PLANT PATHOENS.pptx
TEMPORAL AND SPATIAL VARIABILITY IN PLANT PATHOENS.pptx
 
Seminar on 'Remote Sensing, Drone in Agriculture'
Seminar on 'Remote Sensing, Drone in Agriculture'Seminar on 'Remote Sensing, Drone in Agriculture'
Seminar on 'Remote Sensing, Drone in Agriculture'
 
remote sensing and GIS -role in pest managment
remote sensing and GIS -role in pest managmentremote sensing and GIS -role in pest managment
remote sensing and GIS -role in pest managment
 
remote sensing in agriculture
remote sensing in agricultureremote sensing in agriculture
remote sensing in agriculture
 
DOCTORAL SEMINAR on remote sensing in Agriculture
DOCTORAL SEMINAR on remote sensing  in AgricultureDOCTORAL SEMINAR on remote sensing  in Agriculture
DOCTORAL SEMINAR on remote sensing in Agriculture
 
Recent advances on application of remote sensing in fruit production of imp...
Recent advances on  application of remote sensing  in fruit production of imp...Recent advances on  application of remote sensing  in fruit production of imp...
Recent advances on application of remote sensing in fruit production of imp...
 
Rs in agriculture &amp; soil
Rs in agriculture &amp; soilRs in agriculture &amp; soil
Rs in agriculture &amp; soil
 
Prince Kr. Gupta "Role of Phenomics in Plant Pathology"
Prince Kr. Gupta "Role of Phenomics  in Plant Pathology"Prince Kr. Gupta "Role of Phenomics  in Plant Pathology"
Prince Kr. Gupta "Role of Phenomics in Plant Pathology"
 
Remote sensing agriculture
Remote sensing agricultureRemote sensing agriculture
Remote sensing agriculture
 
Remote Sensing Applications in Agriculture in Pakistan
Remote Sensing Applications in Agriculture in PakistanRemote Sensing Applications in Agriculture in Pakistan
Remote Sensing Applications in Agriculture in Pakistan
 
AUTOMATED SYSTEM FOR PLANT DISEASE DIAGNOSIS BY USING IMAGE PROCESSING
AUTOMATED SYSTEM FOR PLANT DISEASE DIAGNOSIS BY USING IMAGE PROCESSINGAUTOMATED SYSTEM FOR PLANT DISEASE DIAGNOSIS BY USING IMAGE PROCESSING
AUTOMATED SYSTEM FOR PLANT DISEASE DIAGNOSIS BY USING IMAGE PROCESSING
 
Automated system for plant disease diagnosis by using image processing
Automated system for plant disease diagnosis by using image processingAutomated system for plant disease diagnosis by using image processing
Automated system for plant disease diagnosis by using image processing
 
Phenomics in crop improvement
Phenomics in crop  improvementPhenomics in crop  improvement
Phenomics in crop improvement
 
Nir meat milk
Nir meat milkNir meat milk
Nir meat milk
 
OIL PALM LEAF NUTRIENT ESTIMATION USING OPTICAL SENSORS
OIL PALM LEAF NUTRIENT ESTIMATION USING OPTICAL SENSORSOIL PALM LEAF NUTRIENT ESTIMATION USING OPTICAL SENSORS
OIL PALM LEAF NUTRIENT ESTIMATION USING OPTICAL SENSORS
 
Remote sensing and application by Nikhil Pakwanne
Remote sensing and application by Nikhil PakwanneRemote sensing and application by Nikhil Pakwanne
Remote sensing and application by Nikhil Pakwanne
 
IMED 2018: Mapping Monkeypox risk in the Congo Basin using Remote Sensing and...
IMED 2018: Mapping Monkeypox risk in the Congo Basin using Remote Sensing and...IMED 2018: Mapping Monkeypox risk in the Congo Basin using Remote Sensing and...
IMED 2018: Mapping Monkeypox risk in the Congo Basin using Remote Sensing and...
 

Remote sensing and GIS- role in IPM

  • 1. 1
  • 2. Doctoral seminar on Pest surveillance, Remote sensing and GIS- role in IPM Course-in-charge Dr. N. C. Venkateswarlu Professor and Head Dept of Entomology Presented by V, Shilpakala TAD/2014-122
  • 3. 1. • Introduction 2. • Pest surveillance 3. • Remote sensing 4. • GIS 5. • Conclusion 3
  • 4. Pest surveillance Monitoring pests and their natural enemies is a fundamental tool in IPM - for taking management decision Remote sensing Collection of remotely sensed data. GIS Collection of both hardware and software for dealing with spatial information. 1. Introduction 4
  • 5. 2. Pest Surveillance O Refers to the constant watch on the population dynamics of pests, its incidence and damage on each crop at fixed intervals to forewarn the farmers to take up timely crop protection measures. 5
  • 6. Three basic components of pest surveillance are O Determination of a. the level of incidence of the pest species b. the loss caused by the incidence c. the economic benefits, the control will provide. 6
  • 7. Objectives of Pest Surveillance O to know existing and new pest species O to assess pest population and damage at different growth stage of crop O to study the influence of weather parameters on pest O to study changing pest status (minor to major) O to assess natural enemies and their influence on pests O effect of new cropping pattern and varieties on pest 7
  • 8. Survey An official procedure conducted over a defined period of time to determine the characteristics of a pest population or to determine which pest species occur in an area (ISPM No. 5) 8
  • 9. Roving survey O Assessment of pest population/damage from randomly selected spots representing larger area. O Provides information on pest level over large area. O Large area surveyed in short period 9
  • 10. Fixed plot survey O Assessment of pest population/damage from a fixed plot selected in a field. O The data on pest population/damage recorded periodic from sowing till harvest. e.g. plots randomly selected from in of crop area in case of From each plot 10 plant selected at random. O Total tillers and tillers affected - in these 10 plants counted. O Total leaves and number affected - ( % damaged leaves). O Population of - number/tiller. 10
  • 11. Other types of survey O Qualitative survey - Useful for detection of pest O Quantitative survey - Useful for enumeration of pest According to ISPM definitions, O detection, O monitoring O delimiting surveys. 11
  • 12. Pest Survey Sites O Reported presence and distribution of the pest. O Biology of the pest. O Distribution of host plants of the pest and especially of their areas of commercial production. O Climatic suitability of sites for the pest. 12
  • 13. Timing of survey procedures may be determined by: • Life cycle • Phenology of the pest and its hosts • Pest management programmes • Whether the pest is best detected on crops in active growth or in the harvested crop. 13
  • 14. Sampling Techniques O Absolute sampling - To count all the pests occurring in a plot O Relative sampling - To measure pest in terms of some values which can be compared over time and space e.g. Light trap catch, Pheromone trap 14
  • 15. O Methods of sampling a. In situ counts - Visual observation on number of insects on plant canopy (either entire plot or randomly selected plot) b. Knock down - Collecting insects from an area by removing from crop and (Sudden trap) counting (Jarring) c. Netting - Use of sweep net for hoppers, odonates, grasshoppers. d. Norcotised collection - Quick moving insects anaesthesised and counted 15
  • 16. e. Trapping - Light trap - Phototropic insects O Pheromone trap - Species specific O Sticky trap - Sucking insects O Bait trap - Sorghum shootfly - Fishmeal trap O Emergence trap - For soil insects f. Crop samples Plant parts removed and pest counted e.g. Bollworms O Stage of Sampling O Sample Size 16
  • 17. Pest Negligible% Low Moderate Severe Very severe Leaf miner < 1 % 1-5 % 6-15 % 16-30 % > 30 % Butterfly < 1 % 1-5 % 6-10 % 11-15 % > 15 % Survey and surveillance of insect pests and their natural enemies in acid lime ecosystems of south coastal Andhra Pradesh Sreedevi (2010) 17 Scoring of population/damage levels of major acid lime insect pests Pest Management in Horticultural Ecosystems, 16(2): 131-135
  • 18. 18 Pest management in horticultural ecosystems, 16(2): 131-135
  • 19. Pest Management in Horticultural Ecosystems, 16(2): 131-135 19
  • 20. DRR Annual progress report 2013, vol.2- Entomology O BPH- 24 centers with maximum 54528 insects/week- during 47th week at Raipur. O WBPH- 21 centers (5683 insects/week)- during 42nd week at Gangavathi. O Planthoppers continue to be second major pests. 20
  • 21. The art and science of obtaining information about an object, area or phenomenon through the analysis of data acquired by a device that is not in contact with the object under investigation (Lillesand et al., 2004) 21
  • 22. History of Remote Sensing 22
  • 23. History of Remote Sensing O first meteorological satellite was launched by US on 1st April, 1960 for weather forecast, movement of hurricanes and other associated uses. It was named as earth resources technology satellite (ERTS) – well suited for agricultural responses. O These satellites are now referred to as LAND SAT. O First remote sensing satellite in India was launched in 1988, named as IRS(Indian Remote Sensing). 23
  • 24. Areas of APPLICATION O Geology O Hydrology O Sea Ice O Land Cover & Land Use O Mapping O Oceans & Coastal Monitoring OAgriculture OForestry 24
  • 25. Agriculture • Crop acreage estimation • Crop modeling for yield & production forecast / estimation • Crop & Orchard monitoring Scope • Timely availability of crop statistics for decision making & planning • Crop growth monitoring • Soil status monitoring • Regular reports regarding total area under cultivation Benefits Banana Plantation – Muhammad Pur (Ghotki) Mar 05, 2006, RecoveryJan 12, 2006, DamageDec 16, 2005, Pre-Frost 25
  • 26. Forestry • Satellite image based forest resource mapping and updation • Forest change detection • Forest resource inventory • GIS database development Scope • Availability of baseline information • Planning for afforestation strategies • Futuristic resource planning • Sustainability of environment • Wild life conservation & development. Benefits Sarhad Reserve Forest (Ghotki) 26
  • 27. Types of REMOTE SENSING Active Remote Sensing Passive Remote Sensing 27
  • 28. Types of Remote Sensing Platforms O field-based (ground based), O mounted on aircraft(airborne) O satellites (space borne). 28
  • 29. Ground based O Spectroradiometry is the technique of measuring the spectrum of radiation emitted by a source. O In order to do this the radiation must be separated into its component wavebands and each band measured separately. O It is achieved by diffraction grating technique within the spectroradiometers to split the radiation entering the system into its constituent wavebands. O A suitable detector is then used to quantify the radiation of each wavelength (ASD 1999 ) . 29
  • 30. 30
  • 31. 31
  • 32. Concept Stresses interferes with photosynthesis and physical structure of the plant (Hatfield and Pinter, 1993). O causes changes in pigment, chemical concentrations, cell structure, nutrient, water uptake, and gas exchange. (Raikes and Burpee 1998). 32
  • 35. Typical spectral reflectance curve of healthy vegetation depicting different absorption peaks 35
  • 36. • Downward or sideward looking sensors are mounted on an aircraft to obtain images of the earth's surface. • It has the capability of offering very high spatial resolution images. • But low coverage area and high cost per unit area of ground coverage. • It is not cost-effective to map a large area using an airborne remote sensing system. • Airborne remote sensing missions are often carried out as one-time operations, whereas earth observation satellites offer the possibility of continuous monitoring of the earth. AIRBORNE REMOTE SENSING 36
  • 38. Spaceborne remote sensing O In spaceborne remote sensing, sensors are mounted on-board a spacecraft (space shuttle or satellite) orbiting the earth. O The geostationary orbits are commonly used by meterological satellites. O Located at a high altitude of 36,000 km. 38
  • 39. Spaceborne remote sensing provides the following advantages: O Large area coverage. O Frequent and repetitive coverage of an area of interest. O Quantitative measurement of ground features using radiometrically calibrated sensors. O Semiautomated computerised processing and analysis. O Relatively lower cost per unit area of coverage. 39
  • 40. Optical/thermal imaging systems can be classified according to the number of spectral bands used: O Monospectral or panchromatic (single wavelength band, "black-and-white", grey-scale image) systems O Multispectral (several spectral bands) systems O Superspectral (tens of spectral bands) systems O Hyperspectral (hundreds of spectral bands) systems 40
  • 41. 41
  • 42. • A hyperspectral image consists of about a hundred or more contiguous spectral bands. • Applications in fields such as precision agriculture (e.g. monitoring the types, health, moisture status and maturity of crops), coastal management (e.g. monitoring of phytoplanktons, pollution). • Currently, hyperspectral imagery is not commercially available from satellites. • There are experimental satellite-sensors that acquire hyperspectral imagery for scientific investigation (e.g. NASA's Hyperion sensor on-board the EO1 satellite, CHRIS sensor on board ESA's PRABO satellite). HYPERSPECTRAL IMAGE 42
  • 43. Multispectral Images • A multispectral imagery consists of several bands of data. For visual display, each band of the image may be displayed one band at a time as a grey scale image, or in combination of three bands at a time as a colour composite image. • Interpretation of a multispectral colour composite image will require the knowledge of the spectral reflectance of the targets in the scene. 43
  • 44. BOTTOM VIEW OF MS4100 MULTI-SPECTRAL CAMERA (A) AND REGULAR DIGITAL RGB CAMERA (B) ON CESSNA 206. 44
  • 45. DISADVANTAGES OF REMOTE SENSING  Expensive to build and operate!!!!  Measurement uncertainty can be large  Data interpretation can be difficult  need to understand theoretically how the instrument is making the measurements  need to understand measurement uncertainties  need to have some knowledge of the phenomena you are sampling 45
  • 46. GEOGRAPHIC implies that locations of the data items are known, or can be calculated, in terms of Geographic coordinates (Latitude, Longitude) INFORMATION implies that the data in a GIS are organized to yield useful knowledge, often as coloured maps and images, but also as statistical graphics, tables, and various on-screen responses to interactive queries. SYSTEM implies that a GIS is made up from several inter- related and linked components with different functions. Thus, GIS have functional capabilities for data capture, input, manipulation, transformation, visualization, combinations, query, analysis, modelling and output. WHAT IS A GIS ? 46
  • 47. 3. GIS O Geographic Information System O A GIS is a computer system capable of capturing, storing, analyzing, and displaying geographically referenced information; that is, data identified according to location. O Practitioners also define a GIS as including the procedures, operating personnel, and spatial data that go into the system. 47
  • 48. TheHistory • First developed in North America, particularly the U.S. and Canada in the mid-1960s • Previously been used in natural resources and environmental research. 48
  • 49. GIS: OLD AND NEW Traditional GIS MAP TYPEWRITER MANUAL DRAFTING TOOLS New GIS COMPUTER PLOTTER CD-ROM 49
  • 50. 50 GPS device It is a device which uses 24 satellites orbiting at 24,200 km above earth to find latitudes, longitudes and altitude of any location on the earth.
  • 51. • For a forest manager to optimize timber production • For a geologist to identify the best site to construct dam • For a geoinformatics engineer to establish a relay station Unlimited applications… • Site suitability • Erosion modeling • Civil engineering • Urban planning • Forestry • Environmental management • Natural disaster management • Biology • Geology • Mining • Hydrology…. GIS APLLICATIONS 51
  • 52. •Data Acquisition and processing •Database Management and Retrieval •Spatial Measurement and Analysis •Graphic output and Visualization Basic functions of GIS 52
  • 53. SPATIAL DATA Raster Vecto r DATA MODELAND STRUCTURE RASTER MODEL VECTOR MODEL 53
  • 55. 55
  • 56. 56
  • 57. 57
  • 58. 58
  • 59. 59
  • 60. 60
  • 61. Hyperspectral radiometry for the detection and discrimination of damage caused by sucking pests of cotton 61 Sensitivity curves of damaged and undamaged cotton plants Thrips damaged Leaf hopper damaged Aphids damaged Ranjitha and Srinivasan, 2014 Current biotica 8(1): 5-12.
  • 62. Spectral and spatial properties of rice brown plant hopper and groundnut late leaf spot disease infestation under field conditions Prabhakar et al., 2013 62
  • 63. Multispectral reflectance of rice plants with different levels of BPH severity 63 Journal of Agrometeorology 15 (Special Issue-I) : 57-62(March 2013)
  • 64. Classified satellite image depicting BPH damage in east godavari district, A.P. During 2007 64 Journal of Agrometeorology 15 (Special Issue-I) : 57-62(March 2013)
  • 65. DIFFERENTIATING STRESS INDUCED BY GREENBUGS AND RUSSIAN WHEAT APHIDS IN WHEAT USING REMOTE SENSING Green bug Russian wheat aphid Older leaves Younger leaves Less visible More visible Chlorophyll a reduced than b Both a and b reduced No impact on carotenoids Sig. loss of carotenoids Decreased Reflectance in NIR(cellular lysis) Increased in NIR (low water content) Computers and Electronics in Agriculture 67 :64–70 Yang et al. (2009) 65
  • 66. Use of ground based hyperspectral remote sensing for detection of stress in cotton caused by leafhopper (Hemiptera: Cicadellidae) Prabhakar et al., 2011 66
  • 67. Reflectance spectra of cotton plants infested by leafhopper at different levels of infestation (Grade 0, healthy; Grade 1, lowest; Grade 4, highest Computers and Electronics in Agriculture 79 :189–198 67
  • 68. Using ground-based multispectral radiometry to detect stress in wheat caused by greenbug (Homoptera: Aphididae) infestation Computers and Electronics in Agriculture 47 (2005) 121–135 Yang et al.,2005 • Out breaks appear every year • Early detection – critical part of IPM • Hand held Cropscan Radiometer MSR 16R • Band centered at 694 nm and vegetative index from bands centered at 800 to 694- identified as sensitive to damage. 68
  • 69. Computers and Electronics in Agriculture 97 : 61–70 69 Prabhakar et al., 2013
  • 70. MEAN REFLECTANCE SPECTRA OF COTTON PLANTS UNDER DIFFERENT GRADES OF MEALYBUG INFESTATION70
  • 71. Hyperspectral detection of rice damaged by rice leaf folder (Cnaphalocrocis medinalis) Computers and Electronics in Agriculture 82 : 100–107 Jianrong Huang et al. (2012) 71
  • 72. Automatic identification and counting of small size pests in greenhouse conditions with low computational cost Ecological Informatics 72
  • 73. 73
  • 74. A new invasive insect in Sweden – Physokermes inopinatus: Tracing forest damage with satellite based remote sensing • MODIS data • SPOT data • Associated black encrustation absorbs light in the red band and cancels out the increased reflectance of the damaged needles. 74 Forest Ecology and Management 285: 29–37 Olsson et al., 2012
  • 75. A and B shows spruce forest infested by P. inopinatus and sooty mold 75
  • 76. Coupling historical prospection data and a remotely-sensed vegetation index for the preventative control of desert locusts Basic and Applied Ecology 14 : 593–604 Cyril Piou et al., 2013 . Black pixels represent NDVI values = 0, lighter pixels indicate NDVI-values >0 the Akjoujt area between 2001 and 2009the Aioun area between 2001 and 2009 76
  • 77. • Monitoring is backbone of IPM. Farmer must keep continuous vigilance on pest activity on crops. • Monitoring helps in issuing forewarning and facilitates proper timing of plant protection measures thereby preventing avoidable losses and environmental contamination, and ensuring favourable benefit-cost. • Remote sensing technique is very useful, less time consuming and cost effective tool for suggesting action plans /management strategies for agricultural sustainability of any region. 77
  • 78. • Remotely sensed images can be used to identify nutrient deficiencies, diseases, water deficiency or surplus, weed infestations, insect damage, hail damage, wind damage, herbicide damage, and plant populations • GIS is considered one of the important tools for decision making in problem solving environment dealing with geo-information. 78
  • 79. 79