The Palmer Long Term Ecological Research (LTER) project is located along the West Antarctic Peninsula (WAP), one of the most rapidly warming regions on the planet. Despite its remoteness the WAP supports a variety of social and economic activities, most notably in the fishing and tourism industries and in international scientific research. Because of the growing pressures imposed by these activities, the rapid rate of environmental change, relatively pristine nature of the environment, its trophic complexity, and rich scientific record, the WAP is an ideal place to explore the impact of climate change on marine and terrestrial ecosystems and the services and benefits they provide. Here we present a schema to conduct an initial assessment of WAP marine and terrestrial ecosystem services that will serve as a critical baseline for future studies, and that is broadly applicable to other LTER sites. We will combine social valuation and qualitative, expert-based modelling to identify relevant ecosystem services and to conduct an initial assessment and valuation of ecosystem service supply for the WAP region. The Palmer LTER team of investigators includes experts in topics ranging from physical oceanographic processes, to microbiology, to marine avian and mammal ecology. Through interviews and an online survey we will evaluate the views and perceptions of Antarctic ecosystem services and their changes among this group of experts. Our focus will be on biophysical ecosystem services, but we will include cultural ecosystem services and the impacts of changes on ecosystem functioning and ecosystem service supply in the expert elicitations. This qualitative, socio-ecological valuation will guide an expanded future assessment of WAP ecosystem services that include economic and socio-cultural realms of ecosystem service as perceived and valued by an expanded pool of experts and stakeholders.
Accelerated Erosion and Sea Level Rise, The Case for Adaptive PoliciesLisa Granquist
2012 March. Poster presenter. Research, Innovation and Scholarship Expo RISE2012, Northeastern University, Poster title, Accelerated Erosion and Sea Level Rise, The Case for Adaptive Policies.
Erosion As Pollution: The net economic and shoreline effects of coastal struc...Lisa Granquist
This is an update to the presentation, "Shoreline Change in Urban Massachusetts, Time for Retreat?"
Inland property owners observe significant premiums in home values due to the existence of beaches for recreation in front of proximate waterfront properties. As erosion occurs, waterfront property owners seek to protect their properties with hard structures (seawalls, revetments) often waterfront property owners have the legal right to do this.
A negotiated solution? “In theory,” to protect their own home values, inland property owners could pay waterfront property owners to forego hard structural protections or to replenish sand on the beach.
- from slide 21, Hoagland, Granquist, 2014, Shoreline Change in Urban Massachusetts: Erosion as Pollution?
Shoreline Change in Urban Massachusetts, Time for Retreat?Lisa Granquist
2013 February. Workshop presentation at the American Association for the Advancement of Science (AAAS), Annual Meeting, Boston, MA, of co-authored research, Shoreline Change in Urban Massachusetts, Time for Retreat?
“Coral reefs represent some of the world's most spectacular beauty spots, but they are also the foundation of marine life: without them many of the seas most exquisite species will not survive”
~ Sheherazade Goldsmith
“Coral is a very beautiful and unusual animal. Each coral head consists of thousand individual polyps. These polyps are continually budding and branching into genetically identical neighbors”
~ Antony Garrett Lisi
“The ocean stirs the heart, inspires the imagination and brings etrnal joy to the soul”
~ Wyland
Recent presentation on assessing how U.S. Fish and Wildlife Service Hurricane Sandy Resilience projects will improve community and ecosystem resilience to sea level rise, storm events and other threats. Presentation highlights development of ecological and socio-economic metrics and provides project examples, marsh restoration, beach restoration, living shorelines and aquatic connectivity (dam removal) of metrics being used to evaluate project performance.
Sweetwater Reservoir Habitat Recovery Plan Risk Assessmentmsweesy
Special credit is given to Pete Famalaro, Troy Murphree, and the Sweetwater Authority for photo credits, technical reservoir operations and wildlife data, and their collaboration in the development of this study and presentation.
Jason Winner, Conservation GIS Manager for Scenic Hudson presents on the new Sea Level Rise Mapper.
The mapper is a tool for communities and stakeholders to use to create visualizations of future scenarios of sea level rise. With these maps and information, Scenic Hudson is supporting communities' efforts to develop adaptation plans by helping them to:
- create maps of the extent and impacts of inundation and flood zone expansion
- understand the locations of key built and natural resources
- create graphics that illustrate different sea level rise scenarios in specific communities or stretches of the river
- estimate the risks to infrastructure and natural resources and the likelihoods of different inundation events
- develop alternative adaptation scenarios and weigh their cost and benefits with respect to built infrastructure and natural resources
** The Sea Level Rise Mapper can be found on Scenic Hudson's website at: http://www.scenichudson.org/slr/mapper
For more information, contact Jason Winner at Scenic Hudson at (845) 473-4440 ext 223, or jwinner@scenichudson.org
Presentation by Dr Gill Ainsworth on a project within the Marine Ecosystems Research Programme which investigates shared values, competing interests and potential trade-offs to guide the implementation of appropriate marine management strategies
Ecosystem based approach in MSP
* The information presented is the working exercise of the cross-border maritime spatial planning discussions and can not be treated as the official opinion of the European Commission and the Member States involved in the consortium of the Baltic SCOPE project.
C4.02: Development of an Integrated Global Water Quality Monitoring and Forec...Blue Planet Symposium
Surface waters are generally viewed as a hydrologic continuum, flowing from inland water sources through estuaries to the open oceans. The GEO Working Group on Earth Observations of Inland and Near-Coastal Waters (WA-01-C4) has organised the Water Quality Summit in Geneva 20-22nd April 2015 with the aim of charting the future of earth observation and in situ measurements based global water quality monitoring and forecasting systems. The relationship to GEO Blue Planet lies in the coastal zone.
There is a crucial need for timely, accurate, and widespread assessment and monitoring and forecasting of inland and near-coastal water quality. However, existing measurement and forecasting capabilities have significant logistical, technical, and economic challenges and constraints, impacting both developed and developing nations. This summit was endorsed by GEO as a part of the water quality task (WA-01-C4) and the GEOSS Water Strategy with the mission to deliver, on a routine and sustained basis, timely, consistent, accurate and fit-for -purpose water quality data products and information to support water resource management and decision making in coastal and inland waters. The Summit goal is to define specific requirements of the water quality system components and develop a plan to implement integrated global end-to-end water quality monitoring and forecasting service. We present the results of this meeting: Development of a strategic implementation and a phased action plan including baseline and threshold service build-outs, with both a short-term and a long-term plan for a global-scale water quality monitoring and forecasting service. Some feedback will be given on the CEOS–GEOSS Water Strategy Implementation plan as well as other international related activities.
C5.02: The Global Ocean Acidification Observing Network: data for decisions -...Blue Planet Symposium
Ocean acidification describes the changes in seawater chemistry that result from the uptake of anthropogenic carbon dioxide by the ocean. The changes this century are predicted to have profound impacts on marine ecosystems with potential flow-on effects to economic and environmental services the ecosystems provide, including fisheries and aquaculture, coastal protection, and tourism. The Global Ocean Acidification - Observing Network (GOA-ON) has been developed in response to the widespread concern of the impacts of ocean acidification. The network is an internationally coordinated effort, combining ‘bottom up’ collaboration by the research community with ‘top down’ encouragement and support from a range of international bodies and organisations, including the Intergovernmental Oceanographic Commission (UNESCO-IOC), the International Atomic Energy Agency (IAEA), and the Global Ocean Observing System (GOOS). The aim is to provide chemical and biological data from local to global scales that can be used to improve understanding of ocean acidification conditions and ecosystem responses, and to provide uniformly collected and quality-controlled data to assist policy making through research products and model-based projections of ecosystem responses. Capability development is a key aspect of the network. The status and future plans of the GOA-ON initiative will be described – providing the opportunity for additional involvement in its implementation.
During the transition from winter to spring the Antarctic marine microbial community shifts from a regime defined by chemoautotrophy and mixotrophy to one defined by phototrophy and heterotrophy. Because sea ice imposes a strong control on the flux of sunlight to the water column during the polar spring, we hypothesize that sea ice influences the mechanism and degree of microbial carbon acquisition and exchange. Future changes to sea ice extant and duration will thus impact primary production at this base of the foodweb. To test the influence of sea ice on water column microbial processes we took advantage of unique sea ice conditions in Arthur Harbor on Anvers Island off the western Antarctic Peninsula during the 2015 spring-summer seasonal transition. Over a five week period we sampled water from below land fast sea ice, in the marginal ice zone at nearby Palmer Station B, and conducted an ice-out experiment with incubations of water collected below the land fast ice. Analysis of bacterial production, primary production, chlorophyll a concentration, and fluorescence induction and relaxation (FIRe), show strong differences in community physiology and ecophysiology between treatments. To develop a mechanistic understanding of these responses we sequenced whole community metatranscriptomes for each time series. Here we will present preliminary results of our metatranscriptome analysis, as abundances of transcripts binned by enzyme commission number and genome. This approach will allow us to identify microbe-specific responses to increased light during the critical winter-spring seasonal transition.
Bowman and Ducklow 2016 GRC Marine MicrobesJeff Bowman
In the marine environment bacterial communities are structured by a variety of physical and biogeochemical factors, including turbulence and carbon and nutrient availability. In turn bacterial community structure has a direct impact on the ecosystem functions performed by the community, including bacterial production and nutrient remineralization. To facilitate the incorporation of community structure data in biogeochemical models we’ve developed a technique to establish “modes” of community structure with emergent self-organizing maps (ESOMs). Using a multi-year time series of 16S rRNA amplicon data, flow cytometry, and biogeochemical data from a long term study site off the West Antarctic Peninsula we’ve observed that bacterial production, a key indicator of biomass flow in the marine ecosystem, is best described by a linear model combining flow cytometry observations and community mode. Here we use 16S rRNA gene fragments recovered from the Tara global ocean expedition dataset to identify bacterial modes, equivalent to biomes, for the global ocean. For biogeochemical context we compare these biomes to data available from WOCE and JGOFS. To identify microbial “dark matter” captured in the Tara dataset we compared the results of a metabolic inference conducted with paprica to direct observations of metabolic pathways. Poor correlations between the metabolic inference and direct observations indicate samples with poor genomic representation among the completed genomes in Genbank.
Inferring microbial ecosystem function from community structureJeff Bowman
Poster presented at the OCB scoping workshop: Traits-based approaches to ocean life and at the Sustainable Oceans Symposium at the Earth Institute, Columbia University.
Describing polar marine microbial communities by their metabolic structureJeff Bowman
Describing polar marine microbial communities by their metabolic structure: Can we bridge the gap between community structure and ecosystem function? A poster presented at the 2015 GRC Polar Marine Science.
Increased rates of horizontal gene transfer in psychrophilic genomes and potential links to the Phanerozoic climate record
Bowman, JS, Collins, RE, Deming, JW
Several authors have suggested that the rate of horizontal gene transfer (HGT) may be elevated in cold adapted Bacteria and Archaea, a hypothesis supported by a growing number of genome-genome comparisons between related psychrophilic and mesophilic strains. An increased rate of HGT may be the result of widespread lysogeny and pseudolysogeny among high latitude phage, selective pressure imposed by increased environmental stress, the sympagic nature of cold microbial habitats such as sea ice, or a combination of these factors. To more broadly test this hypothesis, and establish a method for further analysis, we developed a new approach to quantify the degree of genome plasticity in microbial populations, based on the divergence of predicted proteomes compared to the divergence of 16S rRNA genes. Applying this method to a group of 20 psychrophilic genomes and a taxonomically related mesophilic control group we found genome plasticity to be significantly higher in the cold group (p = 3.5 x 10⁻⁶). To place these findings in an evolutionary context we used the GC amelioration technique to date the acquisition of coding sequences (CDS) with anomalous GC content in both the psychrophile and control groups. For the control group the dates of acquisition of anomalous CDS were not correlated with cold periods during the last 650 million years (p = 0.234) while anomalous CDS in the psychrophilic group had a robust relationship (p = 0.006). Many of the CDS in this group that were predicted to have undergone HGT during cold periods code for transposases, suggesting a link between historic HGT events and current patterns of HGT among cold adapted microbial populations.
Nutraceutical market, scope and growth: Herbal drug technologyLokesh Patil
As consumer awareness of health and wellness rises, the nutraceutical market—which includes goods like functional meals, drinks, and dietary supplements that provide health advantages beyond basic nutrition—is growing significantly. As healthcare expenses rise, the population ages, and people want natural and preventative health solutions more and more, this industry is increasing quickly. Further driving market expansion are product formulation innovations and the use of cutting-edge technology for customized nutrition. With its worldwide reach, the nutraceutical industry is expected to keep growing and provide significant chances for research and investment in a number of categories, including vitamins, minerals, probiotics, and herbal supplements.
Deep Behavioral Phenotyping in Systems Neuroscience for Functional Atlasing a...Ana Luísa Pinho
Functional Magnetic Resonance Imaging (fMRI) provides means to characterize brain activations in response to behavior. However, cognitive neuroscience has been limited to group-level effects referring to the performance of specific tasks. To obtain the functional profile of elementary cognitive mechanisms, the combination of brain responses to many tasks is required. Yet, to date, both structural atlases and parcellation-based activations do not fully account for cognitive function and still present several limitations. Further, they do not adapt overall to individual characteristics. In this talk, I will give an account of deep-behavioral phenotyping strategies, namely data-driven methods in large task-fMRI datasets, to optimize functional brain-data collection and improve inference of effects-of-interest related to mental processes. Key to this approach is the employment of fast multi-functional paradigms rich on features that can be well parametrized and, consequently, facilitate the creation of psycho-physiological constructs to be modelled with imaging data. Particular emphasis will be given to music stimuli when studying high-order cognitive mechanisms, due to their ecological nature and quality to enable complex behavior compounded by discrete entities. I will also discuss how deep-behavioral phenotyping and individualized models applied to neuroimaging data can better account for the subject-specific organization of domain-general cognitive systems in the human brain. Finally, the accumulation of functional brain signatures brings the possibility to clarify relationships among tasks and create a univocal link between brain systems and mental functions through: (1) the development of ontologies proposing an organization of cognitive processes; and (2) brain-network taxonomies describing functional specialization. To this end, tools to improve commensurability in cognitive science are necessary, such as public repositories, ontology-based platforms and automated meta-analysis tools. I will thus discuss some brain-atlasing resources currently under development, and their applicability in cognitive as well as clinical neuroscience.
Slide 1: Title Slide
Extrachromosomal Inheritance
Slide 2: Introduction to Extrachromosomal Inheritance
Definition: Extrachromosomal inheritance refers to the transmission of genetic material that is not found within the nucleus.
Key Components: Involves genes located in mitochondria, chloroplasts, and plasmids.
Slide 3: Mitochondrial Inheritance
Mitochondria: Organelles responsible for energy production.
Mitochondrial DNA (mtDNA): Circular DNA molecule found in mitochondria.
Inheritance Pattern: Maternally inherited, meaning it is passed from mothers to all their offspring.
Diseases: Examples include Leber’s hereditary optic neuropathy (LHON) and mitochondrial myopathy.
Slide 4: Chloroplast Inheritance
Chloroplasts: Organelles responsible for photosynthesis in plants.
Chloroplast DNA (cpDNA): Circular DNA molecule found in chloroplasts.
Inheritance Pattern: Often maternally inherited in most plants, but can vary in some species.
Examples: Variegation in plants, where leaf color patterns are determined by chloroplast DNA.
Slide 5: Plasmid Inheritance
Plasmids: Small, circular DNA molecules found in bacteria and some eukaryotes.
Features: Can carry antibiotic resistance genes and can be transferred between cells through processes like conjugation.
Significance: Important in biotechnology for gene cloning and genetic engineering.
Slide 6: Mechanisms of Extrachromosomal Inheritance
Non-Mendelian Patterns: Do not follow Mendel’s laws of inheritance.
Cytoplasmic Segregation: During cell division, organelles like mitochondria and chloroplasts are randomly distributed to daughter cells.
Heteroplasmy: Presence of more than one type of organellar genome within a cell, leading to variation in expression.
Slide 7: Examples of Extrachromosomal Inheritance
Four O’clock Plant (Mirabilis jalapa): Shows variegated leaves due to different cpDNA in leaf cells.
Petite Mutants in Yeast: Result from mutations in mitochondrial DNA affecting respiration.
Slide 8: Importance of Extrachromosomal Inheritance
Evolution: Provides insight into the evolution of eukaryotic cells.
Medicine: Understanding mitochondrial inheritance helps in diagnosing and treating mitochondrial diseases.
Agriculture: Chloroplast inheritance can be used in plant breeding and genetic modification.
Slide 9: Recent Research and Advances
Gene Editing: Techniques like CRISPR-Cas9 are being used to edit mitochondrial and chloroplast DNA.
Therapies: Development of mitochondrial replacement therapy (MRT) for preventing mitochondrial diseases.
Slide 10: Conclusion
Summary: Extrachromosomal inheritance involves the transmission of genetic material outside the nucleus and plays a crucial role in genetics, medicine, and biotechnology.
Future Directions: Continued research and technological advancements hold promise for new treatments and applications.
Slide 11: Questions and Discussion
Invite Audience: Open the floor for any questions or further discussion on the topic.
Richard's aventures in two entangled wonderlandsRichard Gill
Since the loophole-free Bell experiments of 2020 and the Nobel prizes in physics of 2022, critics of Bell's work have retreated to the fortress of super-determinism. Now, super-determinism is a derogatory word - it just means "determinism". Palmer, Hance and Hossenfelder argue that quantum mechanics and determinism are not incompatible, using a sophisticated mathematical construction based on a subtle thinning of allowed states and measurements in quantum mechanics, such that what is left appears to make Bell's argument fail, without altering the empirical predictions of quantum mechanics. I think however that it is a smoke screen, and the slogan "lost in math" comes to my mind. I will discuss some other recent disproofs of Bell's theorem using the language of causality based on causal graphs. Causal thinking is also central to law and justice. I will mention surprising connections to my work on serial killer nurse cases, in particular the Dutch case of Lucia de Berk and the current UK case of Lucy Letby.
Socio-ecological valuation of ecosystem services along the West Antarctic Peninsula
1. −90
−80
−70
−60
−50
−1000100200
long
lat
Socio-ecological valuation of ecosystem services along the
West Antarctic Peninsula
Jeff S. Bowman1
, Barbara Neumann2
, Anton Mikoleit3
, Hugh W. Ducklow1
1
Lamont-Doherty Earth Observatory, Columbia University, New York, USA
2
Department of Geography, Kiel University and Cluster of Excellence“The Future Ocean”
3
School of Sustainability, Kiel University, Kiel, Germany
bowmanjs@ldeo.columbia.edu, neumann@geographie.uni-kiel.de
Introduction
The West Antarctic Peninsula (WAP) is one of the most rapidly warming regions on the
planet. In addition to this distinction the WAP hosts a rich marine ecosystem and, like most of
the Antarctic, has a minimal human presence. Despite this the marine, coastal, and terrestrial
ecosystems of the WAP provide a diverse range of ecosystem functions that support services
with regional and global importance, facilitating a variety of socio-economic activities.
This combination of factors makes the WAP an ideal laboratory for testing the ecosystem
services concept and exploring the contributions of the WAP to human well-being and assess-
ing the potential impact of climate change. The Palmer LongTerm Ecological Research project
(PAL-LTER) has documented ecological change in the region since 1993. Here we use the
‘matrix’ method (Burkhard et al. 2009, 2014; Jacobs et al. 2015), an expert-based qualitative
evaluation approach, to capatalize on the interdisciplinary expertise of the PAL-LTER team of
experts and conduct an initial socio-ecological valuation of the actual and potential flow of
ecosystem services along the WAP during summer months.
The matrix method combines formal expert interviews with a spatially explicit analysis of
biophysical landscape units (Fig. 3) to quantify the flow of services from these units. We
extend this approach by objectively defining seascape units (biomes, Fig. 2) from key biogeo-
chemical parameters collected during 21 PAL-LTER research cruises between 1993 and 2014.
Fig. 1. Trophic structure and ecosystem service provisioning along the WAP. A) Oceanographic conditions
along the WAP lead to intense phytoplankton blooms and a high rate of primary production. B) Phytoplank-
ton blooms support a large population of krill, here being sampled by researchers with the PAL-LTER project.
Although the Southern Ocean krill fishery is small, there is significant potential for exploitation. C) Krill pro-
vide a critical trophic link with large marine predators, including humpback (shown) and minke whales, vari-
ous species of penguin, and seals. D) Charismatic marine megafauna are a major draw for tourists, who pri-
marily visit the region on cruise ships (background).
A B
C D
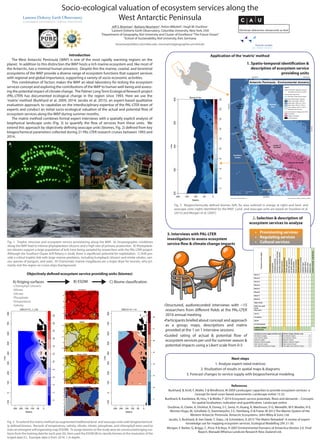
Objectively defined ecosystem service providing units (biomes)
ESOM
Chlorophyll
●●●●●●●●●●●●●●●●●●●●●●●●●●●●●●
●●●●●●●●●●●●●●●●●●●●●●●●●●●●●●
●●●●●●●●●●●●●●●●●●●●●●●●●●●●●●
●●●●●●●●●●●●●●●●●●●●●●●●●●●●●●
●●●●●●●●●●●●●●●●●●●●●●●●●●●●●●
●●●●●●●●●●●●●●●●●●●●●●●●●●●●●●
●●●●●●●●●●●●●●●●●●●●●●●●●●●●●●
●●●●●●●●●●●●●●●●●●●●●●●●●●●●●●
●●●●●●●●●●●●●●●●●●●●●●●●●●●●●●
●●●●●●●●●●●●●●●●●●●●●●●●●●●●●●
●●●●●●●●●●●●●●●●●●●●●●●●●●●●●●
●●●●●●●●●●●●●●●●●●●●●●●●●●●●●●
●●●●●●●●●●●●●●●●●●●●●●●●●●●●●●
●●●●●●●●●●●●●●●●●●●●●●●●●●●●●●
●●●●●●●●●●●●●●●●●●●●●●●●●●●●●●
●●●●●●●●●●●●●●●●●●●●●●●●●●●●●●
●●●●●●●●●●●●●●●●●●●●●●●●●●●●●●
●●●●●●●●●●●●●●●●●●●●●●●●●●●●●●
●●●●●●●●●●●●●●●●●●●●●●●●●●●●●●
●●●●●●●●●●●●●●●●●●●●●●●●●●●●●●
●●●●●●●●●●●●●●●●●●●●●●●●●●●●●●
●●●●●●●●●●●●●●●●●●●●●●●●●●●●●●
●●●●●●●●●●●●●●●●●●●●●●●●●●●●●●
●●●●●●●●●●●●●●●●●●●●●●●●●●●●●●
●●●●●●●●●●●●●●●●●●●●●●●●●●●●●●
●●●●●●●●●●●●●●●●●●●●●●●●●●●●●●
●●●●●●●●●●●●●●●●●●●●●●●●●●●●●●
●●●●●●●●●●●●●●●●●●●●●●●●●●●●●●
●●●●●●●●●●●●●●●●●●●●●●●●●●●●●●
●●●●●●●●●●●●●●●●●●●●●●●●●●●●●●
10
20
30
40
Nitrate + Nitrite
●●●●●●●●●●●●●●●●●●●●●●●●●●●●●●
●●●●●●●●●●●●●●●●●●●●●●●●●●●●●●
●●●●●●●●●●●●●●●●●●●●●●●●●●●●●●
●●●●●●●●●●●●●●●●●●●●●●●●●●●●●●
●●●●●●●●●●●●●●●●●●●●●●●●●●●●●●
●●●●●●●●●●●●●●●●●●●●●●●●●●●●●●
●●●●●●●●●●●●●●●●●●●●●●●●●●●●●●
●●●●●●●●●●●●●●●●●●●●●●●●●●●●●●
●●●●●●●●●●●●●●●●●●●●●●●●●●●●●●
●●●●●●●●●●●●●●●●●●●●●●●●●●●●●●
●●●●●●●●●●●●●●●●●●●●●●●●●●●●●●
●●●●●●●●●●●●●●●●●●●●●●●●●●●●●●
●●●●●●●●●●●●●●●●●●●●●●●●●●●●●●
●●●●●●●●●●●●●●●●●●●●●●●●●●●●●●
●●●●●●●●●●●●●●●●●●●●●●●●●●●●●●
●●●●●●●●●●●●●●●●●●●●●●●●●●●●●●
●●●●●●●●●●●●●●●●●●●●●●●●●●●●●●
●●●●●●●●●●●●●●●●●●●●●●●●●●●●●●
●●●●●●●●●●●●●●●●●●●●●●●●●●●●●●
●●●●●●●●●●●●●●●●●●●●●●●●●●●●●●
●●●●●●●●●●●●●●●●●●●●●●●●●●●●●●
●●●●●●●●●●●●●●●●●●●●●●●●●●●●●●
●●●●●●●●●●●●●●●●●●●●●●●●●●●●●●
●●●●●●●●●●●●●●●●●●●●●●●●●●●●●●
●●●●●●●●●●●●●●●●●●●●●●●●●●●●●●
●●●●●●●●●●●●●●●●●●●●●●●●●●●●●●
●●●●●●●●●●●●●●●●●●●●●●●●●●●●●●
●●●●●●●●●●●●●●●●●●●●●●●●●●●●●●
●●●●●●●●●●●●●●●●●●●●●●●●●●●●●●
●●●●●●●●●●●●●●●●●●●●●●●●●●●●●●
10
20
30
40
Salinity
●●●●●●●●●●●●●●●●●●●●●●●●●●●●●●
●●●●●●●●●●●●●●●●●●●●●●●●●●●●●●
●●●●●●●●●●●●●●●●●●●●●●●●●●●●●●
●●●●●●●●●●●●●●●●●●●●●●●●●●●●●●
●●●●●●●●●●●●●●●●●●●●●●●●●●●●●●
●●●●●●●●●●●●●●●●●●●●●●●●●●●●●●
●●●●●●●●●●●●●●●●●●●●●●●●●●●●●●
●●●●●●●●●●●●●●●●●●●●●●●●●●●●●●
●●●●●●●●●●●●●●●●●●●●●●●●●●●●●●
●●●●●●●●●●●●●●●●●●●●●●●●●●●●●●
●●●●●●●●●●●●●●●●●●●●●●●●●●●●●●
●●●●●●●●●●●●●●●●●●●●●●●●●●●●●●
●●●●●●●●●●●●●●●●●●●●●●●●●●●●●●
●●●●●●●●●●●●●●●●●●●●●●●●●●●●●●
●●●●●●●●●●●●●●●●●●●●●●●●●●●●●●
●●●●●●●●●●●●●●●●●●●●●●●●●●●●●●
●●●●●●●●●●●●●●●●●●●●●●●●●●●●●●
●●●●●●●●●●●●●●●●●●●●●●●●●●●●●●
●●●●●●●●●●●●●●●●●●●●●●●●●●●●●●
●●●●●●●●●●●●●●●●●●●●●●●●●●●●●●
●●●●●●●●●●●●●●●●●●●●●●●●●●●●●●
●●●●●●●●●●●●●●●●●●●●●●●●●●●●●●
●●●●●●●●●●●●●●●●●●●●●●●●●●●●●●
●●●●●●●●●●●●●●●●●●●●●●●●●●●●●●
●●●●●●●●●●●●●●●●●●●●●●●●●●●●●●
●●●●●●●●●●●●●●●●●●●●●●●●●●●●●●
●●●●●●●●●●●●●●●●●●●●●●●●●●●●●●
●●●●●●●●●●●●●●●●●●●●●●●●●●●●●●
●●●●●●●●●●●●●●●●●●●●●●●●●●●●●●
●●●●●●●●●●●●●●●●●●●●●●●●●●●●●●
32.5
33
33.5
34
34.5
Biome locations in ESOM
●●●●●●●●●●●●●●●●●●●●●●●●●●●●●●
●●●●●●●●●●●●●●●●●●●●●●●●●●●●●●
●●●●●●●●●●●●●●●●●●●●●●●●●●●●●●
●●●●●●●●●●●●●●●●●●●●●●●●●●●●●●
●●●●●●●●●●●●●●●●●●●●●●●●●●●●●●
●●●●●●●●●●●●●●●●●●●●●●●●●●●●●●
●●●●●●●●●●●●●●●●●●●●●●●●●●●●●●
●●●●●●●●●●●●●●●●●●●●●●●●●●●●●●
●●●●●●●●●●●●●●●●●●●●●●●●●●●●●●
●●●●●●●●●●●●●●●●●●●●●●●●●●●●●●
●●●●●●●●●●●●●●●●●●●●●●●●●●●●●●
●●●●●●●●●●●●●●●●●●●●●●●●●●●●●●
●●●●●●●●●●●●●●●●●●●●●●●●●●●●●●
●●●●●●●●●●●●●●●●●●●●●●●●●●●●●●
●●●●●●●●●●●●●●●●●●●●●●●●●●●●●●
●●●●●●●●●●●●●●●●●●●●●●●●●●●●●●
●●●●●●●●●●●●●●●●●●●●●●●●●●●●●●
●●●●●●●●●●●●●●●●●●●●●●●●●●●●●●
●●●●●●●●●●●●●●●●●●●●●●●●●●●●●●
●●●●●●●●●●●●●●●●●●●●●●●●●●●●●●
●●●●●●●●●●●●●●●●●●●●●●●●●●●●●●
●●●●●●●●●●●●●●●●●●●●●●●●●●●●●●
●●●●●●●●●●●●●●●●●●●●●●●●●●●●●●
●●●●●●●●●●●●●●●●●●●●●●●●●●●●●●
●●●●●●●●●●●●●●●●●●●●●●●●●●●●●●
●●●●●●●●●●●●●●●●●●●●●●●●●●●●●●
●●●●●●●●●●●●●●●●●●●●●●●●●●●●●●
●●●●●●●●●●●●●●●●●●●●●●●●●●●●●●
●●●●●●●●●●●●●●●●●●●●●●●●●●●●●●
●●●●●●●●●●●●●●●●●●●●●●●●●●●●●●
1
2
3
4
5
6
7
8
12345678
Station
Line
LMG14−01 1 m
250 200 150 100 50 0
−1000100200300400500600700800
+++
+ + +
+++
+ + +
+ ++ +
+ + +
0246810121416182022
Station
Line
LMG14−01_1_Chl
250 200 150 100 50 0
−1000100200300400500600700800
+++
+ + +
+++
+ + +
+ ++ +
+ + +
A) Kriging surfaces
-Chlorophyll (shown)
-Nitrate
-Silicate
-Phosphate
-Temperature
-Salinity
C) Biome classification
!
!
!
!
!
!
!
!
!
!
!
!
!
!
!
!
!
!
!
!
!
!
!
!
!
!
!
!
!
!
!
!
!
!
!
!
!
!
!
!
!
!
!
!
!
!
!
!
!
!
!
!
!
!
!
!
!
!
!
!
!
!
!
!
!
!
!
!
!
!
!
!
!
!
!
!
!
!
!
!
!
!
!
!
!
!
!
!
!
!
!
!
!
!
!
!
!
!
!
!
!
!
!
!
!
!
!
!
!
!
!
!
!
!
!
!
!
!
!
!
000
100
200
300
400
500
600
700
800
900
40°0'0"W50°0'0"W
80°0'0"W
60°0'0"S
70°0'0"S
Legend
Palmer LTER basic regional survey grid
! Grid station and grid line number
Sea ice extent (April 2016)
Boundary of April sea ice extend
Bathymetry (NOAA Etopo1 bedrock)
Open ocean (below -3000 m)
Shelf break (-3000 m to -750 m
Shelf, deep (-750 m to -500 m)
Shelf, shallow (-500 m to -60 m)
Nearshore (-60 m to 0m)
Land cover (based on Morgan et al. 2007)
Ice shelves
Glacier (ice sheets)
Ice-free bedrock
Date Saved: 22.09.2016 09:42:15 Document Name: GISdata_Antarctica_20160919
0 100 20050
Kilometers
Antarctic Peninsula
Bellinghausen
Sea
South
Shetland
Islands
Southern
Ocean
Weddel
Sea
Anvers I.
Adelaide I.
Larsen 'C'
Ice Shelf
Alexander I.
Antarctic Peninsula - Environmental domains
1. Spatio-temporal identification & description
of ecosystem service providing units
Fig. 3. Biogeochemically defined biomes (left, for area outlined in orange at right) and land- and
seascape units (right) identified for the WAP. Land- and seascape units are based on Ducklow et al.
(2012) and Morgan et al. (2007).
2. Selection & description of
ecosystem services to analyze
• Provisioning services
• Regulating services
• Cultural services
3. Interviews with PAL-LTER
investigators to assess ecosystem
service flow & climate change impacts
•Structured, audiorecorded interviews with ~15 researchers
from different fields at the PAL-LTER 2016 annual meeting
•Participants briefed about concept and approach as a group;
maps, descriptions and matrix provided at the 1 on 1
interview sessions
•Guided rating of actual & potential flow of ecosystem services
per unit for summer season & potential impacts using a Likert
scale from 0-5
References
Burkhard, B, Kroll, F, Müller, F & Windhorst, W 2009 Landscapes’capacities to provide ecosystem services–a
concept for land-cover based assessments. Landscape online 15 22.
Burkhard, B, Kandziora, M, Hou, Y & Müller, F 2014 Ecosystem service potentials, flows and demands – Concepts
for spatial localisation, indication and quantification. Landscape online.
Ducklow, H, Clarke, A, Dickhut, R, Doney, S C, Geisz, H, Huang, K, Martinson, D G, Meredith, M P, Moeller, H V,
Montes-Hugo, M, Schofield, O, Stammerjohn, S E, Steinberg, D & Fraser, W 2012 The Marine System of the
Western Antarctic Peninsula. Antarctic Ecosystems. John Wiley & Sons, Ltd.
Jacobs, S, Burkhard, B, Van Daele, T, Staes, J & Schneiders, A 2015‘The Matrix Reloaded’: A review of expert
knowledge use for mapping ecosystem services. Ecological Modelling 295 21-30.
Morgan, F, Barker, G, Briggs, C, Price, R & Keys, H 2007 Environmental Domains of Antarctica Version 2.0. Final
Report, Manaaki Whenua Landcare Research New Zealand Ltd.
1. Analyze and cross-validate expert-rated matrices
2. Visulization of results in spatial maps & diagrams
3. Forecast changes to service supply with biogeochemical modeling
2468101214161820
Station
Line
Biome.6 5m
200 150 100 50 0
200300400500600
Fig. 2. To extend the matrix method we augmented traditional land- and seascape units with biogeochemical-
ly defined biomes. Records of temperature, salinity, silicate, nitrate, phosphate, and chlorophyll were used to
train an emergent self organizing map (ESOM). To assign biomes to the study area we constructed kriging sur-
faces from the training data for each year (A), then used the ESOM (B) to classify biomes at the resolution of the
kriged data (C). Example data are from 2014, 1 m depth.
B) ESOM
Download as pdf
Application of the‘matrix’method
Next Steps
2016 ILTER meeting
Kruger National Park, South Africe